JARO
JARO 10: 142–148 (2008) DOI: 10.1007/s10162-008-0146-7
Journal of the Association for Research in Otolaryngology
Effects of Sensorineural Hearing Loss on Visually Guided Attention in a Multitalker Environment VIRGINIA BEST,1,2 NICOLE MARRONE,1 CHRISTINE R. MASON,1 GERALD KIDD JR.,1 1 AND BARBARA G. SHINN-CUNNINGHAM 1
Hearing Research Center, Boston University, Boston, MA 02215, USA School of Medical Sciences F13, University of Sydney, Sydney, NSW 2006, Australia
2
Received: 18 July 2008; Accepted: 17 October 2008; Online publication: 14 November 2008
ABSTRACT
INTRODUCTION
This study asked whether or not listeners with sensorineural hearing loss have an impaired ability to use top–down attention to enhance speech intelligibility in the presence of interfering talkers. Listeners were presented with a target string of spoken digits embedded in a mixture of five spatially separated speech streams. The benefit of providing simple visual cues indicating when and/or where the target would occur was measured in listeners with hearing loss, listeners with normal hearing, and a control group of listeners with normal hearing who were tested at a lower target-to-masker ratio to equate their baseline (no cue) performance with the hearing-loss group. All groups received robust benefits from the visual cues. The magnitude of the spatial-cue benefit, however, was significantly smaller in listeners with hearing loss. Results suggest that reduced utility of selective attention for resolving competition between simultaneous sounds contributes to the communication difficulties experienced by listeners with hearing loss in everyday listening situations.
A common goal in everyday listening situations is to hear out one sound of interest from among a number of other interfering sounds. If the sound is sufficiently salient among its competitors (e.g., because it is loud or possesses a prominent feature), it may be brought to the perceptual foreground relatively automatically. However, top–down attention, directed to some known distinguishing feature of a sound of interest (e.g., pitch, location), can also be invoked to bias the competition in favor of that sound (Desimone and Duncan 1995; Kastner and Ungerleider 2000; ShinnCunningham 2008). For the case of mixtures of speech sounds, prior knowledge about where a target will be located can greatly enhance its intelligibility (Ericson et al. 2004; Kidd et al. 2005a). Best et al. (2007) examined the benefits of attentional cueing when listeners were presented with five simultaneous streams of speech presented from five loudspeakers. The streams were unintelligible (time-reversed sequences of numbers) except for a relatively brief, intelligible target (a fivedigit sequence of numbers) that occurred from a randomly chosen loudspeaker at an unpredictable time. In this paradigm, competition between the sources was high, the salience of the target was low, and thus, the dependence on top–down attention was maximized. With no cues provided, it was assumed that listeners either divided their attention across the five loudspeakers or scanned them sequentially (“serial search,” Wolfe 1998). Performance was relatively poor on the task, but was improved when a simple visual cue indicated where the target would occur. In the same study, temporal attention was
Keywords: speech intelligibility, top–down attention, spatial attention, hearing impairment
Correspondence to: Virginia Best & School of Medical Sciences F13 & University of Sydney & Sydney, NSW 2006, Australia. Telephone: +612-93517615; email:
[email protected] 142
ET AL.:
143
Hearing Loss and Attention
investigated using a visual cue that indicated when to listen for the target. Listeners received a small and inconsistent benefit from this cue. Complex listening situations of this kind are extremely difficult for listeners with sensorineural hearing loss (e.g., Gatehouse and Noble 2004; Noble 2008). The goal of the current study was to explore in more detail the sources of this difficulty. In particular, we adopted the paradigm of Best et al. (2007) to identify whether listeners with sensorineural hearing loss (HL) are able to use top–down attention to enhance speech intelligibility to the same extent as listeners with normal hearing (NH). Based on previous work, we expected HL listeners to be poorer overall at understanding speech in the presence of competition (e.g., Bronkhorst and Plomp 1992; Mackersie et al. 2001; Arbogast et al. 2005; Marrone et al. 2008). This deficit is thought to arise from several factors including reduced audibility and reduced spectral resolution (Baer and Moore 1994; Gaudrain et al. 2007; Moore 2007). However, it was not clear from previous work whether HL listeners would show specific deficits related to top–down attention. One possibility was that the weaker ability of HL listeners to understand speech in the presence of competition would lead to an increased dependence on top–down attention. Alternatively, since it has been argued that selective attention operates by enhancing perceptual objects with a desired feature (Shinn-Cunningham 2008), and hearing loss causes a degraded representation of competing sources and their features, HL listeners may be less able to make use of cues that guide top–down attention.
0
Hearing threshold level (dB)
BEST
NH 20
40
HL 60
80
Left ear Right ear
100 250
500
1000
2000
4000
8000
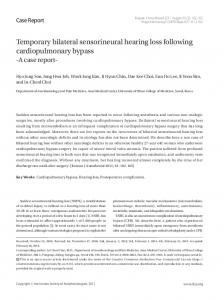
Frequency (Hz) FIG. 1. Across-subject mean pure-tone thresholds for left and right ears in the normal-hearing (NH) and hearing loss (HL) listener groups. Error bars indicate SDs.
listeners (NH group). To compare cueing effects for the two listener groups when baseline performance was in a similar range, another group of NH listeners (one from the NH group and three additional listeners) completed the experiment with the target level reduced by 3 dB to increase the overall difficulty (NH −3 dB group). All listeners were paid for their participation. The experimental protocols were approved by the Boston University Charles River Campus Institutional Review Board.
Environment METHODS Listeners Seven HL listeners (two males, five females, aged 19– 42 years) and eight NH listeners (three males, five females, aged 19–30 years) participated in the experiment. Mean audiograms for both groups are shown in Figure 1. The HL group had bilateral, symmetric, mild to moderately severe, sloping sensorineural hearing loss. The mean pure-tone average (for frequencies of 500, 1,000, and 2,000 Hz) across the group was 50 dB HTL. Six of the seven were regular hearing-aid wearers but participated in the experiment with their aids removed. The NH listeners were screened to ensure that they had pure-tone thresholds in the normal range (no greater than 15 dB HTL) for frequencies between 250 Hz and 8 kHz. All subjects had self-reported normal (or corrected to normal) vision. Five of the NH listeners completed an experiment that was identical to the one completed by the HL
The experiments took place in a single-walled booth (Industrial Acoustics Company) with interior dimensions of 3.8 m×4.0 m×2.3 m (length, width, height), with perforated metal panels on the walls and ceiling and a carpeted floor. Stimuli were presented via five loudspeakers (Acoustic Research 215PS) located on an arc approximately 1.5 m from the listener at the level of the ears (see Fig. 2a). The loudspeakers were positioned within the visual field at lateral angles of −30°, −15°, 0°, 15°, and 30°, a slightly different loudspeaker arrangement than that used in Best et al. (2007), who used a wider angular separation (20°) and a shorter arc radius (1 m). The listener was seated on a chair in the center of the loudspeaker arc, with a head rest to minimize head movements. No instructions were given regarding eye fixation during stimulus delivery. Responses were indicated using a handheld keypad. The booth was kept dark during the experiment, except for a small lamp to illuminate the keypad. Digital stimuli were generated on a computer located outside the booth and fed through five
144
BEST
(A) 2 3
1.5 m
5
(B)
1 2 3 4
Stimuli T
NO CUE
T
WHERE
T
WHEN
T
BOTH
5 1 2 3 4 5 1 2 3 4
Loudspeaker position
5 1 2
Hearing Loss and Attention
separate channels of Tucker-Davis Technologies hardware. Signals were converted at 40 kHz by a 16-bit digital-to-analog converter (DA8), low-pass filtered at 20 kHz (FT6), attenuated (PA4), and passed through power amplifiers (Tascam) before presentation to the loudspeakers. Each loudspeaker had a light-emitting diode (LED) affixed on its top surface, which was controlled from the computer via a custom-built switchboard.
1
4
ET AL.:
Targets were sequences of spoken digits from the TIDIGIT database (Leonard 1984). Each sequence consisted of five digits from the set 1–9 spoken by one of 20 male talkers. A total of 125 target sequences were chosen for use in the experiment. As the sequences were naturally spoken, an acoustic analysis was conducted to determine whether or not there were any systematic variations in level during the sequences. For each sequence, a running root-meansquare (RMS) level calculation was done using 10 ms windows. The resulting level vectors were then resampled in time so that their start and end points were aligned, to adjust for differences in overall duration. The mean level of the digit sequences is plotted as a function of time in Figure 3. Because of variations in speaking rate, the first and last digits are better aligned with this time normalization than are the middle three digits, explaining the differences in the width of the level peaks. However, on average, a small drop in level over the course of the sequence is evident.
3 4
5
5
4
FIG. 2. A Schematic of the layout of the five loudspeakers relative to the listener’s head. B Schematic of the four attention conditions. Sounds were presented from the five loudspeakers simultaneously and were divided into five contiguous time segments. The forwardspeech target (T) was presented during one random time segment from one random loudspeaker, and in that time segment, the other four loudspeakers contained maskers. In all nontarget time segments, maskers were presented from all loudspeakers. While the auditory stimuli were the same across conditions, visual cues (gray regions) varied in order to manipulate attention. In the no cue condition, there was no visual cue; in the other three conditions, the cue indicated where or when to listen (or both).
Relative level (dB)
3
Time
2 1 0 −1 −2 −3 −4 −5
0
0.25
0.5
0.75
1
Time (normalized) FIG. 3. Mean level variations over time for the five-digit target sequences (averaged across the 125 target sequences after timenormalization).
BEST
ET AL.:
145
Hearing Loss and Attention
To create a spectro-temporally similar but unintelligible masking sound, the set of target sequences was concatenated, and the new long sequence was reversed in time. Individual maskers were then generated by selecting an arbitrary starting point within this long sequence and extracting a section of appropriate length (note that because of this random selection, there was no consistent change in masker level over time). A 10-ms cosine-squared ramp was applied to each end of the extracted section of masker to avoid abrupt changes in amplitude. While these reversedspeech samples had a different temporal profile than the forward-speech targets, they possessed similar modulations and spectral features and were found to be very effective maskers. Each of the five loudspeakers presented an ongoing signal that was divided into five contiguous time segments. On any trial, the target occurred randomly from one loudspeaker during one time segment (see Fig. 2b). The other four loudspeakers presented maskers during this time segment, and in nontarget time segments, all five loudspeakers presented maskers. All maskers were generated with the same duration as the target on a given trial. Target sequences ranged from 1.6–3.7 s in duration, for total stimulus durations in the range 8–18.5 s. For the HL and NH groups, signal level was equated across the loudspeakers such that the target was equal in RMS level to each of the maskers (0 dB target-to-masker ratio). The NH −3 dB group was tested with the target attenuated by 3 dB relative to the level of the individual maskers (−3 dB target-tomasker ratio).
Procedures Before testing, each listener’s single-digit identification threshold in quiet was measured using an adaptive procedure. The procedure consisted of 25 trials in which randomly drawn single digits (1–9), spoken by the same set of talkers used in the main experiment, were presented from the central loudspeaker (at 0°). Listeners identified the digits using the handheld keypad. Presentation level was varied using a one-up, one-down rule to track the 50% correct point on the psychometric function. The initial step-size was 4 dB; after four reversals, the step-size was decreased to 2 dB. The threshold calculation was based on all reversals after the first three (or four, to give an even number of reversals), and on average, seven reversals went into the calculation. Two tracks were completed, and the two resulting thresholds were averaged. Digit identification thresholds ranged from 2 to 9 dB SPL (mean 5 dB SPL) for the NH listeners and from 23 to 47 dB SPL (mean 37 dB SPL) for the HL listeners.
In the main experiment, all stimuli were presented at a level 30 dB above this threshold. To verify that listeners could identify the five-digit target sequences at the chosen level, a 25-trial identification test was conducted in the absence of any maskers. Randomly drawn target sequences were presented from one of the five loudspeakers. Listeners identified the digits using the handheld keypad. All listeners obtained scores of greater than 97% in this verification task. Four experimental conditions were tested in the main experiment where the target sequences were embedded in maskers. While the general design of the auditory stimulus was identical across the four conditions, visual cues were varied to manipulate the attention of the listener (see Fig. 2b): 1. no cue: no visual cue was given. 2. where: the LED located on the target loudspeaker lit up synchronously with the onset of the first time segment and remained on for the entire stimulus. 3. when: all of the five LEDs lit up at the start of and were turned off at the end of the time segment containing the target. 4. both: the LED located on the target loudspeaker lit up only for the duration of the time segment containing the target. The different conditions were run in blocks of 25 trials. Listeners were informed at the beginning of each block as to the kind of visual cue they would receive during that block. A session consisted of one block in each of the four attention conditions. Each listener completed five sessions (approximately an hour each) over the course of two to three visits. The order of the four conditions was random and different between sessions and listeners. In both the quiet and masked conditions, listeners were instructed to give a response containing five digits, in the order in which they were presented, and to guess if uncertain of one or more digits. Responses were scored on a per-digit basis and pooled across trials to give scores in percent correct for analysis and plotting. For each subject in each condition, percent correct scores were based on 125 responses per digit (or 625 responses when collapsed across digit position). As there were nine possible choices per digit, chance performance was 11% in this task.
RESULTS Across-subject mean scores (in percent correct) are shown in the top panel of Figure 4 (error bars indicate SEs of the means). The three sets of bars represent the three listener groups (from left: HL, NH, and NH −3 dB). The four bars within a group represent the four attention conditions, as labeled.
146
BEST
NO CUE WHERE
WHEN BOTH
Cue benefit (percentage points)
Performance (percent correct)
100 80 60 40 20 0 30 20 10 0
HL
NH
NH −3 dB
Listener group FIG. 4. Across-subject mean performance (top panel) and cue benefits (bottom panel) for the three groups of listeners (HL hearing loss, NH normal-hearing, NH −3 dB normal-hearing with an attenuated target). The four bars for each group represent the four attention conditions. Error bars indicate SEs of the means.
HL
Hearing Loss and Attention
NH
NH –3 dB
Performance (percent correct)
100 80 60 40 NO CUE WHERE WHEN BOTH
20 0 30
Cue benefit (percentage points)
Overall, the patterns of performance were comparable to those described in Best et al. (2007), with performance for all listeners being poorest in the no cue condition, intermediate in the where and when conditions, and best in the both condition. The HL group performed more poorly overall (on average, 41–59% across conditions) than the NH group (on average, 63–81% across conditions). The manipulation of the target level in the NH −3 dB group achieved its goal, as the mean performance of this group in the no cue condition (45%) was similar to the mean performance of the HL group (41%). To examine directly the benefit of the different visual cues, scores in the no cue condition were subtracted from scores in the other conditions for each listener. Across-subject means of these “cue benefits” for each group are shown in the bottom panel of Figure 4 (error bars indicate SEs of the means). In the HL group, the where and when cues improved performance by an average of 10 and 8 percentage points, respectively. In the NH group, the analogous benefits were 15 and 9 percentage points. Listeners in the NH −3 dB group obtained performance gains of 19 and 8 percentage points in the corresponding conditions. Thus, the HL group received approximately the same benefit of knowing when the target would occur as the two NH groups, but gained less benefit from knowing where to listen than either NH group. T tests (pG0.05) indicated that the HL group obtained a significantly smaller where cue benefit than both NH groups, and a smaller both cue benefit when compared to the NH −3 dB group only. The when cue benefit was not
ET AL.:
20
10
0
1
2
3
4
Digit position
5
1
2
3
4
Digit position
5
1
2
3
4
5
Digit position
FIG. 5. Across-subject mean performance (top panel) and cue benefits (bottom panel) as a function of digit position for the three groups of listeners (HL hearing loss, NH normal-hearing, NH −3 dB normal-hearing with an attenuated target). The four different lines and symbols represent the four attention conditions. Error bars indicate SEs of the means.
significantly different between any two listener groups. Figure 5 plots across-subject mean data broken down to show performance as a function of word position within the five-digit sequence. The left, middle, and right panels show data for the HL, NH, and NH −3dB groups, respectively. In the top panels, across-subject mean performance is plotted (error bars indicate SEs of the means), and the four lines represent the four attention conditions, as labeled. While the NH groups performed relatively consistently across the five digits, the HL group performed more poorly on the later digits. A repeated measures analysis of variance (ANOVA) was conducted on the scores (with condition and word position as withinsubjects factors and listener group as a betweensubjects factor). While the three-way interaction was not significant [F(24,156)=1.4, p=0.10], the two-way interactions between condition and word position [F (12,156)=4.6, pG0.001], condition and listener group [F(6,39)=5.0, pG0.005], and word position and listener group [F(8,52)=8.3, pG0.001] were all significant. The latter interaction supports the observation made above that the NH and HL showed different patterns of performance across time. In the bottom panels of Figure 5, across-subject mean cue benefits are plotted as a function of digit position (error bars indicate SEs of the means). Here, the reduced benefit of the where cue in the HL group is clearly visible. In terms of the temporal profile of cueing, cue benefits tend to be larger for earlier
BEST
ET AL.:
Hearing Loss and Attention
digits, but there are no striking differences in the temporal profile across listener groups. A repeated measures ANOVA was conducted on the cue benefits (with condition and word position as within-subjects factors and listener group as a between-subjects factor). While the three-way interaction was not significant [F(16,104)=1.2, p=0.29], the two-way interactions between condition and word position [F (8,104)=3.6, pG0.005] and condition and listener group [F(4,26)=6.3, pG0.005] were significant. The interaction between word position and listener group was not significant [F(8,52)=1.9, p=0.07], confirming the observation that the cue benefits varied in a similar way over time in all listener groups.
DISCUSSION Listeners in the current study were faced with the difficult task of identifying a speech target embedded in a mixture of equal-level reversed-speech maskers. In the absence of cues to guide the focusing of top– down attention, listeners presumably divided their attention across the array of competing sources or scanned through the array serially in order to pull out and identify the target. This process may have been enhanced by an inherent salience of forward speech amidst time-reversed speech (Asemi et al. 2003; Cusack and Carlyon 2003). Although both NH and HL groups performed well above chance on the uncued task, the HL group performed more poorly than the NH group. This was expected on the basis of previous work showing that real or simulated hearing loss impairs one’s ability to make use of differences in voice characteristics (Baer and Moore 1994; Mackersie et al. 2001; Gaudrain et al. 2007), masker fluctuations (Duquesnoy 1983; Festen and Plomp 1990; Bronkhorst and Plomp 1992; Lorenzi et al. 2006), and spatial separation (Bronkhorst and Plomp 1989; Arbogast et al. 2005; Marrone et al. 2008) to understand a talker of interest. It also may be that reductions in spectrotemporal resolution would have reduced the salience of the target by, for example, blurring the distinction between forward and time-reversed speech. When we examined the temporal profile of performance across the five-digit sequence, performance was essentially constant for the NH listeners but tended to decrease from digit to digit for the HL listeners. These findings are interesting in light of recent results using a similar digit recall task (without any temporal uncertainty), in which NH listeners were better at selectively attending to a digit at the end of a sequence than at the beginning of the sequence when the digits came from a fixed location (Best et al. 2008). However, in the earlier study, each digit was
147
articulated separately, so that all digits had the same average energy. It may be that any buildup of selective spatial attention was counteracted in the current study by the small decrease in level over the course of the sequence (Fig. 3); indeed, for the HL listeners, the effect of level appears to dominate. However, the specific goal of the present study was to examine whether the ability of HL listeners to use visually guided top–down attention to enhance the intelligibility of a speech target differed from that of NH listeners. We found that HL listeners did obtain significant benefits from visual cues indicating where and/or when to listen for the target. These benefits were, in general, most helpful for the earlier digits in the sequence for both HL and NH listeners. The benefit of knowing when to listen was modest in HL listeners, but comparable in magnitude to that seen in the NH listeners. However, the benefit of knowing where to listen was significantly smaller in the HL group than in the NH group. This difference in the efficacy of spatially directed attention cannot be explained by differences in the overall difficulty of the task, as the NH −3 dB group (whose listeners were presented with a lower target-to-masker-ratio that resulted in a mean no cue performance level comparable to that of the HL group) obtained the largest benefit of all. Just as in the visual system, top–down attention to a target feature in the auditory system is thought to bias competition between competing perceptual objects in favor of the target (Darwin and Hukin 1999; ShinnCunningham 2008). The present results suggest that if the representation of the competing objects and their features is degraded due to sensorineural hearing loss, there may be a concomitant reduction in the efficacy of top–down attention. Specifically, we hypothesize that reductions in spectral and temporal acuity in HL listeners impair the representation of the auditory scene (including talkers at specific and distinct locations), which in turn reduces the ability to selectively attend to a particular object (the target talker) at a visually cued location. Another way of thinking about these results is in terms of energetic and informational masking (e.g., Carhart et al. 1969; Brungart et al. 2001; Durlach et al. 2003; Kidd et al. 2005b). Energetic masking refers to the loss of audibility of a target sound due to interfering sounds that overlap with it spectrotemporally. Informational masking is not related as directly to audibility, but generally arises when a target occurs in the midst of similar maskers. Informational masking has been related both to confusion about which acoustic elements belong to the target and to uncertainty about how to allocate attention (Durlach et al. 2003). Both energetic and informational masking typically occur in multiple-talker mixtures, and
148
both undoubtedly contribute to the difficulty of the task used in this experiment. Importantly, the benefit of top–down attention is thought to arise primarily via a release from informational masking (e.g., Freyman et al. 2004; Shinn-Cunningham et al. 2005). It has been suggested previously that HL listeners show proportionally more energetic masking than NH listeners because their reduced spectrotemporal resolution increases the overlap of competing sources in the periphery (Arbogast et al. 2005). This increase in energetic masking may put a limit on performance and effectively reduce the release from informational masking that can be obtained via spatially directed attention. So why were the benefits of directing attention in time unaffected by hearing loss? In a related, previous study (Best et al. 2007), it was suggested that spatial and temporal visual cues invoke different and independent modes of attention (see also Posner and Boies 1971; Raz and Buhle 2006). While directing attention to a stimulus feature (e.g., location or voice quality) modulates the responses of different neural populations in order to bias competition, directing attention in time may have the more general effect of enhancing vigilance at the right time. The benefit of modulating this mode of attention appears to be unaffected by how well the target is segregated from its competitors or the balance between energetic and informational masking, presumably because the benefit of increasing overall vigilance does not have as strong a dependence on the amount of competition between simultaneous objects. The current experiment utilized a dynamic listening paradigm in which a speech target occurred unpredictably in time and space amidst multiple competing talkers. The most important finding was that HL listeners received a significantly reduced benefit from visual cues indicating where the target would occur, suggesting that limitations on the effectiveness of top–down attention may contribute to the negative impact hearing impairment has on communication in everyday environments. In another recent study (Gatehouse and Akeroyd 2008), a large group of HL listeners was tested on a speech task involving both the monitoring of sequential sentences that changed in location from sentence to sentence (to simulate a dynamic multiperson conversation), and the identification/localization of occasional target words that occurred at random locations (to simulate interruptions that might be of importance). Although the task and stimuli were very different from those in our study, the goal was also to measure the benefits of spatial and temporal visual cueing on performance. The results showed only minor benefits of either type of attentional cueing, which were smaller than those obtained by the HL group in the
BEST
ET AL.:
Hearing Loss and Attention
current study. However, as the study did not include a comparison to NH listeners, it cannot be said with certainty whether these modest benefits represent a deficit relative to what would have been achievable with normal hearing in those task conditions. Unfortunately, there are very few other studies exploring why HL listeners have particular difficulties in complex, dynamic listening environments. However, there is a growing awareness that these situations are exactly the kind in which these listeners are most likely to experience handicap and in which their hearing aids provide the least relief (Gatehouse and Noble 2004; Noble 2008). New experimental approaches to studying the interaction between hearing loss and selective attention will be critical for the development of rehabilitation strategies that can enhance communication in real environments.
ACKNOWLEDGMENTS This work was supported by grants from AFOSR (FN2005004032), NIH/NIDCD (DC00100, DC004545 and DC004663), and ONR (N00014-07-1-0061). Virginia Best was also supported in part by a University of Sydney Postdoctoral Research Fellowship. The results were presented in part at the International Symposium on Auditory and Audiological Research, Denmark, August 2007. The authors would like to thank the Associate Editor, Andrew Oxenham, and two anonymous reviewers for very helpful comments on an earlier version of the manuscript.
REFERENCES ARBOGAST TL, MASON CR, KIDD G, JR. The effect of spatial separation on informational masking of speech in normal-hearing and hearingimpaired listeners. J. Acoust. Soc. Am. 117:2169–2180, 2005. ASEMI N, SUGITA Y, SUZUKI Y. Auditory search asymmetry between normal Japanese speech sounds and time-reversed speech sounds distributed on the frontal-horizontal plane. Acoust. Sci. Tech. 24:145–147, 2003. BAER T, MOORE BCJ. Effects of spectral smearing on the intelligibility of sentences in the presence of interfering speech. J. Acoust. Soc. Am. 95:2277–2280, 1994. BEST V, OZMERAL EJ, SHINN-CUNNINGHAM BG. Visually-guided attention enhances target identification in a complex auditory scene. J. Assoc. Res. Otolaryngol. 8:294–304, 2007. BEST V, OZMERAL EJ, KOPČO N, SHINN-CUNNINGHAM BG. Object continuity enhances selective auditory attention. Proc. Nat. Acad. Sci. 105:13173–13177, 2008. BRONKHORST AW, PLOMP R. Binaural speech intelligibility in noise for hearing-impaired listeners. J. Acoust. Soc. Am. 86:1374–1383, 1989. BRONKHORST AW, PLOMP R. Effect of multiple speechlike maskers on binaural speech recognition in normal and impaired hearing. J. Acoust. Soc. Am. 92:3132–3139, 1992. BRUNGART DS, SIMPSON BD, ERICSON MA, SCOTT KR. Informational and energetic masking effects in the perception of multiple simultaneous talkers. J. Acoust. Soc. Am. 110:2527–2538, 2001.
BEST
ET AL.:
Hearing Loss and Attention
CARHART R, TILLMAN TW, GREETIS ES. Perceptual masking in multiple sound backgrounds. J. Acoust. Soc. Am. 45:694–703, 1969. CUSACK R, CARLYON RP. Perceptual asymmetries in audition. J. Exp. Psych. Human Percept. Perform. 29:713–725, 2003. DARWIN CJ, HUKIN RW. Auditory objects of attention: the role of interaural time differences. J. Exp. Psychol. 25:617–629, 1999. DESIMONE R, DUNCAN J. Neural mechanisms of selective visual attention. Ann. Rev. Neurosci. 18:193–222, 1995. DUQUESNOY AJ. Effect of a single interfering noise or speech source upon the binaural sentence intelligibility of aged persons. J. Acoust. Soc. Am. 74:739–743, 1983. DURLACH NI, MASON CR, KIDD JR G, ARBOGAST TL, COLBURN HS, SHINNCUNNINGHAM BG. Note on informational masking. J. Acoust. Soc. Am. 113:2984–2987, 2003. ERICSON MA, BRUNGART DS, SIMPSON BD. Factors that influence intelligibility in multitalker speech displays. Int. J. Aviation Psych. 14:311–332, 2004. FESTEN JM, PLOMP R. Effects of fluctuating noise and interfering speech on the speech-reception threshold for impaired and normal hearing. J. Acoust. Soc. Am. 88:1725–1736, 1990. FREYMAN RL, BALAKRISHNAN U, HELFER KS. Effect of number of masking talkers and auditory priming on informational masking in speech recognition. J. Acoust. Soc. Am. 115:2246–2256, 2004. GATEHOUSE S, AKEROYD MA. The effects of cueing temporal and spatial attention on word recognition in a complex listening task in hearing-impaired listeners. Trends Amplif. 12:145–161, 2008. GATEHOUSE S, NOBLE W. The Speech, Spatial and Qualities of Hearing Scale (SSQ). Int. J. Audiol. 43:85–99, 2004. GAUDRAIN E, GRIMAULT N, HEALY EW, BÉRA JC. Effect of spectral smearing on the perceptual segregation of vowel sequences. Hearing Res. 231:32–41, 2007. KASTNER S, UNGERLEIDER LG. Mechanisms of visual attention in the human cortex. Annu. Rev. Neurosci. 23:315–341, 2000.
149
KIDD G, JR, ARBOGAST TL, MASON CR, GALLUN FJ. The advantage of knowing where to listen. J. Acoust. Soc. Am. 118:3804–3815, 2005a. KIDD G, JR, MASON CR, BRUGHERA A, HARTMANN WM. The role of reverberation in release from masking due to spatial separation of sources for speech identification. Acust. Acta Acust. 114:526– 536, 2005b. LEONARD RG. A database for speaker independent digit recognition. Proc. ICASSP'84 9:328–331, 1984. LORENZI C, GILBERT G, CARN H, GARNIER S, MOORE BCJ. Speech perception problems of the hearing impaired reflect inability to use temporal fine structure. PNAS 103:18866–18869, 2006. MACKERSIE C, PRIDA T, STILES D. The role of sequential stream segregation and frequency selectivity in the perception of simultaneous sentences by listeners with sensorineural hearing loss. J. Speech. Lang. Hear. Res. 44:19–28, 2001. MARRONE N, MASON CR, KIDD G, JR. The effects of hearing loss and age on the benefit of spatial separation between multiple talkers in reverberant rooms. J. Acoust. Soc. Am. 2008 (in press). MOORE BCJ. Cochlear hearing loss: physiological, psychological, and technical issues. Chichester, UK, Wiley, 2007. NOBLE W. Auditory reality and self-assessment of hearing. Trends Amplif. 12:113–120, 2008. POSNER MI, BOIES SJ. Components of attention. Psychol. Rev. 78:391– 408, 1971. RAZ A, BUHLE J. Typologies of attentional networks. Nat. Reviews Neurosci. 7:367–379, 2006. SHINN-CUNNINGHAM BG. Object-based auditory and visual attention. Trends Cog. Sci. 12:182–186, 2008. SHINN-CUNNINGHAM BG, IHLEFELD A, SATYAVARTA, LARSON E. Bottom–up and top–down influences on spatial unmasking. Acustica united with Acta Acustica 91:967–979, 2005. WOLFE JM. Visual search. In: Pashler H (ed) Attention. Psychology Press, Hove, England, pp. 13–73, 1998.