An alternative is to set up off-line look-up tables [12] for certain input values. With the ..... different window sizes and for different types of input data. The exe-.
Efficient Algorithms for Atmospheric Correction of Remotely Sensed Data� Hassan Fallah-Adl 1 Joseph J´aJ´a 1 y Shunlin Liang 2 Yoram J. Kaufman 3 John Townshend 2 Institute for Advanced Computer Studies (UMIACS) University of Maryland, College Park, MD 20742 Abstract Remotely sensed imagery has been used for developing and validating various studies regarding land cover dynamics. However, the large amounts of imagery collected by the satellites are largely contaminated by the effects of atmospheric particles. The objective of atmospheric correction is to retrieve the surface reflectance from remotely sensed imagery by removing the atmospheric effects. We introduce a number of computational techniques that lead to a substantial speedup of an atmospheric correction algorithm based on using look-up tables. Excluding I/O time, the previous known implementation processes one pixel at a time and requires about 2.63 seconds per pixel on a SPARC-10 machine, while our implementation is based on processing the whole image and takes about 4-20 microseconds per pixel on the same machine. We also develop a parallel version of our algorithm that is scalable in terms of both computation and I/O. Experimental results obtained show that a Thematic Mapper (TM) image (36 MB per band, 5 bands need to be corrected) can be handled in less than 4.3 minutes on a 32-node CM-5 machine, including I/O time.
Keywords: High Performance Computing, Atmospheric Correction, Scalable Parallel Processing, Parallel I/O, Remote Sensing, TM, AVHRR. � This work is partly supported under the NSF Grand Challenge Grant No. BIR9318183. y The work of this author is partially supported by NSF under Grant No. CCR9103135. 1 UMIACS and Department of Electrical Engineering. 2 Department of Geography. 3 Laboratory for Atmospheres, code 913, NASA Goddard Space Flight Center.
1
1 Introduction Remotely sensed imagery has been used for developing and validating various studies regarding land cover dynamics such as global carbon modeling, biogeochemical cycling, hydrological modeling, and ecosystem response modeling. Data from the Landsat series of satellites have been available since 1972. The primary source of data from the first three satellites was the Multispectral Scanner System (MSS ). The Thematic Mapper (TM) of Landsats 4 and 5 represents a major improvement compared with the MSS in terms of spectral resolution (4 wave-bands for MSS, 7 narrower wave-bands for TM), and spatial resolution (79 meters for MSS, and 30 meters for TM). The TM data have been widely used for resource inventory, environmental monitoring, and a variety of other applications [1]. Since 1979, the Advanced Very High Resolution Radiometers (AVHRR) on board of the National Oceanic and Atmospheric Administration (NOAA) series of satellites have been in continuous polar orbit. AVHRR has allowed us for the first time to improve our studies of the earth surface from the regional scale to the global scale using remote sensing techniques [1, 2]. The radiation from the earth surface, which highly characterizes surface inherent properties, are largely contaminated by the atmosphere. The atmospheric particles (aerosols and molecules) scatter and absorb the solar photons reflected by the surface in such a way that only part of the surface radiation can be detected by the sensor. On the other hand, atmospheric particles scatter the sunlight into the sensor’s field of view directly, resulting in a radiation that does not contain any surface information at all. The combined atmospheric effects due to scattering and absorption are wavelength dependent, vary in time and space, and depend on the surface reflectance and its spatial variation [3]. For TM band 1, it is likely that the aerosol contribution is of the order of 50% even for relatively clear sky conditions. Although qualitative evaluation of these remotely sensed data have been very useful, the developments of the quantitative linkages between the satellite imagery and the surface characteristics greatly depend on the removal of the atmospheric effects. The objective of the so-called atmospheric correction is to retrieve the surface reflectance from remotely sensed imagery. It has been demonstrated [4, 5] that the atmospheric correction can significantly improve the accuracy of image classification. Atmospheric correction algorithms basically consist of two major steps. First, the optical characteristics of the atmosphere are estimated either by using special features of the ground surface or
2
by direct measurements of the atmospheric constituents [7] or by using theoretical models. Various quantities related to the atmospheric correction can then be computed by the radiative transfer algorithms given the atmospheric optical properties. Second, the remotely sensed imagery can be corrected by inversion procedures that derive the surface reflectance, as we will shortly discussed in more details. In this paper, we will focus on the second step, describing our work on improving the computational efficiency of the existing atmospheric correction algorithms. In Section 2, we present background material, while a known atmospheric correction algorithm is described in Section 3. We describe in Section 4 a substantially more efficient version of the algorithm. In Section 5, we develop a parallel implementation of our algorithm, that is scalable in terms of number of processors, internal memory size, and number of I/O nodes. A case study is presented in Section 6 and concluding remarks are given in Section 7.
2 Background 2.1
Atmospheric Correction
In order to correct for the atmospheric effects, the relationship between the upward radiance Lm measured by the satellite and the surface reflectance � has to be established. The radiative transfer theory is used for this purpose. Assuming that the atmosphere is bounded by a Lambertian surface (i.e., reflects solar energy isotropically), the upward radiance at the top of the cloud-free, horizontally homogeneous atmosphere can be expressed by [6] :
dT Lm=L0 + �(�F ; 1 ? s�)
(1)
where L0 is the upward radiance of the atmosphere with zero surface reflectance, often called path radiance, Fd is the downward flux (total integrated irradiance) at the ground, T is the transmittance from the surface to the sensor (the probability that a photon travels through a path without being scattered or absorbed), and s is the atmospheric albedo (the probability that a photon reflected from the surface is reflected back to the surface). From Eqn. (1) we can see that the factor 1?�s� is the sum of the infinite series of interactions between the surface and the atmosphere n (s�)n . In order to invert � from Lm through Eqn. (1) , we need to determine
P
the quantities L0 , Fd, T , and s which are functions of the wavelength, 3
atmospheric optical properties, and a set of locational parameters. Given the aerosol optical depth, the determination of L0 , Fd , T , and s in Eqn. (1) is not a simple task due to the fact that these quantities are related to the solutions of the radiative transfer equation [6], which is an integro-differential equation from which no analytical solution is available. There are a couple of approaches for obtaining practical solutions. The first is to use a numerical iterative approach, such as the discrete-ordinate algorithm [8], and the Gauss-Seidel algorithm [9]. The resulting solutions are accurate but the methods involved are computationally very expensive and not feasible for large scale studies. Another approach is to simplify the radiative transfer equation by using approximations, such as the two-stream approximation [10], and the four-stream approximation [11]. These approximation algorithms are computationally efficient, but the accuracy is limited. An alternative is to set up off-line look-up tables [12] for certain input values. With the additional tables, the quantities (L0 , Fd , T , and s) can be efficiently calculated with high accuracy using interpolations. This approach has been followed in this study and is referred to as the look-up table approach.
2.2
Why High Performance Computing (HPC)?
The existing code [12] for atmospheric correction based on the lookup table approach processes one pixel at a time (and meant to be used interactively), and takes 2.63 seconds to correct a single pixel on a SPARC-10 machine, excluding I/O. A single TM image that covers an area of size 180Km � 180Km consists of approximately 36 million pixels per band, and will therefore require more than 15 years to correct with the existing code, excluding the I/O time. We address this apparent intractability by attempting to achieve the following two objectives:
� �
Minimize the overall computational complexity while maintaining the accuracy of the algorithm. Maximize the scalability of the computation and the I/O as a function of the available resources (computation nodes, I/O nodes, and size of internal memory).
We believe that our algorithm, to be described in the rest of this paper, achieves both objectives simultaneously. In fact, we are able to correct a TM image in less than 13 minutes on SPARC-10 (excluding I/O) and in less than 4.3 minutes on a 32-processor CM-5 (including I/O)4. 4 About half of this time is spent for I/O. Also each node on our CM5 is a SPARC-2 processor which is about five times slower than SPARC-10.
4
2.3
Data Sources
In our studies, TM and AVHRR are used as the primary sources of input data to our algorithm. The essential features of these imagery types are as follows. The TM imagery consists of 7 channels that correspond to 7 spectral bands. The resolution is 30m and five bands need to be corrected (band 6 corresponds to the thermal channel and the atmosphere does not have much scattering effect on band 7) [13]. An image covers approximately an area of size 180Km � 180Km and requires 36MB per channel. The Pathfinder AVHRR imagery consists of 12 channels from which only 5 channels are original band information and only 2 bands need to be corrected [14]. The remaining channels provide location, quality , cloud, and time information. Each band requires about 20MB and the resolution is 8Km. Each AVHRR image covers the entire globe.
3 Atmospheric Correction Algorithm 3.1
Description of Algorithm
A direct implementation of an atmospheric correction algorithm based on the look-up table approach has been described in [12], where a Fortran version is given. The overall algorithm can be sketched as follows. Algorithm (Atmospheric Correction) Input: N pixel values with the following information for each pixel: measurement wavelength, atmospheric correction parameters, location information and the day of measurement. Moreover, look-up tables are provided. Output: The surface reflectance at each pixel. for each pixel do: Step A: Read input parameters and appropriate look-up tables. Step B: Perform initializations and required normalizations. Step C: Compute L0 , Fd , T and s by interpolation, using the look-up tables. Step D: Compute the surface reflectance � using Eqn. (1). 5
In step B, we compute the solar flux for the measured wavelength by linear interpolation (using the spectral irradiances and earth-sun distance for given wavelengths). Then we correct the solar flux for the day of the year for which the measurement is made and we use the result to convert the measured radiance Lm from absolute units to reflectance units. We also compute the default values of the water and gaseous (carbon-dioxide and ozone) absorption by linear interpolation of the measured wavelength. All the interpolations in step B are spline interpolations of degree one. A spline interpolation consists of polynomial pieces on subintervals joined together with certain continuity conditions. Formally, suppose that a table of n + 1 data points (xi ; yi ) is given, where 0 � i � n and x0 < x1 < : : : < xn is satisfied. A spline function of degree k on these n + 1 points is a function, S such that, (1) S (xi ) =yi, (2) on each interval [xi; xi+1), S is a polynomial of degree � k , and (3) S has a continuous (k ? 1)st derivative on [x0; xn ]. Thus the spline interpolation of degree one is a piecewise linear function. By interpolating at a point x, we want to find y , the value of function S at point x, assuming that x0 � x � xn . Hence, for a spline interpolation of degree one, we need to find an index 0 � j < n such that xj � x � xj+1 and approximate the value y by yj + xyjj ??yxjj++11 (x ? xj ). Step C is computationally intensive and involves both linear and nonlinear interpolations. We give next the details of step C for computing L0, a function of wavelength, location, and atmospheric parameters. Algorithm (Interpolate L0 ) Input: Wavelength, atmospheric correction parameters, location information and look-up tables. 1. Interpolate L0 for the measured height. 2. Interpolate L0 for the wavelength and adjust for the excess and deficit of gaseous and water absorption. 3. Interpolate L0 on measured solar zenith angle. 4. Interpolate L0 on measured observation azimuth angle. 5. Interpolate L0 on measured observation zenith angle. 6. Interpolate L0 on measured optical thickness. In step 1, linear interpolations and extrapolations are performed. The interpolations in step 2 are piecewise exponential interpolations 6
and those required by steps 3, 4, and 5 are spline interpolations of degree one. For piecewise exponential interpolation at a point x, xj � log( x x ) log yj +(1?�)log yj+1 ) ( � x < xj+1, y=e where, �= log( xj+j 1 ) . The interpolation xj +1
on measured optical thickness required by Step 6 is non-linear and consists of the following sub-steps. First we find the minimum of a non-linear function over a subinterval; a costly process given the complexity of the function to be minimized. Second, we perform a linear or a nonlinear interpolation depending on the outcome of the first sub-step.
3.2
Implementation
The direct atmospheric correction algorithm has been coded in Fortran [12] and tested on about 20 pixels. It uses eight look-up tables, one table for each of the 2 AVHRR bands of 0.639 and 0.845 �m and one for each of the 6 TM bands of 0.486, 0.587, 0.663, 0.837, 1.663 and 2.189 �m. Each table contains the values of L0 , Fd , T and s for nine solar zenith angles (10,20,30,40,50,60,66,72,and 78 degree), 13 observation zenith angles (0 to 78 degree, every 6 degree), 19 observation azimuth angles(0 to 180 degree, every 10 degree, plus 5 and 175 degrees), 4 aerosol optical thicknesses (0.0, 0.25, 0.50, and 1.0), and 3 observation heights (0.45, 4.5, and 80.0 kilometers). The code corrects single pixels of an image. The wavelength, solar and observation angles, and aerosol optical thickness data are assumed to be in the range discussed above as no extrapolation is performed. If any of the selected parameters does not match any of the values used to construct the look-up tables, the algorithm interpolates on that parameter. The computation for each pixel begins by reading the input data and look-up tables, followed by approximating the values of L0 , Fd , T and s by interpolations. Finally the surface reflectance of that pixel is computed using Eqn. (1). The resulting algorithm takes 2.63 seconds to correct a single pixel on a SPARC-10 system. Hence this code is not suitable for handling images as a single TM image that covers an area of size (180km � 180km) will take more than 15 years to correct all 5 bands. In the next section, we present our modified version of the algorithm which runs substantially faster and is quite efficient for handling images.
7
4 Optimizing Overall Computational Complexity We introduce a number of techniques that lead to a substantially more efficient version of the atmospheric correction algorithm. We group our new techniques into 5 major types described briefly next. Reordering and Classifying Operations. In the previous algorithm, all operations are repeated for each pixel. We rearrange the operations into three groups (1) image based, (2) window based, and (3) pixel based. The first group includes the operations that are independent of pixel values. For example, reading the look-up tables, the initializations and the interpolations based on the height of the sensor are image based operations. The corresponding operations can be performed for one pixel and used for all the remaining pixels. The second class of operations, window based, are reserved for those that depend on parameters which remain fairly constant over a window of size w � w for a suitable value of w. For example, the aerosol optical thickness remains fairly constant over a small neighborhood. Atmospheric conditions and the resolution of the image determine the value of w. Window based operations can be performed only once for each window if they are performed before any pixel based computation. The remaining computations and interpolations belong to the third group and depend on pixel values or some other parameters that are different for each pixel. We reorganized the operations of the atmospheric correction algorithm, so that the first group (image based) operations appear first followed by those of the second group (window based), and then by the third group operations. This has resulted in a substantial reduction of the total number of operations used. Performing Interpolations on Sub-cubes for Each Group. In the original algorithm, each interpolation causes one of the dimensions to be removed. Moreover, all the interpolations are piecewise interpolations. To reduce the number of operations, we first identify the appropriate indexes along all the dimensions for which interpolations are required within a certain class (image, window, or pixel). Then we extract the sub-cube, obtained from the intersection of those indexes. With this technique not only is the computational complexity reduced, but also the computational complexity becomes almost independent of the size of the look-up tables. Data Dependent Control. Another technique is to use the characteristics of different data inputs to reduce the overall computational complexity. For high resolution data most of the parameters are constant for the whole image while for coarse data most parameters 8
Data Type TM TM TM TM TM AVHRR AVHRR AVHRR AVHRR
Window Size 1�1 3�3 5�5 19 � 19 99 � 99 1�1 3�3 5�5 19 � 19
Time(�sec/pixel) 22:95 7:00 4:08 4:01 3:94 527:50 75:35 35:76 15:25
Table 1: Performance on a SPARC-10 machine. change from window (pixel) to window (pixel). On the other hand, the computational complexity per pixel is much more important for high resolution data than for coarse data due to the large difference in the amount of data involved. Changing Nonlinear Interpolations to Linear Interpolations. We have replaced some of the nonlinear interpolations by linear interpolations at the expense of increasing the sizes of the look-up tables. This technique decreases the number of computations because those nonlinear interpolations are window based operations and increasing the look-up table size mostly affects image based operations. For example, we replaced the nonlinear interpolations on measured optical thickness, which induce window based operations, with linear interpolations. Removing Unnecessary Interpolations. We replaced the interpolations with simpler operations whenever possible. For example, since we are only dealing with satellite images, we do not need to do the interpolation for the observation height since it can be assumed as constant. These techniques were quite effective in improving the performance while preserving the quality of the corrected imagery. Table 1 shows the performance of our atmospheric correction algorithm, for different window sizes and for different types of input data. The execution times do not include I/O time and are obtained on a SPARC-10 machine. Clearly, the new code is substantially faster than the code in [12] and can be used to correct all 5 bands of a TM image covering an area of size 180km � 180km with a window size of 19 � 19 in less than 13 minutes on a SPARC-10 machine (excluding I/O). It is interesting to notice that substantial speedups are achieved 9
PN
PN
PN
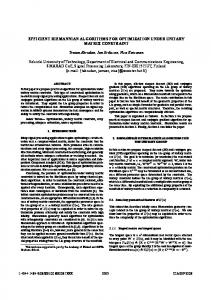
Interconnection Network
IOP
IOP
IOP
Figure 1: Processing nodes and I/O nodes are connected by an interconnection network. by increasing the window size up to a certain point. After that point (5 � 5 for TM), the speedups start to level off. Also, the TM data is corrected much faster than AVHRR data by our algorithm for the following reasons. First, most of the computations for TM are image based operations while in AVHRR they are mostly window based operations. Second, we can skip some of the interpolations for TM data, such as those for observation angles. It should be mentioned that the input for our code is raw data and does not need any preprocessing, while the input for the code [12] is formatted and needs another program to transform the raw data into the special formatted input.
5 Parallel Implementation Atmospheric correction of global data sets requires the extensive handling of large amounts of data residing in external storage, and hence the optimization of the I/O time must be considered in addition to the computation time. We seek to achieve an efficient layout of the input imagery on the disks and an efficient mapping of the computation across the processors in such a way the total computation and I/O time is minimized. We concentrate first on modeling the I/O performance; we then give a description of the parallel algorithm together with its overall theoretical performance followed by experimental results on a 32-node CM-5.
10
5.1
I/O Model
Our parallel model consists of a number p of computation nodes P0 , P1 , : : :, Pp?1 and a number d of I/O nodes, N0 , N1 , : : :, Nd?1 , connected by an interconnection network (Figure 1). For our purposes, we view each I/O node as holding a large disk (or a disk array). Data are transferred into and out of external storage in units of blocks, each block consisting of a number b of contiguous records. Each of the d disks can simultaneously transfer a block into the network. Therefore the theoretical total I/O bandwidth is d times the bandwidth provided by a single I/O node. The actual bandwidth depends on several factors including the interconnection network, the ratio of p and d, and the network I/O interface. Most current parallel systems use the technique of disk striping in which consecutive blocks are stored on different disks. For our case, an n � n image (say, in row-major order form) will be striped across the d disks in block units. When the image is accessed in parallel, we can adopt the single disk model with a very large bandwidth. In the single disk model, the time to transfer data is the sum of two components ta + Nd te, where ta is the access setup time, N the data size, and te the transfer time per element. Thus the I/O time depends essentially on the two parameters, ta and te . On a serial machine, the access setup time is mostly the seek time ts which is around 20msec but on parallel machines it is considerably larger, whereas the transfer time per element is substantially smaller (inverse of total bandwidth). In spite of the fact that ta and te vary from one application to another, they can be approximated reasonably well by constants. The I/O performance can be estimated by using the number np of passes through the data and the number na of disk accesses. In this case, the total data transfer time is given by (na � ta) + (np � N � te ). Since the access setup time is much larger than the transfer time, minimizing the number of disk accesses is usually much more important than minimizing the number of passes. For our implementation of the atmospheric correction algorithm to be discussed shortly, it is possible to minimize the I/O time by minimizing both parameters independently. For other problems (e.g., matrix transposition), it is possible to come up with algorithms that use more passes but requires less total I/O time by reducing the number of disk accesses [15].
5.2
Parallel Algorithm
We now sketch our parallel atmospheric correction algorithm and how it achieves its computation and I/O scalability. The algorithm 11
is designed in the Single Program Multiple Data (SPMD) model using the multiblock PARTI library. Therefore each processor runs the same code but on different parts of the image. The Multiblock PARTI library [16, 17] is a runtime support library for parallelizing application codes efficiently which provides a shared memory view on distributed memory machines. This makes our code portable to a large set of parallel machines since the library is available on the CM-5, the Intel iPSC/860 and Paragon, the IBM SP-1 and the PVM message passing environment for networks of workstations. A straightforward parallel implementation of the algorithm applied to each band of a N � N image5 requires only one pass through the image and can be done as follows. We read a block of maximum possible size, (say n � n) of the image that can fit in the internal memory with corresponding parameters for that part of the image. We apply our atmospheric correction procedure on the current block and write back the results. The procedure is repeated until the entire image is processed. This method requires n disk accesses per iteration, N 2 � C pN 2 disk accesses per band are required, and hence Cn MP MP where M is the memory size per processor and C is some constant. However we can modify the algorithm to minimize the number of disk accesses as follows. During each iteration, instead of reading a block, we read a slab consisting of the maximum possible number (say r) of consecutive rows of the image that can fit in the internal memory with corresponding parameters. We apply the atmospheric correction procedure on the slab and write back the results and repeat the procedure until the entire image is processed. Now we need only one disk access per iteration and hence the total number of disk N 2 which is clearly optimal. The new algoaccesses is reduced to C MP rithm still requires only one pass through the image and therefore the total transfer time is also optimal and is given by
ta + C te g TI=O � bN 2 fC1 Mp 2 d where b is the number of bands that we correct (b=5 for TM and b=2 for AVHRR), C1 is the cost of constant number of disk accesses per pass, and C2 is the number of bytes per pixel that we read or write. Given these relations, the I/O time can be controlled by changing the number of processors and the number of disk I/O nodes. In our algorithm, interprocessor communication is only introduced by the possibility of partitioning windows across processors. This r c � w � p. This can be can be eliminated by replacing r with r0 =b w:p 5
Here we have assumed that the numbers of columns and rows are equal for simplicity. The same type of analysis can be carried out in the more general case.
12
done only if at least w rows can fit in the internal memory of each processor, which is a realistic assumption for all reasonable values of w (i.e. � 500). The computation time can be estimated by
N 2 + C N 2 g; Tcomp � bfC3 + C4 pw 5 2 p where C3 , C4 and C5 are some machine dependent constants. In fact C3 is the required time for image based computations, C4 is the required time per window for window based operations and C5 is the required time per pixel for pixel based operations. These constants can be accurately estimated for a given machine. As an example, for TM data on CM-5, C3 � 26sec, C4 � 62�sec, and C5 � 18�sec. Note that C3 includes the I/O time for reading all the look-up tables. These numbers are valid for large data and agree with the observed experimental results. Summarizing , the total time is given by 2 2 N2 t + C N2 t g Ttotal � bfC3 + C4 wN2 p + C5 Np + C1 Mp a 2 d e
The above performance analysis indicate that our algorithm is scalable in terms of the parameters p, M , and d because for each term with N in the numerator we have p, M , or d in the denominator. Also, for a desired value of Ttotal, we can derive the number of processors and the number d of disk I/O nodes to achieve this. The results of running our code on a 32-node CM-5 are illustrated in Figure 2. The figure shows the total time in seconds for different image sizes, two window sizes and a different number of processors. We have used the least squares approximation to smooth the curves, but we have also included the real data for one of the cases (w=5 � 5 on 16 processors) to show the linearity of the experimental data. These experimental results are consistent with the analysis carried out in our model. From the graph, the running time scales properly with the image size and with the number of processors for different window sizes.
6 Case Study The application of our algorithm on a real TM imagery is presented in this section. Figure 3 shows a subset of TM image bands 1, 3, and 7 acquired on Aug. 17, 1989 in Amazon Basin area. As we can see, a 13
3000 W=1X1 (32P) 2500
TIME (sec)
2000 W=5X5 (16P) 1500
1000
W=5X5 (32P) 500
0 0
100
200
300
400 500 600 Image Size (M Pixel)
700
800
900
1000
Figure 2: Atmospheric correction performance of TM imagery on CM5, for different image sizes, two window sizes, and a different number of processors. large portion of the image in bands 1 and 3 in the middle is occupied by hazy aerosols and thin clouds but band 7 is less contaminated because it is in large wavelengths and scattering effect is negligible. In order to remove the aerosol contamination, the first step is to implement the so-called “dark-object” approach to estimate aerosol optical depth using band 7. We developed a preliminary program which estimates the aerosol optical depth for TM images and applied it to the mentioned image 6 . After having obtained aerosol optical depth for each channel, the surface reflectance is retrieved using the new atmospheric correction algorithm described in Section 5. The retrieved reflectance is shown in Figure 3. It is evident that most of hazy aerosols in channels 1 and 3 have been removed. Also it is interesting to see that the corrected channel 3 looks even more clear than channel 7. The retrieved surface reflectance underneath the hazy aerosols will be further evaluated with the knowledge of the ground truth.
7 Conclusion We have introduced a number of techniques to obtain a very efficient atmospheric correction algorithm based on the look-up table approach. As a result our algorithm can correct all 5 bands of a TM image, covering an area of size 180km � 180km, in less than 13 6
Details of this algorithm will be published after validation.
14
Band 1, Before Correction
Band 1, After Correction
Band 3, Before Correction
Band 3, After Correction
Band 7 Figure 3: TM imagery (512 � 512).
15
minutes on a SPARC-10 machine (excluding I/O). A parallel version of the algorithm that is scalable in terms of the number of processors, the number of I/O nodes, and the size of internal memory, was also described and analyzed. Experimental results on a 32-node CM-5 machine are provided. This work constitutes a part of a large multidisciplinary grand challenge project on applying high performance computing to land cover dynamics. Other aspects include parallel algorithms and systems for image processing and spatial data handling with emphasis on object oriented programming and parallel I/O of large scale images and maps.
References [1] C. O. Justice, J. R. G. Townshend, and V. T. Kalb, “Representation of vegetation by continental data set derived from NOAAAVHRR data”, International Journal of Remote Sensing, 1991, 12:999-1021. [2] J. R. G. Townshend, “Global datasets for land applications from the Advanced Very High Resolution Radiometer: an introduction”, International Journal of Remote Sensing, 1994, 15:33193332. [3] Y. J. Kaufman, “The atmospheric effect on remote sensing and its correction”, Chapter 9 in Optical Remote Sensing, technology and application, G. Asrar, Ed., Wiley, 1989. [4] R. S. Fraser and Y. J. Kaufman, “The relative importance of scattering and absorption in remote sensing”, IEEE Trans. Geosciences and Remote Sensing, 1985, 23:625-633. [5] R. S. Fraser, O. P. Bahethi, and A. H. Al-Abbas, “The effect of the atmosphere on classification of satellite observations to identify surface features”, Remote Sens. Environment, 1977, 6:229. [6] S. Chandrasekar, “Radiative Transfer”, London: Oxford University Press, 1960. [7] Y. J. Kaufman, A. Gitelson, A. Karnieli, E. Ganor, R. S. Fraser, T. Nakajima, S. Mattoo, and B. N. Holben, “Size distribution and scattering phase function of aerosol particles retrieved from sky brightness measurements”, JGR-Atmospheres, 1994, 99:10341-10356.
16
[8] J. Lenoble, “Radiative Transfer in Scattering and Absorbing Atmospheres: Standard Computational Procedures”, A. Deepak Publ., Hampton, Virginia, 1985. [9] S. Liang and A. H. Strahler, “Calculation of the angular radiance distribution for a coupled atmosphere and canopy”, IEEE Trans. Geosci. Remote Sens., 1993, 31:491-502. [10] W. E. Meador and W. R. Weaver, “Two-stream approximations to radiative transfer in planetary atmospheres: A unified description of existing methods and a new improvement”, J. Atmos. Sci., 1980, 37:630-643. [11] S. Liang and A. H. Strahler, “Four-stream solution for atmosphere radiative transfer over an non-Lambertian surface”, Appl. Opt., 1994, 33:5745-5753. [12] R. S. Fraser, R. A. Ferrare, Y. J. Kaufman, B. L. Markham, and S. Mattoo, “Algorithm for atmospheric corrections of aircraft and satellite imagery”, Intl. Journal of Remote sensing, 1992, 13:541-557. [13] J. R. G. Townshend, J. Cushnie, J. R. Hardy, and A. Wilson, “Thematic Mapper data: Characteristics and use”, 1983. [14] J. R. G. Townshend, M. E. James, S. Liang, and S. Goward, “A long term data set for global terrestrial observations: Report of the AVHRR Pathfinder Land Science Working Group”, NASATM, in press, 1995. [15] S. D.Kaushik, C.-H. Huang, J. R. Johnson, R. W. Johnson, P. Sadayappan, “Efficient Transposition algorithms for large Matrices”, ACM, 1993. [16] G. Agrawal, A. Sussman, and J. Saltz, “Compiler and runtime support for structured and block structured applications”, In Proceedings Supercomputing ’93, IEEE Computer Society Press, November 1993. [17] A. Sussman and J. Saltz, “A manual for the multiblock PARTI runtime primitives version 4”, Technical Report CS-TR-3070 and UMIACS-TR-93-36, University of Maryland, May 1993.
17