At the web site of the Na- .... The algorithm maintains a single best-so-far solution, which is the only ..... ing on a dedicated web server for online-only computa-.
Efficient algorithms for extracting biological key pathways with global constraints Jan Baumbach
Tobias Friedrich
Timo Kötzing
Max Planck Institute for Informatics Saarbrücken, Germany
Max Planck Institute for Informatics Saarbrücken, Germany
Max Planck Institute for Informatics Saarbrücken, Germany
Anton Krohmer
Joachim Müller
Josch Pauling
Saarland University Saarbrücken, Germany
Max Planck Institute for Informatics Saarbrücken, Germany
Max Planck Institute for Informatics Saarbrücken, Germany
ABSTRACT
Keywords
The integrated analysis of data of different types and with various interdependencies is one of the major challenges in computational biology. Recently, we developed KeyPathwayMiner, a method that combines biological networks modeled as graphs with disease-specific genetic expression data gained from a set of cases (patients, cell lines, tissues, etc.). We aimed for finding all maximal connected sub-graphs where all nodes but K are expressed in all cases but at most L, i.e. key pathways. Thereby, we combined biological networks with OMICS data, instead of analyzing these data sets in isolation. Here we present an alternative approach that avoids a certain bias towards hub nodes: We now aim for extracting all maximal connected sub-networks where all but at most K nodes are expressed in all cases but in total (!) at most L, i.e. accumulated over all cases and all nodes in a solution. We call this strategy GLONE (global node exceptions); the previous problem we call INES (individual node exceptions). Since finding GLONE-components is computationally hard, we developed an Ant Colony Optimization algorithm and implemented it with the KeyPathwayMiner Cytoscape framework as an alternative to the INES algorithms. KeyPathwayMiner 3.0 now offers both the INES and the GLONE algorithms. It is available as plugin from Cytoscape and online at http://keypathwayminer.mpi-inf.mpg.de.
Ant Colony Optimization, Systems Biology, Gene Expression, Epigenetics
1.
INTRODUCTION
Since the introduction of the so-called next generation sequencing technology it appears that we have finally arrived in the post-genome era. At the web site of the National Center for Biotechnology Information we find registered sequencing projects for 1520 eukaryotes, 8604 prokaryotes and 2987 viruses [21]. However, we still lack fundamental knowledge about crucial genetic programs, the interplay of genes and their products (the proteins) and their biochemical regulations and fine-tuning. We know very little about how cells, organs and tissues regulate survival, reproduction, movement, etc. in response to changing environmental conditions [20, 7]. The most important control mechanisms are transcriptional gene regulations and protein-protein interactions [8, 17]. They are typically modeled as graphs, where nodes correspond to genes/proteins and edges to biological interactions between them [9, 10]. In this regard, we may study statistical network properties [13], discuss node degree distributions [5], investigate network centrality node lists [4], or identify protein complexes [26], to name a few possibilities. On the other hand, we use so-called OMICS technologies for measuring the activity of biological entities within living cells under different conditions (stimuli, diseases, infections, etc.). The most prominent examples for such technologies are microarrays or RNA-seq (transcriptomics), genome-wide promoter/gene methylation assays (epigenetics), mass spectrometry (proteomics), and ion mobility spectrometry (metabolomics). A typical example for high-throughput OMICS data analysis (with relation to this paper) is cancer sub-typing based on the identification of genome-wide gene expression similarities [24, 25], to give only one of many possible examples. Recent advances in large-scale systems biology wet lab machinery provided us with huge amounts of both network data and OMICS data. In the Gene Expression Omnibus (GEO), the standard repository for microarray, RNA-seq and methylation profiling data, we have 680,000 samples measured at almost 10,000 platforms available for public download [12]. The most impressive number on the network side comes from the PSICQUIC platform, a SOAP-
Categories and Subject Descriptors J.3 [Life and Medical Sciences]: Biology and genetics
General Terms Algorithms, Experimentation
Permission to make digital or hard copies of all or part of this work for personal or classroom use is granted without fee provided that copies are not made or distributed for profit or commercial advantage and that copies bear this notice and the full citation on the first page. To copy otherwise, to republish, to post on servers or to redistribute to lists, requires prior specific permission and/or a fee. GECCO’12, July 7-11, 2012, Philadelphia, Pennsylvania, USA. Copyright 2012 ACM 978-1-4503-1177-9/12/07 ...$10.00.
1
based online querying interface and meta-database that covers 16 interactome databases and provides access to 16 million protein-protein interactions of various evidence levels and for several species [3]. Although the integrated analysis of data from different types and with various interdependencies is one of the major challenges in computational biology, both kinds of data types, the rather static network data as well as the quite dynamic, case-specific OMICS data are usually studied in isolation. Therefore, we recently developed KeyPathwayMiner [2, 1], a method that combines biological networks modeled as graphs with disease-specific genetic expression data gained from a set of cases (patients, cell lines, tissues, etc.). Our approach aims to find all maximal connected subgraphs, w.r.t. the number of nodes, where all nodes but K are expressed in all cases but at most L. We refer to these maximal connected components as key pathways. First, we checked, for each node individually, whether the L-condition was fulfilled (expressed in all cases but L). If not, we marked the corresponding nodes as exception nodes, of which we allow at most K in a valid solution. We call this strategy INES (individual node exceptions). Using INES means, however, that we tend to prefer nodes with high degrees (hub nodes) as exception nodes, since they are more likely to maximize the sub-graph by connecting it with others. Depending on the underlying real world question, this bias may or may not be desired. Here we present an alternative approach that tackles this problem by slightly varying the optimization problem: Now we aim to extract all maximal connected sub-networks where all but at most K nodes are expressed in all cases but in total (!) at most L, i.e. accumulated over all cases and all nodes in a solution. In other words, a solution is valid when it is maximal w.r.t. the number of nodes and for all nodes but K we have at most L nonexpressed cases. We call this strategy GLONE (global node exceptions). Since finding such GLONE-components is NP-hard, we developed an Ant Colony Optimization algorithm and implemented it with the KeyPathwayMiner Cytoscape framework as an alternative to the INES algorithms. We demonstrate the power of GLONE by utilizing the same data sets that were used for evaluating the INES algorithms of the previous KeyPathwayMiner release [1] as well as related computational tools [23, 14, 2, 11]: the human protein-protein interaction network together with gene expression data of Huntington’s disease patients.
Algorithm 1: Max-Min Ant System
8
Input: G = (V, E); f ; L; K; initialize all pheromones to 1/2 ; foreach v in the start node list do let S ∗ = {V }; while some improvement recently do construct a solution S according to Algorithm 2; apply local search to S; if |S ∗ | < |S| then S ∗ = S
9
return best solution found ;
1 2 3 4 5 6 7
In [16] an ACO algorithm framework for finding solutions to subset problems was given. To find GLONE-components, we follow the general ideas inherent in this framework (as we are looking for a subset of nodes), but in pheromone update rules, follow an approach according to a Max-Min Ant System [22]. In what follows, we give a detailed description of our algorithm; an overview is given in Algorithm 1. A list of all parameters to the algorithm, as well as the default values used for testing, can be found in Table 1. Experimentation showed that the default parameter values result in good solutions; careful adjustments of the values can lead to much faster termination, but possibly at the cost of a somewhat lower quality of the solutions (see also Figure 1). Parameter
Value
ALPHA (Pheromone intensity)
2.0
BETA (Edge desirability importance)
5.0
RHO (Pheromone decay rate)
0.1
MAX RUNS WITHOUT CHANGE (Max. iterations without change)
100
NUM STARTNODES (Number of starting nodes)
100
TAU MIN (Minimum node pheromone value)
0.1
Table 1: Parameter specification (default values).
2.
DESCRIPTION OF ALGORITHMS The algorithm maintains a single best-so-far solution, which is the only solution used to update the pheromones. Pheromones are deposited on the nodes of the input graph. The algorithm makes a number of independent runs with different start nodes (the number is specified by a parameter of the algorithm). In each iteration, each ant grows a connected subgraph of the input graph beginning at the current start node until no node can be added without exceeding the limit in cumulative L-value (ignoring the K most costly nodes). After this, a local search is applied: We try all nodes u from the subgraph of the ant such that removing this node will not make the subgraph disconnected; we now remove u and add neighboring nodes in a greedy fashion until no nodes can be added without violating the constraint imposed by the K and L values. The number of ants per iteration is a parameter of the algorithm.
The formal model for the problem is as follows. Given an undirected graph G = (V, E) and a node labeling function f : V → N, as well as parameters L and K, find a set of nodes S ⊆ V of maximal cardinality such that • S in G is connected; • the sum over f (v) for all v ∈ S, except the K nodes with highest f (v), is at most L. We call such a set S a GLONE-component. This problem is NP-hard (see [23] for a discussion). Intuitively, the nodes of the graph correspond to genes/proteins and the edges to biological interactions between them. For each node v, f (v) corresponds, for example, to the number of not differentially expressed cases. 2
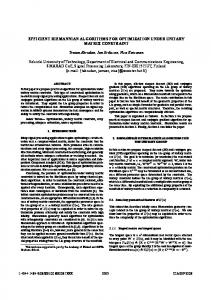
graph, we let N (S) = {u | u 6∈ S ∧∃v ∈ S s.t. {u, v} ∈ E} be the set of all nodes in the graph which have a neighbor in S. For a connected set S, a node u ∈ N (S) can be added to S, if S ∪ {u} is a feasible solution. We call such nodes feasible neighbors, and denote the set of all feasible neighbors by FN (S). We observed that after a few hundred iterations our ACO algorithm always outperforms the greedy solution. Figure 1 shows an experimental comparison for L = 400 and K = 2 on the Ulitskty et al. data set [23]. The size of the solution of the greedy algorithm is the blue line. The quality of the best-so-far solution after each iteration and the respective standard deviations for 100 runs is shown in red. Note that the horizontal axis is scaled logarithmically. For this parameter setting, the best-so-far solution of our ACO algorithm is better than the solution of the greedy algorithm after 160 iterations on average. The behavior is similar for other parameter combinations. However, the greedy approach is significantly faster than the ACO.
Size of best solution
64
62
60
58
101
102
103
104
Iteration
Figure 1: Comparison of the greedy algorithm (blue line) and our ACO algorithm (red chart with standard deviations).
3.
EXPERIMENTS
In this chapter we elucidate the GLONE algorithm’s characteristics and performance. We first compare the results to our previous algorithm INES (KPM 2.0 ACO) [1]. Subsequently, we present a comparison regarding identified known relevant genes to other software approaches. In the closing section we provide an analysis showing the running times and behavior of the GLONE algorithm in relation to varying parameter specifications.
Let a node v be given. The amount of pheromone on v is denoted by τ (v); we also associate a heuristic value with v, denoted by η(v), equal to 1/f (v). This heuristic value is fixed during a run of the algorithm and is aimed at directing the algorithm to promising areas (low f -value). We make a multiplicative trade-off between pheromone value and heuristic value and choose node v proportional to τ (v)α · η(v)β .
3.1
Both α and β are parameters of the algorithm. Note that only nodes connected to the component constructed so far are considered. All pheromones values are kept between the pheromone borders τmin and τmax = 1 − τmin and initialized to 0.5, following the scheme of a Max-Min Ant System. When updating with the best-so-far solution S, the pheromone τ is updated according to the following rule. For all nodes v, ( min((1 − ρ)τ (v) + ρ, τmax ), if v ∈ S; τnew (v) = max((1 − ρ)τ (v), τmin ), otherwise.
For evaluation purposes we use a human PPI network containing 7,384 nodes and 23,462 interactions extracted and compiled from several interaction databases. For the extraction of disorder-specific key pathways, we used gene expression data taken from the Gene Expression Omnibus (GEO) which was obtained using oligonucleotide arrays [6]. This data set consists of 38 affected samples taken from the caudate nucleus region of the brain. Since there is no commonly accepted gold standard data, we used the same data that was used by Ulitsky et al. [23]. To ensure comparability, we also used the same thresholds and p-values to determine differential gene expressions in our pre-processing. Note that generating an artificial gold standard is not feasible. We would be able to see that our algorithms solve the combinatorial optimization problem but not if the optimization model itself is appropriate. Hence, we work with real world data instead.
The algorithm stops the run for the current start node when there were no improvements in a fixed number of iterations (a parameter to the algorithm). The list of start nodes is deterministically created by choosing the nodes with the smallest average f -value of their neighborhood. Other heuristics are possible here, this one has shown a good performance in experiments.
3.2 Algorithm 2: Component Construction from v
6
Input: start vertex v; S = {v}; while FN (S) P 6= ∅ do let R = u∈FN (S) τ (u)α · η(u)β ; choose u ∈ FN (S) with probability τ (u)α · η(u)β /R; S = S ∪ {u};
7
return S;
1 2 3 4 5
Data
Evaluation
We tested the applicability of GLONE by comparing the found relevant genes to the following sources of already known and published HD-relevant genes: • KEGG HD Pathway: The KEGG HD Pathway is part of the KEGG Pathway database [18] which consists of most of the known metabolic pathways and some of the known regulatory pathways. • Calcium Signaling Pathway: This pathway is related to the KEGG HD Pathway and is also available at the KEGG Pathway database. It plays an important role in the development of HD.
The construction of a solution is an iterative procedure detailed in Algorithm 2. For any set S of nodes of the input 3
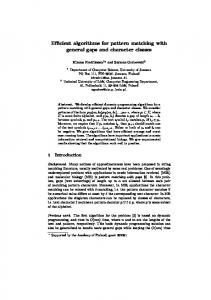
Figure 2: Merged networks from both GLONE and INES. • HD Modifiers: These genes have been reported in the work of Kaltenbach and Romero [15] as important modifier genes playing key roles in the development of HD.
While INES could only use nodes that did not exceed the L parameter, GLONE is able to include more expensive nodes to maximize the sub-graph as long as the overall cost threshold (the new L) for the network is not exceeded. We evaluated the results of the GLONE algorithm and compared them to our previous approach INES implemented by the KPM 2.0 ACO algorithm and published under [1]. We visualized both the GLONE and the INES solution networks in Figure 2. The figure depicts the GLONE network (blue nodes), the INES network (green nodes) and their overlap (red nodes). The GLONE network consists of 38 nodes, compared to 37 nodes in the INES network, although the construction of both networks involved the same overall costs. It is noteworthy that GLONE selects fairly distributed nodes with lesser degrees as exception nodes, while the INES algorithm tends to have a bias towards picking hub-nodes in order to maximize the sub-graph. Depending on the data and local characteristics within the human PPI network this bias may or may not be desired. By comparing the genes contained in the reported pathway solution to all combined known relevant genes (KEGG HD Pathway, Calcium Signaling Pathway, HD Modifiers), GLONE outperforms INES by two genes in the KEGG HD Pathway and in the Calcium Signaling Pathway (Gene Symbols: GNAQ, PLCB1), please refer also to Table 2. However, with INES we found one gene in the HD modifiers that was not identified using GLONE (Gene Symbol: CTNNB1). Furthermore, even though INES included the Huntingtin
Since the GLONE approach requires a slight reformulation of the optimization problem, the L parameter now shows significantly higher values when compared to previous INES parameterization. We determined the overall network cost induced by our former INES approach (KPM 2.0 ACO) by accumulating all case exceptions over all nodes contained in the INES solution to determine new values for L. However, exception nodes were excluded. This strategy assures that both algorithms’ computations are based on the same preconditioning, resulting in very similar and comparable solution networks that differ from each other only due to corresponding algorithmic characteristics. Therefore, we set L=164 with K=2 which resembles the (now deprecated) INES parameter specification of L=8 and K=2 for the previously described HD gene expression data. We left the remaining parameters at their default values (Table 1). Since ant colony optimization is non-deterministic (random seeding), we report the worst as well as the best solution found. However, when comparing GLONE to INES we show the best solutions for both. Please note that all test runs resulted in finding key pathways of very similar sizes, varying by one node. This is an indicator for the algorithm’s robustness and reliability.
3.2.1
GLONE versus INES 4
INES
GLONE (worst)
GLONE (best)
CUSP
GiGA
jActiveModules
t-test top
Number of genes
37
37
38
34
34
282
34
Contains HTT ?
Yes
Yes
Yes
Yes
No
No
No
HD modifiers
8
6
7
7
3
12
2
KEGG HD pathway
8
8
10
4
0
4
0
Calcium pathway
5
5
7
6
5
10
3
Table 2: Table comparing the largest affected pathways found for K = 2 and L = 8 by the ACO 2.0, the worst and best results from the ACO 3.0 and other pathway extraction methods such as CUSP [23], GiGA [11], jActiveModules [14] and the top 34 active genes with the most significant t-scores. gene (Gene Symbol: HTT) in the network, it was an exception node. Using GLONE the Huntingtin gene is added to the pathway as a regular node in the process.
3.2.2
approach having the greatest differences with respect to the KEGG HD Pathway. To summarize the comparisons’ results, GLONE is able to find the most significant key pathway regarding the number of identified known relevant genes from the three control datasets with respect to the size of the key pathway.
Comparing GLONE with other approaches
We also evaluated the GLONE algorithm by comparing its performance to four additional software approaches respectively: CUSP, GiGA, jActiveModules, and t-test top. Table 2 shows the evaluation results. We used equal parameterization for each evaluation step regarding the allowed number of case exceptions K and the cost threshold for gene exceptions L. The GLONE algorithm found the highest overall amount of known HD-relevant genes, except for the jActiveModules, which finds a very large pathway. Apparently, the larger the pathway the higher the probability that it also contains one or many of the known relevant genes. However, large networks contain a lot of noise and thus are far from representing a key pathway. To address this, we use a metric (overlap) that accounts for the number of genes in relation to the network size. This is important since it is a measure for the key pathway’s significance. Figure 3 showcases this
3.2.3
GLONE Running Times
All running time analyses were executed on an ordinary personal computer. Table 3 shows detailed hardware specifications. We varied the parameters K and L in a common value spectrum. Note that these values are always data specific and it could in some cases be desirable to use significantly smaller or higher values. Figure 4 shows these results. Running Times 600
l = 250
Runtime in seconds
l = 150 l = 50
400
200
0
0
2
4 6 8 Allowed Gene Exceptions K
10
Figure 4: GLONE running time behavior for varying K and L using the HD data sets Figure 3: Bar diagram showing the % overlap of the reported found key pathway of each approach with each of the three control sets of known HD-relevant genes
When the solution space is extended by increasing both K and L, each iteration is more complex, as more nodes become available. However, while this increases the computation time to find the best solution it is noticeable that the margin of deviation is also increased. For a fixed L value, the amount of iterations and the computational cost per iteration can vary between different values of K in such a way that, to a limited extend, the algorithm may converge faster towards the best solution even for higher values of K or more slowly for lower values, thus, increasing the margin of deviation. This is due to both changing random seeds
relationship. We illustrate the overlap of each key pathway with the three control data sets of known relevant genes. Compared to the HD modifiers and the Calcium Signaling Pathway, the GLONE pathway reaches an 18% overlap and a 27% overlap with the KEGG HD Pathway. With CUSP having a slightly larger overlap with the HD modifiers control dataset, the GLONE algorithm outperforms any other 5
6.
determining different starting conditions for the ACO and corresponding local characteristics of the PPI network. Model:
Dell Latitude E6510
CPU:
Intel Core i5 CPU M540 @2.53GHz
RAM:
3.24GB
Operating System:
Windows XP Prof. 2002 SP 3
[1] N. Alcaraz, T. Friedrich, T. K¨ otzing, A. Krohmer, J. Mueller, J. Pauling, and J. Baumbach. Efficient key pathway mining - Combining networks and OMICS data. Integr Biol, in press, 2012. [2] N. Alcaraz, H. Kucuk, J. Weile, A. Wipat, and J. Baumbach. KeyPathwayMiner - Detecting case-specific biological pathways by using expression data. Internet Mathematics, 7(4):299–313, 2011. [3] B. Aranda, H. Blankenburg, S. Kerrien, F. S. L. Brinkman, A. Ceol, E. Chautard, J. M. Dana, J. De Las Rivas, M. Dumousseau, E. Galeota, A. Gaulton, J. Goll, R. E. W. Hancock, R. Isserlin, R. C. Jimenez, J. Kerssemakers, J. Khadake, D. J. Lynn, M. Michaut, G. O’Kelly, K. Ono, S. Orchard, C. Prieto, S. Razick, O. Rigina, L. Salwinski, M. Simonovic, S. Velankar, A. Winter, G. Wu, G. D. Bader, G. Cesareni, I. M. Donaldson, D. Eisenberg, G. J. Kleywegt, J. Overington, S. Ricard-Blum, M. Tyers, M. Albrecht, and H. Hermjakob. PSICQUIC and PSISCORE: accessing and scoring molecular interactions. Nat Methods, 8(7):528–9, Jul 2011. [4] Y. Assenov, F. Ram´ırez, S.-E. Schelhorn, T. Lengauer, and M. Albrecht. Computing topological parameters of biological networks. Bioinformatics, 24(2):282–4, Jan 2008. [5] S. Balaji, L. M. Iyer, L. Aravind, and M. M. Babu. Uncovering a hidden distributed architecture behind scale-free transcriptional regulatory networks. J Mol Biol, 360(1):204–12, Jun 2006. [6] T. Barrett, D. B. Troup, S. E. Wilhite, P. Ledoux, C. Evangelista, I. F. Kim, M. Tomashevsky, K. A. Marshall, K. H. Phillippy, P. M. Sherman, R. N. Muertter, M. Holko, O. Ayanbule, A. Yefanov, and A. Soboleva. NCBI GEO: archive for functional genomics data sets–10 years on. Nucleic Acids Res, 39(Database issue):D1005–D1010, Jan 2011. [7] J. Baumbach. On the power and limits of evolutionary conservation–unraveling bacterial gene regulatory networks. Nucleic Acids Res, Aug 2010. [8] J. Baumbach, K. Brinkrolf, T. Wittkop, A. Tauch, and S. Rahmann. CoryneRegNet 2: an integrative bioinformatics approach for reconstruction and comparison of transcriptional regulatory networks in prokaryotes. Journal of Integrative Bioinformatics, 3(2):24, 2006. [9] J. Baumbach, A. Tauch, and S. Rahmann. Towards the integrated analysis, visualization and reconstruction of microbial gene regulatory networks. Briefing in Bioinformatics, 10(1):75–83, Jan 2009. [10] J. Baumbach, T. Wittkop, C. K. Kleindt, and A. Tauch. Integrated analysis and reconstruction of microbial transcriptional gene regulatory networks using CoryneRegNet. Nat Protoc, 4(6):992–1005, 2009. [11] R. Breitling, A. Amtmann, and P. Herzyk. Graph-based iterative group analysis enhances microarray interpretation. BMC Bioinformatics, 5(1):100+, jul 2004. [12] R. Edgar, M. Domrachev, and A. E. Lash. Gene expression omnibus: NCBI gene expression and hybridization array data repository. Nucleic Acids Res, 30(1):207–10, Jan 2002.
Table 3: System specifications
4.
CONCLUSIONS
In this paper we presented KeyPathwayMiner 3.0, a set of algorithms tackling the computational problem of finding maximal sub-networks where all nodes but K are active in all studied cases but L. Here, we complement the INES (individual node exceptions) approach from the previous KeyPathwayMiner release by addressing a potential bias regarding hub nodes with our GLONE (global node exceptions) approach. Now we aim to extract all maximal connected sub-networks where all but at most K nodes are active in all cases but in total (!) at most L, i.e., accumulated over all cases and all nodes in a solution. Since finding such solutions is computationally intensive we implemented and described a sophisticated ACO algorithm, which we compared to the KeyPathwayMiner release 2.0 as well as to similar software solutions. For our comparison, we used data sets previously utilized for the CUSP algorithm where our method performs as well as or better than the other methods. In summary, our main contribution in comparison to release 2.0 is an alternative method for avoiding a potential bias towards hub/exception nodes. Regarding other methods, our main contribution is a method that requires minimal user input of two intuitive parameters that control the noise that we wish to allow in the network data (K) as well as the expression data (L). No prior knowledge regarding these two parameters is necessary. Besides methodological considerations, our implementation has some benefits over other approaches: KeyPathwayMiner 3.0 comes as an easyto-use, easy-to-install Cytoscape plug-in, and its parallel implementation allows for speedups on multi-core computers. In the future we plan to extend our approach to directed networks, such as metabolic networks and gene regulatory networks. Furthermore, we aim to integrate the method into CoryneRegNet [19, 9]. We are also working on a dedicated web server for online-only computations as well as a SOAP-based web service provider. Algorithmically, we will evaluate if a hybrid approach of using the results of our greedy strategy as seeding for the ACO algorithm will improve convergence (lower compute time) without running into local optima (similar accuracy).
5.
REFERENCES
ACKNOWLEDGMENT
JB, TF, TK, JM, and JP are grateful for financial support from the Cluster of Excellence for Multimodal Computing and Interaction (MMCI), Germany. TF and TK received support from the German Research Foundation (DFG, grant NE 1182/5-1). 6
[13] M. L. Hartsperger, R. Strache, and V. St¨ umpflen. HiNO: an approach for inferring hierarchical organization from regulatory networks. PLoS One, 5(11):e13698, 2010. [14] T. Ideker, O. Ozier, B. Schwikowski, and A. F. Siegel. Discovering regulatory and signalling circuits in molecular interaction networks. Bioinformatics, 18 Suppl 1:S233–40, 2002. [15] L. Kaltenbach and E. Romero. Huntingtin interacting proteins are genetic modifiers of neurodegeneration. PLoS Genet, 2007. [16] G. Leguizamon, Z. Michalewicz, and M. Schutz. An ant system for the maximum independent set problem. In Proceedings of the 2001 Argentinian Congress on Computer Science, pages 1027–1040, 2001. [17] H. Neuweger, J. Baumbach, S. Albaum, T. Bekel, M. Dondrup, A. T. H¨ user, J. Kalinowski, S. Oehm, A. P¨ uhler, S. Rahmann, J. Weile, and A. Goesmann. CoryneCenter - an online resource for the integrated analysis of corynebacterial genome and transcriptome data. BMC Syst Biol, 1:55, 2007. [18] H. Ogata, S. Goto, K. Sato, W. Fujibuchi, H. Bono, and M. Kanehisa. KEGG: Kyoto encyclopedia of genes and genomes. Nucleic Acids Res, 27(1):29–34, Jan 1999. [19] J. Pauling, R. R¨ ottger, A. Tauch, V. Azevedo, and J. Baumbach. Coryneregnet 6.0–updated database content, new analysis methods and novel features focusing on community demands. Nucleic Acids Res, 40(1):D610–4, Jan 2012. [20] R. R¨ ottger, U. R¨ uckert, J. Taubert, and J. Baumbach. Towards the size of gene regulatory networks – how little do we actually know? IEEE/ACM Transactions on Computational Biology and Bioinformatics, in press, 2012. [21] E. W. Sayers, T. Barrett, D. A. Benson, E. Bolton, S. H. Bryant, K. Canese, V. Chetvernin, D. M. Church, M. DiCuccio, S. Federhen, M. Feolo, I. M. Fingerman, L. Y. Geer, W. Helmberg, Y. Kapustin, D. Landsman, D. J. Lipman, Z. Lu, T. L. Madden, T. Madej, D. R. Maglott, A. Marchler-Bauer, V. Miller, I. Mizrachi, J. Ostell, A. Panchenko, L. Phan, K. D. Pruitt, G. D. Schuler, E. Sequeira, S. T. Sherry, M. Shumway, K. Sirotkin, D. Slotta, A. Souvorov, G. Starchenko, T. A. Tatusova, L. Wagner, Y. Wang, W. J. Wilbur, E. Yaschenko, and J. Ye. Database resources of the National Center for Biotechnology Information. Nucleic Acids Res, 39(Database issue):D38–51, Jan 2011. [22] T. St¨ utzle and H. H. Hoos. Max-min ant system. Future Generation Comp. Syst., 16(8):889–914, 2000. [23] I. Ulitsky, R. Karp, and R. Shamir. Detecting disease-specific disregulated pathways via analysis of clinical expression profiles. Proceedings of RECOMB, Research in Computational Molecular Biology, 4955:347–359, 2008. [24] T. Wittkop, D. Emig, S. Lange, S. Rahmann, M. Albrecht, J. H. Morris, S. B¨ ocker, J. Stoye, and J. Baumbach. Partitioning biological data with transitivity clustering. Nat Methods, 7(6):419–20, Jun 2010. [25] T. Wittkop, D. Emig, A. Truss, M. Albrecht,
S. B¨ ocker, and J. Baumbach. Comprehensive cluster analysis with transitivity clustering. Nat Protoc, 6(3):285–95, Mar 2011. [26] T. Wittkop, S. Rahmann, R. R¨ ottger, S. B¨ ocker, and J. Baumbach. Extension and robustness of transitivity clustering for protein-protein interaction network analysis. Internet Mathematics, 7(4):255–273, 2011.
7