Nov 7, 2004 - We measure two kinds of redundancy in probing (intra- and inter-monitor) .... plications, must work hard to avoid sampling router interfaces and ...
Efficient Algorithms for Large-Scale Topology Discovery Benoit Donnet, Philippe Raoult, Timur Friedman, Mark Crovella∗
arXiv:cs/0411013v1 [cs.NI] 7 Nov 2004
Abstract
Introduction Systems for active measurements in the internet are undergoing a radical shift. Whereas the present generation of systems operates on largely dedicated hosts, numbering between 20 and 200, a new generation of easily downloadable measurement software means that infrastructures based on thousands of hosts could spring up literally overnight. Unless carefully controlled, these new systems have the potential to impose a heavy load on parts of the network that are being measured. They also have the potential to raise alarms, as their traffic can easily resemble a distributed denial of service (DDoS) attack. This paper examines the problem, and proposes and evaluates an algorithm for controlling one of the most common forms of active measurement: traceroute [1]. There are a number of systems active today that aim to elicit the internet topology at the IP interface level. The most extensive tracing system, Caida’s skitter [2], uses 24 monitors, each targeting on the order of one million destinations. Some other well known systems, such as the Ripe NCC’s TTM service [3] and the NLanr AMP [4], have larger numbers of monitors (between one- and two-hundred), and conduct traces in a full mesh, but avoid tracing to outside destinations. The uses of the raw data from these traces are numerous. From a scientific point of view, the results underlie efforts to model the network [5, 6, 7, 8, 9, 10]. From an engineering standpoint, the results inform a wide variety of protocol development choices, such as multicast and overlay construction [11]. However, recent studies have shown that reliance upon a relatively small number of monitors can introduce unwanted biases. For instance, work by Faloutsos et al. [7] found that the distribution of router degrees follows a power law. That work was based upon an internet topology collected from just twelve traceroute hosts by Pansiot and Grad [12]. However, Lakhina et al. [13] showed that, in simulations of a network in which the degree distribution does not at all follow a power law, traceroutes conducted from a
There is a growing interest in discovery of internet topology at the interface level. A new generation of highly distributed measurement systems is currently being deployed. Unfortunately, the research community has not examined the problem of how to perform such measurements efficiently and in a networkfriendly manner. In this paper we make two contributions toward that end. First, we show that standard topology discovery methods (e.g., skitter) are quite inefficient, repeatedly probing the same interfaces. This is a concern, because when scaled up, such methods will generate so much traffic that they will begin to resemble DDoS attacks. We measure two kinds of redundancy in probing (intra- and inter-monitor) and show that both kinds are important. We show that straightforward approaches to addressing these two kinds of redundancy must take opposite tacks, and are thus fundamentally in conflict. Our second contribution is to propose and evaluate Doubletree, an algorithm that reduces both types of redundancy simultaneously on routers and end systems. The key ideas are to exploit the tree-like structure of routes to and from a single point in order to guide when to stop probing, and to probe each path by starting near its midpoint. Our results show that Doubletree can reduce both types of measurement load on the network dramatically, while permitting discovery of nearly the same set of nodes and links. We then show how to enable efficient communication between monitors through the use of Bloom filters.
∗ Mr. Donnet, Mr. Raoult, and Mr. Friedman are with the Laboratoire LiP6-CNRS of the Universit´ e Pierre et Marie Curie, Paris. Mr. Crovella is with the Computer Science Department, Boston University. The authors are participants in the traceroute@home project. This work was supported by: the RNRT project Metropolis, NSF grants ANI-9986397 and CCR-0325701, a SATIN European Doctoral Research Foundation grant, the e-Next European Network of Excellence, and LiP6 2004 project funds. This work was performed while Mr. Crovella was at LiP6, with support from the CNRS and Sprint Labs.
1
small number of monitors can tend to induce a subgraph in which the node degree distribution does follow a power law. Clauset and Moore [14] have since demonstrated analytically that such a phenomenon is to be expected for the specific case of the Erd¨ os-R´enyi random graphs [15]. Removing potential bias is not the only reason to employ measurement systems that use a larger number of monitors. With more monitors to probe the same space, each one can take a smaller portion and probe it more frequently. Network dynamics that might be missed by smaller systems can more readily be captured by the larger ones. The idea of releasing easily deployable measurement software is not new. To the best of our knowledge, the idea of incorporating a traceroute monitor into a screen saver was first discussed in a paper by Cheswick et al. [16] from the year 2000 (they attribute the suggestion to J¨org Nonnenmacher). Since that time, a number of measurement tools have been released to the public in the form of screen savers or daemons. Grenouille [17], which is used for measuring available bandwidth in DSL connections, was perhaps the first, and appears to be the most widely adopted. More recently, we have seen the introduction of NETI@home [18], a passive measurement tool inspired by the distributed signal analysis tool, SETI@home [19]. In the summer of 2004, the first tracerouting tool was made available: DIMES [20] conducts traceroutes and pings from, at the time of this writing, 323 sites in 43 countries. Given that much large scale network mapping is on the way, contemplating such a measurement system demands attention to efficiency, in order to avoid generating undesirable network load. Unfortunately, this issue has not been yet successfully tackled by the research community. As Cheswick, Burch and Branigan note, such a system “would have to be engineered very carefully to avoid abuse” [16, Sec. 7]. Traceroutes emanating from a large number of monitors and converging on selected targets can easily appear to be a DDoS attack. Whether or not it triggers alarms, it clearly is not desirable for a measurement system to consume undue network resources. A traceroute@home system, as we label this class of applications, must work hard to avoid sampling router interfaces and traversing links multiple times, and to avoid multiple pings of end systems. This lack of consideration on efficiency is in contrast to the number of papers on efficient monitoring of networks that are in a single administrative domain
(see for instance, Bejerano and Rastogi’s work [21]). However, both problems are completely different. An administrator knows their entire network topology in advance, and can freely choose where to place their monitors. Neither of these assumptions hold for monitoring the internet with a highly distributed software. Since the existing literature is based upon these assumptions, we need to look elsewhere for solutions. In this paper, we first evaluate the extent to which classical topology discovery systems involve duplicated effort. By classical topology discovery, we mean those tracerouting from a small number of monitors to a large set of common destinations, such as skitter. Duplicated effort in such systems takes two forms: measurements made by an individual monitor that replicate its own work, and measurements made by multiple monitors that replicate each other’s work. We term the first intra-monitor redundancy and the second inter-monitor redundancy. Using skitter data from August 2004, we quantify both kinds of redundancy. We show that intramonitor redundancy is high close to each monitor. This fact is not surprising given the tree-like structure (or cone [6]) of routes emanating from a single monitor. However, the degree of such redundancy is quite serious: some interfaces are visited once for each destination probed (which could be hundreds of thousands of times per day in a large-scale system). Further, with respect to inter-monitor redundancy, we find that most interfaces are visited by all monitors, especially when close to destinations. This latter form of redundancy is also potentially quite serious, since this would be expected to grow proportional to the number of monitors in future large-scale measurement systems. Our analysis of the nature of redundant probing suggests more efficient algorithms for topology discovery. In particular, our second contribution is to propose and evaluate an algorithm called Doubletree. We show that Doubletree can dramatically reduce the impact on routers and final destinations by reducing redundant probing, while maintaining high coverage in terms of interface and link discovery. Doubletree is particularly effective at removing the worst cases of highly redundant probing that would be expected to raise alarms. Doubletree takes advantage of the tree-like structure of single-source or single-destination routing to avoid duplication of effort. Unfortunately, general strategies for reducing these two kinds of redundancy are in conflict. On the one hand, intra-monitor re2
dundancy is reduced by starting probing far from the monitor, and working backward along the tree-like structure that is rooted at that monitor. Once an interface is encountered that has already been discovered by the monitor, probing stops. On the other hand, inter-monitor redundancy reduced by probing forwards towards a destination until encountering a previously-seen interface. In this case, the tree-like structure is based on the probes of multiple monitors towards a same destination. We show how to balance these conflicting strategies in Doubletree. In Doubletree, probing starts at a distance that is intermediate between monitor and destination. We demonstrate methods for choosing this distance, and we then evaluate the resulting performance of Doubletree. Despite the challenge inherent in reducing both forms of redundancy simultaneously, we show that probing via Doubletree can reduce measurement load by approximately 70% while maintaining interface and link coverage above 90%. The Doubletree algorithm requires communication between monitors in order to reduce intermonitor redundancy. Information regarding interfaces seen when tracing towards each destination must be shared. However, this can lead to considerable overhead as the number of known interfaces grows. In this paper, we also propose to reduce this cost through the use of Bloom filters for lossy encoding of the interface set. Surprisingly, we find that using Bloom filters can increase node and link coverage without a large increase in redundancy. The remainder of this paper is organized as follow: Chapter 1 evaluates the extent of redundancy in classical topology tracing systems. Chapter 2 describes and evaluates the Doubletree algorithm. Chapter 3 shows how Bloom filters can help to reduce the communication cost required by our algorithm. Finally, Chapter 4 concludes this paper and discusses directions for future work.
1
the United Kingdom, France, Sweden, the Netherlands, Japan, and New Zealand. The monitors share a common destination set of nearly one million IPv4 addresses. Each monitor cycles through the destination set at its own rate, taking typically three days to complete a cycle. For the purpose of our studies, in order to reduce computing time to a manageable level, we worked from a limited destination set of 50,000, randomly chosen from the original set. Visits to host and router interfaces are the metric by which we evaluate redundancy. We consider an interface to have been visited if its IP address appears at one of the hops in a traceroute. Though it would be of interest to calculate the load at the host and router level, rather than at the individual interface level, we make no attempt to disambiguate interfaces in order to obtain a router-level graph. The alias resolution techniques described by Pansiot and Grad [12], by Govindan and Tangmunarunkit [22], for Mercator, and applied in the iffinder tool from Caida [23], would require active probing beyond the skitter data, preferably at the same time that the skitter data is collected. The methods used by Spring et al. [24], in Rocketfuel, and by Teixeira et al. [25], apply to routers in the network core, and are untested in stub networks. Despite these limitations, we believe that the load on individual interfaces is a useful measure. As Broido and claffy note [6], “interfaces are individual devices, with their own individual processors, memory, buses, and failure modes. It is reasonable to view them as nodes with their own connections.” What does it mean for an IP address to appear at a given hop distance from a monitor? Skitter, like many standard traceroute implementations, sends three probe packets for each hop count. Our accounting assumes a baseline probing method which, instead, tries up to three times to get a response at each hop. After the first successful response, the probe moves to the next hop. Thus, the first successfully reached address at each hop is the one used. If none of the three probes are returned, the hop is recorded as non-responding. In terms of redundancy, this method in fact revisits interfaces less often than the current version of skitter, but is more consistent with the goal of minimizing measurement load, and its behavior can be easily simulated from skitter traces.
Redundancy
In this chapter we quantify and analyze the extensive measurement redundancy that can be found in a classical topology discovery system.
Even if an IP address is returned for a given hop count, it might not be valid. Due to the presence Our study is based on skitter data from August 1st of poorly configured routers along traceroute paths, through 3rd , 2004. This data set was generated by skitter occasionally records anomalies such as private 24 monitors located in the United States, Canada, IP addresses that are not globally routable. We ac-
1.1
Methodology
3
count for invalid hops as if they were non-responding hops. The addresses that we consider as invalid are a subset of the special-use IPv4 addresses described in RFC 3330 [26]. Specifically, we eliminate visits to the private IP address blocks 10.0.0.0/8, 172.16.0.0/12, and 192.168.0.0/16. We also remove the loopback address block 127.0.0.0/8. In our data set, we find 4,435 different special addresses, more precisely 4,434 are private addresses and only one is a loopback address. Special addresses cover around 3% of the entire considered addresses set. Though there were no visits in the data to the following address blocks, they too would be considered invalid: the “this network” block 0.0.0.0/8, the 6to4 relay anycast address block 192.88.99.0/24, the benchmark testing block 198.18.0.0/15, the multicast address block 224.0.0.0/4, and the reserved address block formerly known as the Class E addresses, 240.0.0.0/4, which includes the lan broadcast address, 255.255.255.255. We evaluate the redundancy at two levels. One is the microscopic level of a single monitor, considered in isolation from the rest of the system. This intra-monitor redundancy is measured by the number of times the same monitor visits an interface. The other, macroscopic, level considers the system as an ensemble of monitors. This inter-monitor redundancy is measured by the number of monitors that visit a given interface, counting only once each monitor that has non-zero intra-monitor redundancy for that interface. By separating the two levels, we separate the problem of redundancy into two problems that can be treated somewhat separately. Each monitor can act on its own to reduce its intra-monitor redundancy, but cooperation between monitors is required to reduce inter-monitor redundancy.
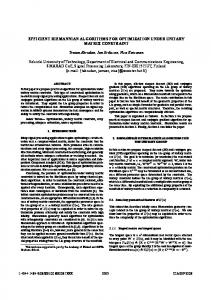
Figure 1: Quantiles key the range from the minimum to the 1st quartile, and leaves a space from the 1st to the 2nd quartile. The space above the dot runs from the 2nd to the 3rd quartile, and the line above that extends from the 3rd quartile to the maximum. Small tick marks to either side of the lines mark some additional percentiles: marks to the left for the 10th and 90th , and marks to the right for the 5th and 95th . In the case of highly skewed distributions, or distributions drawn from small amounts of data, the vertical lines or the spaces between them might not appear. For instance, if there are tick marks but no vertical line above the dot, this means that the 3rd quartile is identical to the maximum value. In the figures, each quantile plot sits directly above an accompanying bar chart that indicates the quantity of data upon which the quantiles were based. For each hop count, the bar chart displays the number of interfaces at that distance. For these bar charts, a log scale is used on the vertical axis. This allows us to identify quantiles that are based upon very few interfaces (fewer than twenty, for instance), and so for which the values risk being somewhat arbitrary.
1.3 1.2
Description of the Plots
Intra-monitor Redundancy
Intra-monitor redundancy occurs in the context of the tree-like graph that is generated when all traceroutes originate at a single point. Since there are fewer interfaces closer to the monitor, those interfaces will tend to be visited more frequently. In the extreme case, if there is a single gateway router between the monitor and the rest of the internet, a single IP address belonging to that router should show up in every one of the traceroutes. We measure intra-monitor redundancy by considering all traceroutes from the monitor to the common destinations, whether there be problems with a traceroute, as described in Sec. 1.1, or not. Having calculated the intra-monitor redundancy for each interface, we organize the results by the dis-
Since the redundancy distributions are generally skewed, quantile plots give us a better sense of the data than would plots of the mean and variance. There are several possible ways to calculate quantiles. We calculate them in the manner described by Jain [27, p. 194], which is: rounding to the nearest integer value to obtain the index of the element in question, and using the lower integer if the quantile falls exactly halfway between two integers. Fig. 1 provides a key to reading the quantile plots found in Figs. 2 and 3 and figures found later in the paper. A dot marks the median (the 2nd quartile, or 50th percentile). The vertical line below the dot delineates 4
redundancy number of interfaces
10
6
10
5
10
4
10
3
10
2
10
1
10
0
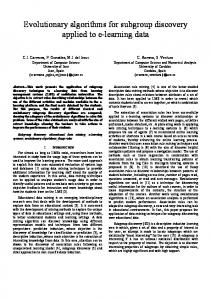
Looking first at the histograms for interface counts (lower half of each plot), we see that these data are consistent with distributions typically seen in such cases. Plotted on a linear scale (not shown here) these distributions display the familiar bell-shaped curve typical of internet interface distance distributions. The distribution for champagne is fairly typical of all monitors. It represents the 92,355 unique IP addresses discovered by that monitor. This value is shown as a separate bar to the right of the histogram, labeled “all”. We see that the interface distances are distributed with a mean at 18 hops corresponding to a peak of 9,135 interfaces that are visited at that distance. The quantile plots show the nature of the intramonitor redundancy problem. Looking first to the bar at the right hand of each chart, showing the quantiles for all of the interfaces taken together, we can see that the distributions are highly skewed. The median interface has a redundancy of one. Even the 75th quantile is one, as evidenced by the lack of a gap between the dot and the line representing the top quarter of values. However, for a very small portion of the interfaces there is a very high redundancy. The maximum redundancy in each case is 50,000—equal to the number of destinations. Looking at how the redundancy varies by distance, we see that the problem is worse the closer one is to the monitor. This is what we expect given the treelike structure of routing from a monitor, but here we see how serious the phenomenon is from a quantitative standpoint. For the first three hops from each monitor, the median redundancy is 50,000. A look at the histograms shows that there are very few interfaces at these distances. Just one interface for arin, and the same for champagne, save for the presence of a second interface at the third hop. This second interface is only visited once, as represented by the presence of the 5th and 10th percentile marks (since there are only two data points, the lower valued point is represented by the entire lower quarter of values on the plot). Beyond three hops, the median redundancy drops rapidly. By the sixth hop, in both cases, the median is below ten. By the twelfth hop, the median is one. However, the distributions remain highly skewed. Even fifteen hops out, some interfaces experience a redundancy on the order of several hundred visits. With small variations, these patterns are repeated for each of the monitors. From the point of view of planning a measurement
all 6
105 104 103 102 101 100 10 0
5
10
15
20
25
30
35
all
hop
number of interfaces
redundancy
(a) arin
10
6
10
5
10
4
10
3
10
2
10
1
10
0
all 6
105 104 103 102 101 100 10 0
5
10
15
20
25
30
35
all
hop
(b) champagne
Figure 2: Skitter intra-monitor redundancy tance of the interfaces from the monitor. We measure distance by hop count. Since the same interface can appear at a number of different hop counts from a monitor, for instance if routes change between traceroutes, we arbitrarily attribute to each interface the hop count at which it was first visited. This process yields, for each hop count, a set of interfaces that we sort by number of visits. We then plot, hop by hop, the redundancy distribution for interfaces at that hop count. 1.3.1
Results
Fig. 2 shows intra-monitor redundancy quantile distributions for two representative skitter monitors: arin and champagne. 5
25
59.7% 40.3%
redundancy
20
10.4% 1.5% 0.5% 87.6%
10
0
Table 1: Probes statistics for champagne system, the extreme values are the most worrisome. It is clear that there is significant duplicated effort, but it is especially concentrated in selected areas. The problem is most severe on the first few interfaces, but even interfaces many hops out receive hundreds or thousands of repeat visits. Beyond the danger of triggering alarms, there is a simple question of measurement efficiency. Resources devoted to reprobing the same interfaces would be better saved, or reallocated to more fruitful probing tasks. Table 1 presents additional statistics for champagne. The first part of the table indicates the portion of destinations that respond and the portion that do not respond. Fully 40.3% of the traceroutes do not terminate with a destination response. The second part of the table describes redundancy in terms of probes sent, rather than from an interface’s perspective. Only 10.4% of probes serve to discover a new interface. (Note: in the intra-monitor context, an interface is considered to be new if that particular monitor has not previously visited it.) An additional 2.0% of probes hit invalid addresses, as defined in Sec. 1.1, or do not result in a response. This leaves 87.6% of the probes that are redundant in the sense that they visit interfaces that the monitor has already discovered. The statistics in this table are typical of the statistics for every one of the 24 monitors.
1.4
15
5
number of interfaces
Destinations Responding Not responding Probes Interface discovery Invalid addresses No response Redundant
all 6
105 104 103 102 101 100 10 0
5
10
15
20
25 hop
30
35
all
Figure 3: Skitter inter-monitor redundancy most once towards an interface’s inter-monitor redundancy, even if it has visited that interface multiple times. For a given interface, the redundancy is calculated just once with respect to the entirety of the monitors: it does not vary from monitor to monitor as does intra-monitor redundancy. However, what does vary depending upon the monitor is whether the particular interface is seen, and at what distance. In order to attribute a single distance to an interface, a distance that does not depend upon the perspective of a single monitor but that nonetheless has meaning when examining the effects of distance on redundancy, we attribute the minimum distance at which an interface has been seen among all the monitors. 1.4.1
Results
Fig. 3 shows inter-monitor redundancy for the skitter data. The distribution of interfaces by hop count differs from the intra-monitor case due to the difference in how we account for distances. The mean is closer to the traceroute source (10 hops), corresponding to the peak of 21,222 interfaces that are visited at that distance. The redundancy distribution also has a very different aspect. Considering, first of all, the redundancy over all of the interfaces (at the far right of the plot), we see that the median interface is visited by all 24 monitors, which is a subject of great concern. The distribution is also skewed, though the effect is less dramatic since the vertical axis is a linear scale, with only 24 possible values. We also see a very different distribution by distance. Interfaces that are very close in to a monitor, at one or two hops, have a median inter-monitor re-
Inter-monitor Redundancy
Inter-monitor redundancy occurs when multiple monitors visit the same interface. The degree of such redundancy is of keen interest to us when increasing the number of monitors by several orders of magnitude is envisaged. We calculate the inter-monitor redundancy for each interface by counting the number of monitors that have visited it. A monitor can be counted at 6
dundancy of one. The same is true of interfaces that are far from all monitors, at distances over 20, though there are very few of these. (The presence of an interface at hop 27 that is seen by all monitors serves to raise the median at that distance to 24.) What is especially notable is that interfaces at intermediate distances (6 to 15) tend to be visited by all, or almost all, of the monitors. Though their distances are in the middle of the distribution, this does not mean that the interfaces themselves are in the middle of the network. Many of these interfaces are in fact destinations. Recall that every destination is targeted by every host.
2
Algorithm
In this chapter, we present the Doubletree algorithm, our method for probing the network in a friendly manner while discovering nearly all the interfaces and links that a classical tracerouting approach would discover. Sec. 2.1 describes how Doubletree works. Sec. 2.2 discusses the results of varying the single parameter of this algorithm. Finally, Sec. 2.3 shows the extent of intra- and inter-monitor redundancy reduction when using the algorithm.
2.1
(a) Monitor-rooted
Description
Doubletree takes advantage of the tree-like structure of routes in the internet. Routes lead out from a monitor towards multiple destinations in a tree-like way, as shown in Fig. 4(a), and the manner in which routes converge towards a destination from multiple monitors is similarly tree-like, as shown in Fig. 4(b). The tree is an idealisation of the structure encountered in practice. Paths separate and reconverge. Loops can arise. But a tree may be a good enough first approximation on which to base a probing algorithm. A probing algorithm can reduce its redundancy by tracking its progress through a tree, as it probes from the direction of the leaves towards the root. So long as it is probing in a previously unknown part of the tree, it continues to probe. But once it encounters a node that is already known to belong to the tree, it stops. The idea being that the remainder of the path to the root must already be known. In reality, there is only a likelihood and not a certainty that the remainder of the path is known. The redundancy saved by not reprobing the same paths to the root
(b) Destination-rooted
Figure 4: Tree-like routing structures
7
or more concisely, the global stop set, that contains (interface, destination) pairs. When probing forwards towards destination d and encountering an interface i, forwards probing stops if (i, d) ∈ F . Communication between monitors is needed in order to share this second stop set. Only one aspect of Doubletree has been suggested in prior literature. Govindan and Tangmunarunkit [22] employ backwards probing with a stopping rule in the Mercator system, in order to reduce intra-monitor redundancy. However, no results have been published regarding the efficacy of this approach. Nor have the effects on inter-monitor redundancy been considered, or the tension between reducing the two types of redundancy (for instance, Mercator tries to start probing at the destination, or as close to it as possible). Nor has any prior work suggested a manner in which to exploit the tree-like structure of routes that converge on a destination. Finally, no prior work has suggested cooperation among monitors. Algorithm 1 is a formal definition of the Doubletree algorithm. It assumes that the following two functions are defined. The response() procedure returns true if an interface replies to at least one of the probes that were sent. halt () is a primitive that checks if the probing must be stopped for different reasons: a loop is detected or a gap (five successive non-responding nodes) is discovered. This algorithm has only one tunable parameter: the initial hop count h. In the remainder of this section, we explain how to set this parameter in terms of another parameter that we call p. We wish for each monitor to be able to determine a reasonable value for h: one that is far enough from the monitor to avoid excess intra-monitor redundancy, yet not so far as to generate too much inter-monitor redundancy. Since each monitor will be positioned differently with respect to the internet, what is reasonable for one monitor might not be reasonable for another. We thus base our rule for choosing h on the distribution of path lengths as seen from the perspective of a given monitor. The general idea is to start probing at a distance that is rich in interfaces, but that is not so far as to exacerbate inter-monitor redundancy. Based upon our intra-monitor redundancy studies, discussed above, we would expect an initial hop distance of five or more from the typical monitor to be fairly rich in interfaces. However, we also know that this is the distance at which inter-monitor re-
may nonetheless be worth the loss in coverage that results from not probing the occasional different path. Doubletree uses both the monitor-rooted and the destination-rooted trees. When probing backwards from the destinations towards the monitor, it applies a stopping rule based upon the monitor-rooted tree. The goal in this case is to reduce intra-monitor redundancy. When probing forwards, the stopping rule is based upon the destination-rooted tree, with the goal being to reduce inter-monitor redundancy. There is an inherent tension between the two goals. Suppose the algorithm were to start probing only far from each monitor. Probing would necessarily be backwards. In this case, the destination-based trees cannot be used to reduce redundancy. A monitor might discover, with destination d at hop h, an interface that another monitor also discovered when probing with destination d. However this does not inform the monitor as to whether the interface at hop h − 1 is likely to have been discovered as well. So it is not clear how to reduce inter-monitor redundancy when conducting backwards probing. Similarly, when conducting forwards probing (of the classic traceroute sort), it is not clear how intramonitor redundancy can be avoided. Paths close to the monitor will tend to be probed and reprobed, for lack of knowledge of where the path to a given destination might diverge from the paths already seen. In order to reduce both inter- and intra-monitor redundancy, Doubletree starts probing at what is hoped to be an intermediate point. For each monitor, there is an initial hop count h. Probing proceeds forwards from h, to h+1, h+2, and so forth, applying the stopping rule based on the destination-rooted tree. Then it probes backwards from h, to h−1, h−2, etc., using the monitor-based tree stopping rule. In the special case where there is no response at distance h, the distance is halved, and halved again until there is a reply, and probing continues forwards and backwards from that point. Rather than maintaining detailed information on tree structures, it is sufficient for the stopping rules to make use of sets of interfaces. Each monitor tracks the interfaces that it has discovered. These form a stop set B, called the backwards tracing stop set, or more concisely, the local stop set, to be used in a monitor’s own backwards probing. When probing backwards from a destination d, encountering an interface in B causes the monitor to stop and move on to the next destination. Each monitor also receives another stop set, F , called the forwards tracing stop set, 8
1
Algorithm 1 Doubletree Require: F , the global stop set received by this monitor. Ensure: F updated with all (interface,destination) pairs discovered by this monitor.
0.9
cumulative mass
0.8 0.7 0.6 0.5 0.4 0.3 0.2 0.1
procedure Doubletree(h, D) 0 0 5 10 15 20 25 30 35 40 2: B←∅ ⊲ Local stop set path length 3: for all d ∈ D do ⊲ Destinations 4: h ← AdaptHValue(h) ⊲ Initial hop 5: TraceForwards(h, d) Figure 5: Lengths of paths from monitor apan-jp 6: TraceBackwards(h − 1, d) 7: end for ter monitors, but the horizontal position of the curve 8: end procedure can vary by a number of hops from monitor to monitor. So if we are to fix the probability, p, of hitting a 9: procedure AdaptHValue(h) responding destination on the first probe, there will 10: while ¬response(vh ) ∧ h 6= 1 do ⊲ vh the be different values h for each monitor, but that value interface discovered at h hops h will correspond to a similar level of incursion into the ⊲ h an integer 11: h← 2 network across the board. 12: end while We have chosen p to be the single independent pa13: return h rameter that must be tuned to guide Doubletree. In 14: end procedure the following section, we study the effect of varying p on the tension between inter- and intra-monitor re15: procedure TraceForwards(i, d) dundancy, and the overall interface and link coverage 16: while vi 6=Sd ∧ (vi , d) ∈ / F ∧ ¬halt() do that Doubletree obtains. 17: F ← F (vi , d) 18: i++ 19: end while 2.2 Tuning the Parameter p 20: end procedure This section discusses the effect of varying p. Sec. 2.2.1 describes our experimental methodology, 21: procedure TraceBackwards(i, d) and Sec. 2.2.2 presents the results. 22: while i > S 1 ∧ vi ∈ / B ∧ ¬halt() do 23: B = B S vi 24: F = F (vi , d) 2.2.1 Methodology 25: i−− In order to test the effects of the parameter p on 26: end while both redundancy and coverage, we implement Dou27: end procedure bletree in a simulator. We examine the following values for p: between 0 (i.e., forwards probing only) and 0.2, we increment p in steps of 0.01. From 0.2 to 1 dundancy can become a problem. We are especially (i.e., backwards probing in all cases when the desticoncerned about inter-monitor redundancy at desti- nation replies to the first probe), we increment p in nations, because this is what is most likely to look steps of 0.1. As will be shown, the concentration of like a DDoS attack. values close to 0 allows us to trace the greater variaOne parameter that a monitor can estimate with- tion of behavior in this area. out much effort is its probability of hitting a respondTo validate our results, we run the simulator using ing destination at any particular hop count h. For in- the same skitter data set we considered in Sec. 1. stance, Fig. 5 shows the cumulative mass plot of path We assume that Doubletree is running on the skitter lengths from monitor apan-jp. If apan-jp choses monitors, during the same period of time that the h = 10, that implies a 0.1 probability of hitting a skitter data represents, and implementing the same responding destination on the first probe. The shape baseline probing technique described in Sec. 1.1, of of this curve is very similar for each of the 24 skit- probing up to three times at a given hop distance. 1:
9
1
25
15 100 10 50
destination redundancy
interface redundancy
20 150
5
0
0 0
0.2
0.4
0.6
0.8
nodes links
interface destination coverage in comparison to skitter
200
0.8
0.6
0.4
0.2
0
1
0
p
0.2
0.4
0.6
0.8
1
p
Figure 6: Doubletree redundancy, 95th percentile. Figure 7: Links and nodes coverage in comparison to Inter-monitor redundancy on destinations, gross re- classic probing dundancy on router interfaces. The difference lies in the order in which Doubletree probes the hops, and the application of Doubletree’s stopping rules. Doubletree requires communication of the global stop set from one monitor to another. We therefore choose a random order for the monitors and simulate the running of Doubletree on each one in turn. The global stop set is added to and passed on to each monitor in turn. This is a simplified scenario compared to the way in which a fully operational cooperative topology discovery protocol might function, which is to say with all of the monitors probing and communicating in parallel. However, we feel that the scenario allows greater realism in the study of intra-monitor redundancy. The typical monitor in a large, highly distributed infrastructure will begin its probing in a situation in which much of the topology has already been discovered by other monitors. The closest we can get to simulating the experience of such a monitor is by studying what happens to the last in our random sequence of monitors. All Doubletree intramonitor redundancy results are for the last monitor in the sequence. (Inter-monitor redundancy, on the other hand, is monitor independent.) 2.2.2
Results
Since the value p has a direct effect on the redundancy of destination interfaces, we initially look at the effect of p separately on destination redundancy and on router interface redundancy. We are most concerned about destination redundancy because of its tendency to appear like a DDoS attack, and we are concerned in particular with the inter-monitor redundancy on these destinations, because a variety of sources is a prime indicator of such an attack. The 10
right-side vertical axis of Fig. 6 displays destination redundancy. With regards router interface redundancy, we are concerned with overall load, and so we consider a combined intra- and inter-monitor redundancy measure that we call gross redundancy, that counts the total number of visits to an interface. For both destinations and router interfaces, we are concerned with the extreme values, so we consider the 95th percentile. As expected the 95th percentile inter-monitor redundancy on destinations increases with p. Values increase until p = 0.5, at which point they plateau at 24. The point p = 0.5 is the point at which, in 50% of the cases, the probe sent to a distance h hits a destination. Doubletree allows a reduction in 95th percentile inter-monitor redundancy when compared to classical probing for lower values of p. The reduction is 84% when p = 0. As opposed to destination redundancy, the 95th percentile gross router interface redundancy decreases with p. The 95th percentile for the internal interface gross redundancy using the classical approach is 449. Doubletree thus allows a reduction between 59% (p = 0) and 72% (p = 1). This preliminary analysis suggests that Doubletree should employ a low value for p, certainly below 0.5, in order to reduce inter-monitor redundancy on destinations. This is a very different approach than that taken by Mercator, which attempts to hit a destination every time. On the other hand, too low a value will have a negative impact on router interfaces. We now examine other evidence that will bear on our choice of p. Fig. 7 illustrates the effects of p on the node and link coverage percentage in comparison to classic probing. As we can see, the coverage increases with p but a small decrease is noticed for values of p greater
1e+08
classic p=0 p = 0.05 p = 0.10 p = 0.15 p = 0.20 p = 0.50 p=1
number of probes sent
Nb probes for skitter 1e+07
1e+06
Min probes for link discovery Min probes for interface discovery 100000 0
0.2
0.4
0.6
0.8
1
p
Nonresponding 126,168 34,867 26,136 28,857 31,792 34,624 47,362 52,422
Unidentifiable 512,764 62,009 127,917 162,845 196,220 232,215 383,000 512,764
Figure 8: Amount of probes sent
Table 2: Load on anonymous interfaces
than 0.7. The maximum of coverage is reached when p = 0.7: Doubletree discovers 95,49% of links and 98,4% of nodes. The minimum of coverage appears when p = 0: 77% of links and 89% of nodes. However, link coverage grows rapidly for p values between 0 and 0.4. After that point, a kind of plateau is reached, before a small decrease. Fig. 7 shows that the information (i.e. links and nodes) discovery of our algorithm is satisfactory, especially for non zero values of p. Fig. 8 shows the effects of p on the number of probes sent. The horizontal axis indicates the value for p. The vertical axis represents the number of probes sent. If we consider an ideal system in which each probe sent visits a new interface (i.e., there is no redundancy), the number of probes sent to discover all the interfaces will be 131,078 (i.e., the number of different interfaces in the data set). The lowest vertical bar represents this fact. Furthermore, if the ideal system is also able to elicit links without any redundancy, then it should send 279,798 probes. The second vertical line considers that point in the plot. On the other hand, if our system works like skitter, it has to send 19,280,551 probes. This is represented by the highest vertical line. In order to plot all these lines on the same figure, the vertical axis has been plotted in a log scale. With Doubletree, the number of probes needed varies between 11,684,439 (i.e., a reduction of 40% in comparison to the classical approach) and 5,330,098 (i.e., a reduction of 73% in comparison to the classical approach). This minimum is reached when p = 0.12. In the skitter data set that we consider, not all nodes (internal interfaces and destinations) necessarily reply to probes. An internal interface might not response to probes because the router does not send ICMP messages, or is too busy. Usually, destinations do not reply because of security policy. In our
study, we consider two kinds of nodes that do not reply to probes: the non-responding nodes and the unidentifiable nodes. Non-responding nodes appear when a node does not response in the path, but there are other interfaces (either router or destination) that respond at a more distant hop count. On the other hand, unidentifiable nodes appear at the end of the path, when skitter does not complete a path. As we do not know if these nodes are destinations or not, we consider them to be unidentifiable. Table 2 compares Doubletree with classic probing as concerns the non-responding and unidentifiable nodes. We can show that we strongly reduce the impact on unidentifiable nodes. We note that when p is at its maximum, the stress on unidentifiable nodes is identical to the classical approach. Out of concern that our solution might be too tightly tied to fit to our data set, we perform the same experiment on another data set of 50,000 destinations, randomly chosen from the whole set. There is no overlapping between the two destination subsets (i.e., they are totally disjoint). We find that the results obtained with the second data set are consistent with the first one. These results presented in this section are important in the case of a highly distributed measurement tool. They demonstrate that it is possible to probe in a network friendly manner while maintaining a very high level of topological information gathered by monitors. In this section, we discussed the effects of different p values. However, results permit now to identify a range of values where a good compromise between redundancy reduction and high level of coverage is possible. Thus, hitting a destination with the very first probe in 20% of the cases seems to us to be a reasonable maximum. Further, in terms of coverage, a probability p of 0.05 seems also reasonable.
11
Redundancy Reduction
10
6
10
5
10
4
10
3
10
2
10
1
10
0
all
number of interfaces
2.3
redundancy
In the perspective of a real system implementing our algorithm, the value p (and the corresponding h) cannot be chosen a priori, as we did in our experimentations. However, it can be easily computed on the fly by using an iterative process, as the monitor’s knowledge about paths and topology improves.
6
105 104 103 102 101 100 10
In this section, we study the effects of Doubletree 0 5 10 15 20 25 30 35 all on the intra- and inter-monitor redundancy for some hop values of p. Sec. 2.3.1 describes our methodology. Sec. 2.3.2 Intra-monitor redundancy for presents the intra- and Sec. 2.3.3 the inter-monitor Figure 9: champagne monitor with p = 0.05. redundancy reduction. Methodology
25
2.3.2
Intra-monitor
Fig. 9 shows intra-monitor redundancy when using Doubletree with p = 0.05 for a representative monitor: champagne. First of all, we could note that, using Doubletree, champagne is able to elicit 97% of the interfaces in comparison to the classical method. Looking to the right part of the plot first, we note that the median has a redundancy of 3. It is a little bit higher than for the classical method. As in the 12
20 redundancy
We use the simulator to study the effects of Doubletree on intra- and inter-monitor redundancy. Again, for comparison reasons, we use the same data set as in Sec. 1. The plots are presented in the same way as in Sec. 1. However, the lower part of the graphs, the histograms, contains additional information. The bars are now enveloped by a curve. This curve indicates, for each hop, the quantity of nodes discovered while using the classical method. The bars themselves describe the number of nodes discovered by Doubletree. Therefore, the space between the bars and the curve represents the quantity of nodes Doubletree misses. In Sec. 2.2, we identify the range of p values for which redundancy is sufficiently low and coverage high enough. We run simulations for p = 0.05, p = 0.1, p = 0.15 and p = 0.2 and study the effects on inter- and intra-monitor redundancy reduction. However, we note that the differences between the results for each p value are small. Therefore, we choose to present in the following sections only the results for p = 0.05.
15 10 5 0
number of interfaces
2.3.1
the
all 6
105 104 103 102 101 100 10 0
5
10
15
20
25 hop
30
35
all
Figure 10: Inter-monitor redundancy with p = 0.05. classical approach, for a very small number of interfaces there is a high redundancy. Nevertheless, the maximum is 15,029. Compared to the 50,000 in the classical approach, there is a reduction of 70%. Looking now at how the redundancy varies by distance, we note a strong reduction for the median values close to the monitor. However, for further hops, the median values drop lower than in the classical approach (see, for comparison, Fig. 2(b)). Finally, we note that high quantiles for hops far from the source have higher values than for the classical method. 2.3.3
Inter-monitor
Fig. 10 shows inter-monitor redundancy when using Doubletree with p = 0.05. We first analyse the lower part of the graph. The distribution of hop counts for interfaces shows that most of the undiscovered interfaces are far from the source. As most of these nodes are only visited by
a single monitor (see Fig. 3), due to the nature of the global stop set and the stop rule, the risk of missing them is very high. Probably, with a higher value for p, we would have elicited them. However, this solution would raise the redundancy for destinations, as explained in Sec. 2.2.2. Those undiscovered nodes are, in a certain sense, the price to pay to reduce the redundancy. Again, this fact represents the inherent tension in the topology discovery problem. Some nodes are sacrificed in order to reduce the redundancy. If we compare Fig. 10 with Fig. 3, we can see that the redundancy is strongly reduced. The highest value for the median is only 6. For the classical method, it is equal to the maximum, i.e., 24. Furthermore, the highest quantiles between hop 4 and 13 are more dissipated. Finally, the right part of the graph, called all, indicates that the median value is 2. If we compare with Fig. 3, where the median equals 24, we note that Doubletree allows a very strong reduction in intermonitor redundancy.
3
Bloom Filters
The algorithm presented in Sec. 2.1 requires that monitors exchange a set of (interface, destination) pairs. The maximum size of the global stop set will be the maximum number of (interface, destination) pairs in the data set considered. Our study considers only 50,000 common destinations, but skitter monitors probe towards a common set of on the order of a million destinations. Sharing a stop set based on this number of destinations or even more could lead to a severe communication overhead. This should be avoided, or at least strongly limited, in the case of a highly distributed measurement tool. In order to reduce communication bandwidth cost, we propose to use Bloom filters [28], a technique that employs hash functions to conduct lossy compression, and that has already seen a number of networking applications, as described by Broder, A. and Mitzenmacher in a 2002 survey [29]. A feature of Bloom filters is that the tradeoffs between the degree of compression they offer and the degree of error that their lossiness introduces are well understood. Bloom filters are used for verifying set membership. The elements of a set of data items, in this case the (interface,destination) pairs of Doubletree’s global stop set, are each hashed multiple times to a vector, the filter. Subsequently, set membership can 13
be tested by examining the hash values that correspond to an (interface, destination) pair. If a pair is in the set, the filter will always return true. However, there is a finite, well defined, probability of a false positive for a pair that is not in the set. As we have described Doubletree in prior sections, each monitor has full knowledge of what was discovered by the other monitors. Each application of the stop set rule is thus taken with the highest level of certainty. Now with the risk of false positives from Bloom filters, some forwards probing along the treelike structure rooted at a destination will stop sooner than would otherwise be the case. The rate of false positives can be fine tuned by adjusting such parameters as the size of vector employed, and the number of hash functions. For a given number of elements and a given vector size, for instance, an optimal number of hash functions can be chosen to minimize the probability of false positives. We perform the same experiments as in Sec. 2.2 in order to obtain a preliminary sense of the effect of Bloom filters on Doubletree. The methodology followed is the same as in Sec. 2.2, except for the stop set implementation. We experiment with a low false positive rate. Choosing a vector that contains ten times the number of bits as there are (interface, destination) pairs in the global stop set, and using the optimal number of hash functions, five (Fan et al. [30, Sec. 4.3] make the same choices), gives a false positive rate of 0.9%. Since a pair of IPv4 addresses consists of 64 bits, the Bloom filter provides a 6.4:1 compression ratio. This, of course, is a first approximation, because the pair information could be compressed using standard lossless compression techniques. Likewise, Mitzenmacher [31] has described effective techniques for compression of Bloom filters; techniques that have the effect of lowering the false positive rate. We have yet to evaluate what the compression ratio would be if we were to compare compressed pair lists with compressed Bloom filters. Fig. 11 presents the coverage in terms of links and nodes when using a Bloom filter with the parameters just described. The level of coverage is runs from 99% (p = 0) to 99.5% for nodes and from 97% (p = 0) to 98,6% for links. The coverage values are more uniform across values of p than they were for the standard global stop set. This coverage is better than the results we describe in Sec. 2.2.1, that do not use Bloom filters. This result is counterintuitive because we would
coverage in comparison to skitter
1
percentile redundancy is at the maximum (i.e., 24) for each value of p. A full exploration of the tradeoffs involved in the use of Bloom filters is a subject for future work.
nodes links
0.8
0.6
0.4
4
0.2
Conclusion
0 0
0.2
0.4
0.6
0.8
1
p
Figure 11: Links and nodes coverage while using Bloom filters expect that false positives would have the effect of constraining exploration rather than promoting it. It seems all the more surprising that coverage should increase at p = 1, when the global stop set, or its Bloom filter replacement, is not even applied for backwards probing. To address this second question first, recall that when an interface at hop distance h does not respond to probes, h is halved and halved again until a responding interface is found. Both forwards and backwards probing then takes place from this new h. In the data set that we consider, approximately 40% of destinations do not respond. Consequently, when p = 1, in fully 40% of the cases Doubletree performs forwards probing, and can use the global stop set implemented as a Bloom filter. Regarding the increase in coverage overall, we can only speculate as to the reasons. It might be that simply the fact of introducing a degree of randomness into the exploration process enhances discovery. Perhaps explorations that are blocked by a false positive leave the way open for further explorations because fewer pairs enter the stop set. An assessment of the effect of introducing randomness into the stopping rule (both false positives and false negatives, independently of the use of Bloom filters for the stop set) is a subject for future work. These initial results are encouraging from the point of view of node and link coverage. However, the price comes in the form of additional probe traffic. The reduction in the number of probes compared to the classical approach is only 8% when p = 0. Nevertheless, the number of probes sent decreases as p increases. It oscillates between 8% and 59%. The gross redundancy on internal interfaces is also higher when p = 0 (398) but it also decreases when p increases. One concern is that the gains are reversed regarding inter-monitor redundancy on destinations. The 95th 14
In this paper, we quantify the amount of redundancy in classical internet topology discovery approaches by taking into account the perspective from the single monitor (intra-monitor) and that of the entire system (inter-monitor). In the intra-monitor case, we find that interfaces close to the monitor suffer from a high number of repeat visits. Concerning inter-monitor redundancy, we see that a large portion of interfaces are visited by all monitors. In order to scale up classical approaches, we have proposed Doubletree, an algorithm that significantly reduces the duplication of effort while discovering nearly the same set of nodes and links. Doubletree simultaneously meets the conflicting demands of reducing intra- and inter-monitor redundancy. We describe how to tune a single parameter for Doubletree in order to obtain an acceptable trade-off between redundancy and coverage. Doubletree introduces communication between monitors. To address the problem of bandwidth consumption, we propose to encode this communication through the use of Bloom filters. Surprisingly, we find that this encoding technique, though it generates false positives that might seem to constrain exploration, can actually increase the coverage of nodes and links. For future work, we plan to study in detail the trade-offs involved in the use Bloom filters. How does the choice of vector size and number of hash functions affect levels of redundancy and coverage? We will also evaluate the relevance of introducing a certain level of false negatives to the stop set. A probing technique that starts probing at a hop h far from the monitor has a non zero probability p of hitting a destination with its first probe. This has serious consequences when scaling up the number of monitors. Indeed, the average impact on destinations will grow linearly as a function of m, the number of monitors. As m increases, the risk that probing will appear to be a DDoS attack will grow. In order to permit greater scaling, we have started to investigate techniques for dividing up the monitor set and the destination set into subsets that we call clusters. By placing an upper bound on the number
of monitors in a cluster, we hope to place a definitive upper bound on inter-monitor redundancy for destination interfaces. Clustering will have effects on redundancy and coverage, and we are investigating these trade-offs.
Acknowledgments
[8] L. Gao, “On inferring autonomous system relationships in the internet,” in Proc. IEEE Global Internet Symposium, Nov. 2000. [9] D. Magoni and J. J. Pansiot, “Analysis of the autonomous system network topology,” ACM SIGCOMM Computer Communication Review, vol. 31, no. 3, pp. 26 – 37, Jul. 2001.
Without the data provided by k claffy and her team [10] H. Tangmunarunkit, J. Doyle, R. Govindan, S. Jamin, and S. Shenker, “Does AS size deat Caida, this research would not have been postermine degree in AS topology?,” in ACM SIGsible. They have also provided many helpful comCOMM Computer Communication Review, Oct. ments; for this, we thank Andre Broido in particu2001. lar. Pierre Lafon and his team at the Centre de Calcul Formel M´edicis, Laboratoire Stix, Ecole Polytech- [11] R. Siamwalla, R. Sharma, and S. Keshav, “Disnique, kindly gave us access to their computing cluscovering internet topology,” Tech. Rep., Cornell ter, allowing faster and easier simulations. We thank University, July 1998. our partners in the traceroute@home project, notably Matthieu Latapy, Alessandro Vespignani, and Alain [12] J. J. Pansiot and D. Grad, “On routes and mulBarrat, for their support and feedback. ticast trees in the internet,” ACM SIGCOMM Computer Communication Review, vol. 28, no. 1, pp. 41–50, Jan. 1998.
References
[13] [1] V. Jacobsen, “traceroute,” 1989, ftp:// ftp.ee.lbl.gov/traceroute.tar.gz. Also see “NANOG traceroute,” ftp://ftp.login.com/ [14] pub/software/traceroute/.
A. Lakhina, J. Byers, M. Crovella, and P. Xie, “Sampling biases in IP topology measurements,” in Proc. IEEE Infocom, 2003. A. Clauset and C. Moore, “Traceroute sampling makes random graphs appear to have power law degree distributions,” arXiv:cond-mat/0312674 v3 8 Feb. 2004.
[2] B. Huffaker, D. Plummer, D Moore, and k claffy, “Topology discovery by active probing,” in Symposium on Applications and the Internet, Jan. [15] P. Erd¨ os and A. R´enyi, “On the evolution of 2002. random graphs,” Publ. Math. Inst. Hung. Acad. [3] “RIPE Network Coordination Centre Test TrafSci., vol. 5, pp. 17–61, 1960. fic Measurement (RIPE NCC TTM),” http: [16] B Cheswick, H. Burch, and S. Branigan, “Map//www.ripe.net/test-traffic/. ping and visualizing the internet,” in Proc. [4] “National Laboratory for Applied Network ReUSENIX Annual Technical Conference, 2000. search Active Measurement Project (NLAR [17] “Grenouille, la m´et´eo du net,” http://www. AMP),” http://watt.nlanr.net/. grenouille.com/. [5] S. Agarwal, L. Subramanian, J. Rexford, and R. Katz, “Characterizing the internet hierarchy [18] C. R. Simpson, Jr. and G. F. Riley, “NETI@home: A distributed approach to from multiple vantage points,” in Proc. IEEE collecting end-to-end network performance INFOCOM, June 2002. measurements,” in Proc. Passive and Active [6] A. Broido and k claffy, “Internet topology: ConMeasurement Workshop (PAM), 2004. nectivity of IP graphs,” in Proc. SPIE Interhttp://setiathome.ssl. national Symposium on Convergence of IT and [19] “SETI@home,” berkeley.edu/. Communication, 2001. [7] M. Faloutsos, P. Faloutsos, and C. Falout- [20] Y. Shavitt, “DIMES,” Distributed Intersos, “On power-law relationships of the internet net MEasurements & Simulations. http://www. topology,” in Proc. ACM SIGCOMM, 1999. netdimes.org/about.html. 15
[21] Y. Bejerano and R. Rastogi, “Robust monitoring of link delays and faults in IP networks,” in Proc. IEEE Infocom, Mar. 2003. [22] R. Govindan and H. Tangmunarunkit, “Heuristics for internet map discovery,” in Proc. IEEE Infocom, 2000. [23] K. Keys, “iffinder,” A tool for mapping interfaces to routers, http://www.caida.org/ tools/measurement/iffinder/(restricted access). [24] N. Spring, R. Mahajan, and D. Wetherall, “Measuring ISP topologies with Rocketfuel,” in Proc. ACM SIGCOMM, 2002. [25] R. Teixeira, K. Marzullo, S. Savage, and G. Voelker, “In search of path diversity in ISP networks,” in Proc. Internet Measurement Conference (IMC), 2003. [26] IANA, “Special-use IPv4 addresses,” RFC 3330, Internet Engineering Task Force, Sep. 2002. [27] R. K. Jain, The Art of Computer Systems Performance Analysis, John Wiley, 1991. [28] B. H. Bloom, “Space/time trade-offs in hash coding with allowable errors,” Communications of the ACM, vol. 13, no. 7, pp. 422–426, 1970. [29] A. Broder and M. Mitzenmacher, “Network applications of Bloom filters: A survey,” in Proc. Allerton Conference, 2002. [30] L. Fan, P. Cao, J. Almeida, and A. Z. Broder, “Summary cache: A scalable wide-area web cache sharing protocol,” in Proc. ACM SIGCOMM, 1998. [31] M. Mitzenmacher, “Compressed Bloom filters,” in Proc. Twentieth Annual ACM Symposium on Principles of Distributed Computing, 2001, pp. 144–150.
16
A
Intra-monitor redundancy plots
10
6
10
6
5
10
5
10
5
10
4
10
4
10
4
10
3
10
3
10
3
10
2
10
2
10
2
10
1
10
1
10
1
10
0
10
0
10
0
10
0
5
10
15
20
25 hop
30
35
all
all 6 105 104 103 102 101 100
10
0
5
15
20
25 hop
30
35
all
all 6
105 104 103 102 101 100 10 0
6
10
6
10
5
10
5
10
4
10
4
10
4
10
3
10
3
10
3
10
2
10
2
10
2
10
1
10
1
10
1
10
0
10
0
10
0
5
10
15
20
25 hop
30
35
(d) i-root classic
all
all 6
105 104 103 102 101 100 10 0
5
10
15
20
25 hop
30
35
(e) k-root classic
all
number of interfaces
6
105 104 103 102 101 100 10
redundancy
10
5
redundancy
6
10
all
10
15
25 hop
30
35
all
all 6
105 104 103 102 101 100 10 0
5
10
15
20
25 hop
30
35
(f) uoregon classic
Figure 12: apan-jp, cam, h-root, i-root, k-root, and uoregon
17
20
(c) h-root classic
10
0
5
(b) cam classic
number of interfaces
number of interfaces
redundancy
(a) apan-jp classic
10
number of interfaces
all 6 105 104 103 102 101 100
redundancy
6
10
redundancy
10
number of interfaces
number of interfaces
redundancy
This appendix presents the intra-monitor redundancy plots for all 24 skitter monitors that form the basis for the study in this paper. For each monitor, we show the redundancy of a classic topology discovery system. For 18 of the monitors, we also show the result of a system applying the Doubletree algorithm with parameter p = 0.05. In each of these cases, the monitor is the last of the 24 to conduct its probing, using the global stop set that has been passed to it by the other monitors.
all
10
6
10
5
10
5
10
4
10
4
10
3
10
3
10
2
10
2 1
10
1
10
0
10
0
number of interfaces
10
redundancy
6
all
number of interfaces
redundancy
10
6
105 104 103 102 101 100 10 0
5
10
15
20
25 hop
30
35
all
6
10
6
10
5
10
5
10
4
10
4
10
3
10
3
10
2
10
2
10
1
10
1 0
10
0
10
redundancy
10
all 6
105 104 103 102 101 100 10 0
5
10
15
20
25 hop
30
35
all
0
6
10
5
10
4
10
4
10
3
10
3
10
2
10
2
10
1
10
1 0
10
0
10
redundancy
10
5
all 6
105 104 103 102 101 100 10 15
20
25 hop
30
20
25 hop
30
35
all
all
6
10
15
6
10
5
10
105 104 103 102 101 100 10
10
0
5
35
5
10
15
20
25 hop
30
35
all
(d) b-root Doubletree (p = 0.05)
number of interfaces
redundancy
(c) b-root classic
number of interfaces
0
(b) arin Doubletree (p = 0.05)
number of interfaces
number of interfaces
redundancy
(a) arin classic
all 6
105 104 103 102 101 100 10
all
(e) cdg-rssac classic
all 6
105 104 103 102 101 100 10 0
5
10
15
20
25 hop
30
35
all
(f) cdg-rssac Doubletree (p = 0.05)
Figure 13: arin, b-root, and cdg-rssac
18
10
6
10
5
10
5
10
4
10
4
10
3
10
3
10
2
10
2 1
10
1
10
0
10
0
number of interfaces
10
redundancy
6
all
number of interfaces
redundancy
10
6
105 104 103 102 101 100 10 0
5
10
15
20
25 hop
30
35
all
6
10
6
10
5
10
5
10
4
10
4
10
3
10
3
2
10
2
10
10
1
10
1
10
0
10
0
redundancy
10
all 6
105 104 103 102 101 100 10 0
5
10
15
20
25 hop
30
35
all
0
6
10
10
5
10
4
10
4
10
3
10
3
2
10
2
10
1 0
redundancy
10
10
1
10
10
0
10 all
6
105 104 103 102 101 100 10 15
20
25 hop
30
35
20
25 hop
30
35
all
all
5
10
15
6
6
5
10
105 104 103 102 101 100 10
10
0
5
5
10
15
20
25 hop
30
35
all
(d) d-root Doubletree (p = 0.05)
number of interfaces
redundancy
(c) d-root classic
number of interfaces
0
(b) champagne Doubletree (p = 0.05)
number of interfaces
number of interfaces
redundancy
(a) champagne classic
all 6
105 104 103 102 101 100 10
all
(e) e-root classic
all 6
105 104 103 102 101 100 10 0
5
10
15
20
25 hop
30
35
all
(f) e-root Doubletree (p = 0.05)
Figure 14: champagne, d-root, and e-root
19
10
6
5
10
5
10
4
10
4
10
3
10
3
10
2
10
2
10
1
10
1 0
10
0
10
redundancy
6
10
all
number of interfaces
redundancy number of interfaces
10
6
105 104 103 102 101 100 10 0
5
10
15
20
25 hop
30
35
all
6
10
6
10
5
10
5
10
4
10
4
10
3
10
3
10
2
10
2
10
1
10
1 0
10
0
10
redundancy
10
all 6
105 104 103 102 101 100 10 0
5
10
15
20
25 hop
30
35
all
0
6
10
5
10
4
10
4
10
3
10
3
2
10
2
10
10
1
10
1
10
0
10
0
redundancy
10
5
all 6
105 104 103 102 101 100 10 15
20
25 hop
30
35
20
25 hop
30
35
all
all
6
10
15
6
10
5
10
105 104 103 102 101 100 10
10
0
5
5
10
15
20
25 hop
30
35
all
(d) g-root Doubletree (p = 0.05)
number of interfaces
redundancy
(c) g-root classic
number of interfaces
0
(b) f-root Doubletree (p = 0.05)
number of interfaces
number of interfaces
redundancy
(a) f-root classic
all 6
105 104 103 102 101 100 10
all
(e) iad classic
all 6
105 104 103 102 101 100 10 0
5
10
15
20
25 hop
30
35
all
(f) iad Doubletree (p = 0.05)
Figure 15: f-root, g-root, and iad
20
10
6
5
10
5
10
4
10
4
10
3
10
3
10
2
10
2
10
1
10
1 0
10
0
10
redundancy
6
10
all
number of interfaces
redundancy number of interfaces
10
6
105 104 103 102 101 100 10 0
5
10
15
20
25 hop
30
35
all
6
10
6
10
5
10
5
10
4
10
4
10
3
10
3
10
2
10
2
10
1
10
1 0
10
0
10
redundancy
10
all 6
105 104 103 102 101 100 10 0
5
10
15
20
25 hop
30
35
all
0
6
10
5
10
4
10
4
10
3
10
3
2
10
2
10
10
1
10
1
10
0
10
0
redundancy
10
5
all 6
105 104 103 102 101 100 10 15
20
25 hop
30
20
25 hop
30
35
all
all
6
10
15
6
10
5
10
105 104 103 102 101 100 10
10
0
5
35
5
10
15
20
25 hop
30
35
all
(d) k-peer Doubletree (p = 0.05)
number of interfaces
redundancy
(c) k-peer classic
number of interfaces
0
(b) ihug Doubletree (p = 0.05)
number of interfaces
number of interfaces
redundancy
(a) ihug classic
all 6
105 104 103 102 101 100 10
all
(e) lhr classic
all 6
105 104 103 102 101 100 10 0
5
10
15
20
25 hop
30
35
all
(f) lhr Doubletree (p = 0.05)
Figure 16: ihug, k-peer, and lhr
21
10
6
5
10
5
10
4
10
4
10
3
10
3
10
2
10
2
10
1
10
1 0
10
0
10
redundancy
6
10
all
number of interfaces
redundancy number of interfaces
10
6
105 104 103 102 101 100 10 0
5
10
15
20
25 hop
30
35
all
6
10
6
10
5
10
5
10
4
10
4
10
3
10
3
10
2
10
2
10
1
10
1
10
0
10
0
redundancy
10
all 6
105 104 103 102 101 100 10 0
5
10
15
20
25 hop
30
35
all
0
6
10
10
5
10
4
10
4
10
3
10
3
2
10
2
10
10
1
10
1
10
0
10
0
redundancy
10
all 6
105 104 103 102 101 100 10 15
20
25 hop
30
20
25 hop
30
35
all
all
5
10
15
6
6
5
10
105 104 103 102 101 100 10
10
0
5
5
10
15
20
25 hop
30
35
all
(d) mwest Doubletree (p = 0.05)
number of interfaces
redundancy
(c) mwest classic
number of interfaces
0
(b) m-root Doubletree (p = 0.05)
number of interfaces
number of interfaces
redundancy
(a) m-root classic
all 6
105 104 103 102 101 100 10
35
all
(e) nrt classic
all 6
105 104 103 102 101 100 10 0
5
10
15
20
25 hop
30
35
all
(f) nrt Doubletree (p = 0.05)
Figure 17: m-root, mwest, and nrt
22
10
6
10
5
10
5
10
4
10
4
10
3
10
3
10
2
10
2 1
10
1
10
0
10
0
number of interfaces
10
redundancy
6
all
number of interfaces
redundancy
10
6
105 104 103 102 101 100 10 0
5
10
15
20
25 hop
30
35
all
6
10
6
10
5
10
5
10
4
10
4
10
3
10
3
2
10
2
10
10
1
10
1
10
0
10
0
redundancy
10
all 6
105 104 103 102 101 100 10 0
5
10
15
20
25 hop
30
35
all
0
6
10
10
5
10
4
10
4
10
3
10
3
2
10
2
10
1 0
redundancy
10
10
1
10
10
0
10 all
6
105 104 103 102 101 100 10 15
20
25 hop
30
20
25 hop
30
35
all
all
5
10
15
6
6
5
10
105 104 103 102 101 100 10
10
0
5
5
10
15
20
25 hop
30
35
all
(d) sjc Doubletree (p = 0.05)
number of interfaces
redundancy
(c) sjc classic
number of interfaces
0
(b) riesling Doubletree (p = 0.05)
number of interfaces
number of interfaces
redundancy
(a) riesling classic
all 6
105 104 103 102 101 100 10
35
all
(e) yto classic
all 6
105 104 103 102 101 100 10 0
5
10
15
20
25 hop
30
35
all
(f) yto Doubletree (p = 0.05)
Figure 18: riesling, sjc, and yto
23