I would like to thank Dan Meiron for advising me on this research and the writing of this thesis and Michael Aivazis for assisting me with the implementation of the ...
Efficient Algorithms for Solving Static Hamilton-Jacobi Equations
Thesis by
Sean Mauch In Partial Fulfillment of the Requirements for the Degree of Doctor of Philosophy
California Institute of Technology Pasadena, California
2003 (Defended April 23, 2003)
ii
c 2003
Sean Mauch All Rights Reserved
iii
Acknowledgements I would like to thank Dan Meiron for advising me on this research and the writing of this thesis and Michael Aivazis for assisting me with the implementation of the algorithms. Support for this work was provided by the Accelerated Strategic Computing Initiative under subcontract number B341492 of DOE contract W-7405-ENG-48.
iv
Abstract Consider the eikonal equation, |∇u| = 1. If the initial condition is u = 0 on a manifold, then the solution u is the distance to the manifold. We present a new algorithm for solving this problem. More precisely, we present an algorithm for computing the closest point transform to an explicitly described manifold on a rectilinear grid in low dimensional spaces. The closest point transform finds the closest point on a manifold and the Euclidean distance to a manifold for all the points in a grid (or the grid points within a specified distance of the manifold). We consider manifolds composed of simple geometric shapes, such as, a set of points, piecewise linear curves or triangle meshes. The algorithm computes the closest point on and distance to the manifold by solving the eikonal equation |∇u| = 1 by the method of characteristics. The method of characteristics is implemented efficiently with the aid of computational geometry and polygon/polyhedron scan conversion. Thus the method is named the characteristic/scan conversion algorithm. The computed distance is accurate to within machine precision. The computational complexity of the algorithm is linear in both the number of grid points and the complexity of the manifold. Thus it has optimal computational complexity. The algorithm is easily adapted to shared-memory and distributed-memory concurrent algorithms. Many query problems can be aided by using orthogonal range queries (ORQ). Given a set of points in k-dimensional space, an ORQ returns the points inside a specified axis aligned range. There are several standard data structures for performing ORQ’s, including kd-trees, quadtrees, and cell arrays. We develop additional data structures based on cell arrays. We study the characteristics of each data structure and compare their performance. For many applications using ORQ’s, multiple queries
v are performed; the number of queries is on the order of the number of points. We develop a data structure that for many problems has linear computational complexity in the number of returned points and linear storage requirements in the number of points and the number of queries. We present a new algorithm for solving the single-source, non-negative weight, shortest path problem. Dijkstra’s algorithm solves this problem with computational complexity O((E + V ) log V ) where E is the number of edges and V is the number of vertices. The new algorithm is similar to Dijkstra’s algorithm in that vertices with known distances from the source are used to update unknown adjacent neighbors. It is different in that the set of these labeled adjacent neighbors is not stored in a priority queue. Instead of selecting a single vertex from the queue to become known at each iteration, the algorithm tries to freeze the value of many of the labeled vertices. This approach is called Marching with a Correctness Criterion (MCC). The algorithm has computational complexity O(E + RV ), where R is the ratio of the largest to smallest edge weight. We compare the performance of Dijkstra’s algorithm and the MCC algorithm. We indicate how to reduce the computational complexity to O(E + V + D/A) for the case that R is finite by using a cell array to store the labeled vertices. Here the D/A term represents the cost of accessing cells where D is the largest distance in the shortest path tree and A is the smallest edge weight. Sethian’s Fast Marching Method (FMM) may be used to solve static HamiltonJacobi equations. It has computational complexity O(N log N ), where N is the number of grid points. The fast marching method has been regarded as an optimal algorithm because it is closely related to Dijkstra’s algorithm for solving the singlesource shortest path problem on a directed graph. The new shortest path algorithm discussed above can be used to develop an ordered, upwind, finite difference algorithm for solving static Hamilton-Jacobi equations. This Marching with a Correctness Criterion algorithm requires difference schemes that difference not only in coordinate directions, but in diagonal directions as well. We compare the performance of these adjacent-diagonal difference schemes with the standard ones. With a suitable difference scheme, the MCC algorithm produces the same solution as the Fast Marching
vi Method. It has computational complexity O(RN ), where R is the ratio of the largest to smallest propagation speed and N is the number of grid points. We compare the performance of the FMM and the MCC algorithm. For all except pathological cases, we indicate how to reduce the computational complexity to O(N ) by using a cell array to store the labeled grid points. The MCC algorithm is easily adapted to efficient concurrent algorithms for both shared-memory and distributed-memory architectures.
vii
Contents Acknowledgements
iii
Abstract
iv
1 Introduction 1.1
1
Analytical Methods . . . . . . . . . . . . . . . . . . . . . . . . . . . .
1
1.1.1
Notation . . . . . . . . . . . . . . . . . . . . . . . . . . . . . .
1
1.1.2
Method of Characteristics . . . . . . . . . . . . . . . . . . . .
2
1.1.3
Viscosity Solutions . . . . . . . . . . . . . . . . . . . . . . . .
4
1.1.3.1
A Motivating Example . . . . . . . . . . . . . . . . .
4
1.1.3.2
The General Case . . . . . . . . . . . . . . . . . . .
7
1.1.3.3
An Example in 2-D . . . . . . . . . . . . . . . . . . .
8
1.2
Numerical Methods . . . . . . . . . . . . . . . . . . . . . . . . . . . .
10
1.3
Applications . . . . . . . . . . . . . . . . . . . . . . . . . . . . . . . .
11
1.3.1
Wave Fronts in the Wave Equation: The Eikonal Equation . .
11
1.3.2
Computational Geometry . . . . . . . . . . . . . . . . . . . .
13
1.3.3
Optimal Path Planning . . . . . . . . . . . . . . . . . . . . . .
15
Overview . . . . . . . . . . . . . . . . . . . . . . . . . . . . . . . . . .
16
1.4
2 Closest Point Transform
18
2.1
Introduction . . . . . . . . . . . . . . . . . . . . . . . . . . . . . . . .
18
2.2
Applications . . . . . . . . . . . . . . . . . . . . . . . . . . . . . . . .
20
2.3
Previous Work
. . . . . . . . . . . . . . . . . . . . . . . . . . . . . .
22
2.4
Scan Conversion and Voronoi Diagrams . . . . . . . . . . . . . . . . .
25
viii 2.5
2.6
2.7
2.8
An Improved CPT Algorithm . . . . . . . . . . . . . . . . . . . . . .
29
2.5.1
The CPT for Piecewise Linear Curves . . . . . . . . . . . . . .
29
2.5.2
Triangle Mesh Surface . . . . . . . . . . . . . . . . . . . . . .
33
2.5.3
The General Algorithm . . . . . . . . . . . . . . . . . . . . . .
36
2.5.4
Concurrent Algorithm . . . . . . . . . . . . . . . . . . . . . .
36
2.5.5
Characteristic Polygons/Polyhedra versus Voronoi Diagrams .
37
Performance of the CPT Algorithm . . . . . . . . . . . . . . . . . . .
38
2.6.1
Execution Time . . . . . . . . . . . . . . . . . . . . . . . . . .
38
2.6.2
Storage Requirements
. . . . . . . . . . . . . . . . . . . . . .
40
2.6.3
Comparison with Other Methods . . . . . . . . . . . . . . . .
40
2.6.3.1
Finite Difference Methods . . . . . . . . . . . . . . .
40
2.6.3.2
LUB-Tree Methods . . . . . . . . . . . . . . . . . . .
42
Extending the CSC Algorithm to Solving Static Hamilton-Jacobi Equations . . . . . . . . . . . . . . . . . . . . . . . . . . . . . . . . . . . .
43
Conclusions . . . . . . . . . . . . . . . . . . . . . . . . . . . . . . . .
44
3 Orthogonal Range Queries 3.1
3.2
3.3
45
Introduction . . . . . . . . . . . . . . . . . . . . . . . . . . . . . . . .
45
3.1.1
Example Application: CPT on an Irregular Mesh . . . . . . .
46
3.1.2
Example Application: Contact Detection . . . . . . . . . . . .
47
Range Queries . . . . . . . . . . . . . . . . . . . . . . . . . . . . . . .
49
3.2.1
Sequential Scan . . . . . . . . . . . . . . . . . . . . . . . . . .
50
3.2.2
Binary Search on Sorted Data . . . . . . . . . . . . . . . . . .
50
3.2.3
Trees . . . . . . . . . . . . . . . . . . . . . . . . . . . . . . . .
52
3.2.4
Cells or Bucketing . . . . . . . . . . . . . . . . . . . . . . . .
56
Orthogonal Range Queries . . . . . . . . . . . . . . . . . . . . . . . .
58
3.3.1
Test Problems . . . . . . . . . . . . . . . . . . . . . . . . . . .
58
3.3.1.1
Chair . . . . . . . . . . . . . . . . . . . . . . . . . .
58
3.3.1.2
Random Points . . . . . . . . . . . . . . . . . . . . .
58
Sequential Scan . . . . . . . . . . . . . . . . . . . . . . . . . .
60
3.3.2
ix
3.4
3.3.3
Projection . . . . . . . . . . . . . . . . . . . . . . . . . . . . .
60
3.3.4
Point-in-Box Method . . . . . . . . . . . . . . . . . . . . . . .
62
3.3.5
Kd-Trees . . . . . . . . . . . . . . . . . . . . . . . . . . . . . .
64
3.3.6
Quadtrees and Octrees . . . . . . . . . . . . . . . . . . . . . .
70
3.3.7
Cells . . . . . . . . . . . . . . . . . . . . . . . . . . . . . . . .
71
3.3.8
Sparse Cells . . . . . . . . . . . . . . . . . . . . . . . . . . . .
76
3.3.9
Cells Coupled with a Binary Search . . . . . . . . . . . . . . .
80
Performance Tests over a Range of Query Sizes . . . . . . . . . . . .
85
3.4.1
Randomly Distributed Points in a Cube . . . . . . . . . . . .
85
3.4.1.1
Sequential Scan . . . . . . . . . . . . . . . . . . . . .
85
3.4.1.2
Projection Methods . . . . . . . . . . . . . . . . . .
86
3.4.1.3
Tree Methods . . . . . . . . . . . . . . . . . . . . . .
87
3.4.1.4
Cell Methods . . . . . . . . . . . . . . . . . . . . . .
90
3.4.1.5
Comparison . . . . . . . . . . . . . . . . . . . . . . .
90
Randomly Distributed Points on a Sphere . . . . . . . . . . .
97
3.4.2.1
Sequential Scan . . . . . . . . . . . . . . . . . . . . .
97
3.4.2.2
Projection Methods . . . . . . . . . . . . . . . . . .
97
3.4.2.3
Tree Methods . . . . . . . . . . . . . . . . . . . . . .
97
3.4.2.4
Cell Methods . . . . . . . . . . . . . . . . . . . . . . 100
3.4.2.5
Comparison . . . . . . . . . . . . . . . . . . . . . . . 108
3.4.2
3.5
3.6
Multiple Range Queries . . . . . . . . . . . . . . . . . . . . . . . . . . 108 3.5.1
Single versus Multiple Queries . . . . . . . . . . . . . . . . . . 108
3.5.2
Sorted Key and Sorted Ranges with Forward Searching . . . . 111
Multiple Orthogonal Range Queries . . . . . . . . . . . . . . . . . . . 113 3.6.1
Cells Coupled with Forward Searching . . . . . . . . . . . . . 113
3.6.2
Storing the Keys . . . . . . . . . . . . . . . . . . . . . . . . . 118
3.7
Computational Complexity Comparison . . . . . . . . . . . . . . . . . 119
3.8
Performance Tests for Multiple Queries over a Range of File Sizes . . 122 3.8.1
Points on the Surface of a Chair . . . . . . . . . . . . . . . . . 122
3.8.2
Randomly Distributed Points in a Cube . . . . . . . . . . . . 125
x 3.9
Conclusions . . . . . . . . . . . . . . . . . . . . . . . . . . . . . . . . 128 3.9.1
Projection Methods . . . . . . . . . . . . . . . . . . . . . . . . 129
3.9.2
Tree Methods . . . . . . . . . . . . . . . . . . . . . . . . . . . 129
3.9.3
Cell Methods . . . . . . . . . . . . . . . . . . . . . . . . . . . 130
3.9.4
Multiple Queries . . . . . . . . . . . . . . . . . . . . . . . . . 131
4 Single-Source Shortest Paths 4.1
132
Introduction . . . . . . . . . . . . . . . . . . . . . . . . . . . . . . . . 132 4.1.1
Test Problems . . . . . . . . . . . . . . . . . . . . . . . . . . . 135
4.2
Dijkstra’s Greedy Algorithm . . . . . . . . . . . . . . . . . . . . . . . 136
4.3
A Greedier Algorithm: Marching with a Correctness Criterion . . . . 140
4.4
Computational Complexity . . . . . . . . . . . . . . . . . . . . . . . . 155
4.5
Performance Comparison . . . . . . . . . . . . . . . . . . . . . . . . . 156
4.6
Concurrency . . . . . . . . . . . . . . . . . . . . . . . . . . . . . . . . 162
4.7
Future Work . . . . . . . . . . . . . . . . . . . . . . . . . . . . . . . . 163
4.8
4.7.1
A More Sophisticated Data Structure for the Labeled Set . . . 163
4.7.2
Re-weighting the Edges . . . . . . . . . . . . . . . . . . . . . . 165
Conclusions . . . . . . . . . . . . . . . . . . . . . . . . . . . . . . . . 166
5 Static Hamilton-Jacobi Equations
167
5.1
Introduction . . . . . . . . . . . . . . . . . . . . . . . . . . . . . . . . 167
5.2
Upwind Finite Difference Schemes . . . . . . . . . . . . . . . . . . . . 167
5.3
The Fast Marching Method . . . . . . . . . . . . . . . . . . . . . . . 169 5.3.1
The Status Array . . . . . . . . . . . . . . . . . . . . . . . . . 174
5.4
Applying the Marching with a Correctness Criterion Method . . . . . 176
5.5
Adjacent-Diagonal Difference Schemes . . . . . . . . . . . . . . . . . 182
5.6
Computational Complexity . . . . . . . . . . . . . . . . . . . . . . . . 188
5.7
Performance Comparison of the Finite Difference Schemes with the FMM189 5.7.1
Test Problems . . . . . . . . . . . . . . . . . . . . . . . . . . . 189
5.7.2
Convergence . . . . . . . . . . . . . . . . . . . . . . . . . . . . 193 5.7.2.1
Smooth Solution . . . . . . . . . . . . . . . . . . . . 193
xi
5.7.3 5.8
5.9
5.7.2.2
Solution with High Curvature . . . . . . . . . . . . . 196
5.7.2.3
Solution with Shocks . . . . . . . . . . . . . . . . . . 196
Execution Time . . . . . . . . . . . . . . . . . . . . . . . . . . 202
Performance Comparison of the FMM and the MCC Algorithm . . . 203 5.8.1
Memory Usage . . . . . . . . . . . . . . . . . . . . . . . . . . 203
5.8.2
Execution Time . . . . . . . . . . . . . . . . . . . . . . . . . . 204
Extension to 3-D . . . . . . . . . . . . . . . . . . . . . . . . . . . . . 207 5.9.1
Adjacent-Diagonal Difference Schemes . . . . . . . . . . . . . 207
5.9.2
Performance Comparison of the Finite Difference Schemes . . 212
5.9.3
5.9.2.1
Test Problems . . . . . . . . . . . . . . . . . . . . . 212
5.9.2.2
Convergence
5.9.2.3
Execution Time . . . . . . . . . . . . . . . . . . . . . 217
. . . . . . . . . . . . . . . . . . . . . . 213
The FMM versus the MCC Algorithm . . . . . . . . . . . . . 218
5.10 Concurrent Algorithm . . . . . . . . . . . . . . . . . . . . . . . . . . 219 5.11 Future Work . . . . . . . . . . . . . . . . . . . . . . . . . . . . . . . . 221 5.12 Conclusions . . . . . . . . . . . . . . . . . . . . . . . . . . . . . . . . 223 6 Future Work
225
6.1
Greedier Algorithms . . . . . . . . . . . . . . . . . . . . . . . . . . . 225
6.2
Minimum Spanning Trees . . . . . . . . . . . . . . . . . . . . . . . . 226
6.3
6.2.1
Kruskal’s Algorithm . . . . . . . . . . . . . . . . . . . . . . . 226
6.2.2
Prim’s Algorithm . . . . . . . . . . . . . . . . . . . . . . . . . 227
6.2.3
A Greedier Algorithm . . . . . . . . . . . . . . . . . . . . . . 228
Adjacent-Diagonal Difference Schemes . . . . . . . . . . . . . . . . . 231
Bibliography
232
xii
List of Figures 1.1
Three weak solutions of |u0 | = 1, u(−1) = u(1) = 0. . . . . . . . . . . .
1.2
Solutions of −�u00� + |u0� | = 1, u� (−1) = u� (1) = 0 for � = 1/10, 1/20, 1/40 and the viscosity solution as � → 0. . . . . . . . . . . . . . . . . . . . .
1.3
5
6
The multi-valued solution obtained with the method of characteristics and the viscosity solution obtained by taking the minimum of the multivalued solutions. . . . . . . . . . . . . . . . . . . . . . . . . . . . . . .
1.4
6
A polygonal domain on which to solve the eikonal equation to determine the distance from the boundary. . . . . . . . . . . . . . . . . . . . . . .
9
1.5
The method of characteristics solution from each side of the polygon. .
9
1.6
The left figure shows the multi-valued solution determined with the method of characteristics. The right figure shows the viscosity solution obtained by taking the minimum of the multi-valued solutions. . . . . .
10
2.1
A triangle mesh, its distance transform and its closest point transform.
20
2.2
A LUB-tree for an eight-sided polygon. We show each level in the tree. The diagram along the bottom shows the branching structure. The data structure stores a bounding box around each branch. The leaves of the tree are the line segments. . . . . . . . . . . . . . . . . . . . . . . . . .
2.3
24
The left figure depicts scan conversion of a polygon in 2-D. The right figure shows slicing a polyhedron to form polygons. . . . . . . . . . . .
26
2.4
Unbounded and bounded Voronoi diagrams. . . . . . . . . . . . . . . .
27
2.5
Computing the closest point transform on a regular grid to a set of points. 28
xiii 2.6
The left figure shows a polygon in thick lines. The strips contain the points which have positive distance to the edges of the polygon. We depict a point x and its closest point on the curve, ξ. The right figure shows the strips containing points which have negative distance to the edges. . . . . . . . . . . . . . . . . . . . . . . . . . . . . . . . . . . . .
2.7
30
The left figure shows a polygon in thick lines. The wedges contain the points which have positive distance to the vertices of the polygon. We depict a point x and its closest point on the curve, ξ. The right figure shows the wedges containing points which have negative distance to the vertices. . . . . . . . . . . . . . . . . . . . . . . . . . . . . . . . . . . .
2.8
30
The left figure shows a piecewise linear curve and the polygon containing points within a distance d of a vertex. The right figure shows a portion of a piecewise linear curve and the polygons containing points of positive and negative distance which are within a distance d of an edge. . . . .
2.9
31
(a) The positive polyhedra for the faces. (b) The polyhedra for the edges. (c) The polyhedron for a single edge. (d) The polyhedra for the vertices. . . . . . . . . . . . . . . . . . . . . . . . . . . . . . . . . . . .
2.10
34
The left graph shows a log-log plot of execution time versus grid size for grids varying in size from 103 to 2003 . Next we show the scaled execution time per grid point for grids varying in size from 203 to 2003 .
2.11
39
The left graph shows a log-log plot of execution time versus the number of faces for meshes varying in size from 8 to 131072 faces. Next we show the scaled execution time per face for meshes varying in size from 32 to 131072. . . . . . . . . . . . . . . . . . . . . . . . . . . . . . . . . . . .
40
2.12
Comparison of execution times (sec) for computing the distance transform. 42
2.13
Two views of the characteristics used in the CSC algorithm applied to an anisotropic eikonal equation. Note the intersection of characteristics
3.1
and the adding of new characteristics. . . . . . . . . . . . . . . . . . .
43
An orthogonal range query for cities. . . . . . . . . . . . . . . . . . . .
46
xiv 3.2
Contact search for a face. The orthogonal range query returns the nodes in the capture box. . . . . . . . . . . . . . . . . . . . . . . . . . . . . .
3.3
48
The contact check for a single contact surface and node. The node penetrates the face. . . . . . . . . . . . . . . . . . . . . . . . . . . . . .
48
3.4
Points in the surface mesh of a chair. 7200 points. . . . . . . . . . . . .
59
3.5
The projection method. The query range is the intersection of the three slices. . . . . . . . . . . . . . . . . . . . . . . . . . . . . . . . . . . . .
61
3.6
A kd-tree in 2-D. . . . . . . . . . . . . . . . . . . . . . . . . . . . . . .
65
3.7
The effect of leaf size on the performance of the kd-tree for the chair problem and the random points problem. . . . . . . . . . . . . . . . . .
3.8
69
The best leaf size as a function of records per query for the kd-tree for the random points problem. The second plot shows the ratio of the number of records per query and the leaf size. . . . . . . . . . . . . . .
70
3.9
A quadtree in 2-D. . . . . . . . . . . . . . . . . . . . . . . . . . . . . .
71
3.10
The effect of leaf size on the performance of the octree for the chair problem and the random points problem. . . . . . . . . . . . . . . . . .
3.11
72
The best leaf size as a function of records per query for the octree for the random points problem. The second plot shows the ratio of the number of records per query and the leaf size. . . . . . . . . . . . . . . . . . . .
3.12
72
First we depict a 2-D cell array. The 8 × 8 array of cells contains records depicted as points. Next we show an orthogonal range query. The query range is shown as a rectangle with thick lines. There are eight boundary cells and one interior cell. . . . . . . . . . . . . . . . . . . . . . . . . .
3.13
The effect of leaf size on the performance of the cell array for the chair problem and the random points problem. . . . . . . . . . . . . . . . . .
3.14
73
75
The first plot shows the best cell size versus the query range size for the cell array on the random points problem. Next we show this data as the ratio of the cell size to the query range size. Finally we plot the average number of records in a cell versus the average number of records returned by an orthogonal range query as a ratio. . . . . . . . . . . . .
76
xv 3.15
A sparse cell array in 2-D. The array is sparse in the x coordinate. Only the non-empty cells are stored. . . . . . . . . . . . . . . . . . . . . . .
3.16
77
The effect of leaf size on the performance of the sparse cell array for the chair problem. The first plot shows the execution time in seconds versus R. The second plot shows the memory usage in megabytes versus R. The performance of the dense cell array is shown for comparison. . . .
3.17
79
The effect of leaf size on the performance of the sparse cell array for the random points problem. The first plot shows the execution time in seconds versus R. The second plot shows the memory usage in megabytes versus R. The performance of the dense cell array is shown for comparison. 79
3.18
The first plot shows the best cell size versus the query range size for the sparse cell array on the random points problem. Next we show this data as the ratio of the cell size to the query range size. Finally we plot the average number of records in a cell versus the average number of records returned by an orthogonal range query as a ratio. . . . . . . . . . . . .
3.19
80
First we depict a cell array with binary search in 2-D. There are 8 cells which contain records sorted in the x direction. Next we show an orthogonal range query. The query range is shown as a rectangle with thick lines. There are three overlapping cells. . . . . . . . . . . . . . .
3.20
81
The effect of leaf size on the performance of the cell array coupled with binary searches for the chair problem. The first plot shows the execution time in seconds versus R. The second plot shows the memory usage in megabytes versus R. The performance of the sparse cell array is shown for comparison. . . . . . . . . . . . . . . . . . . . . . . . . . . . . . . .
3.21
84
The effect of leaf size on the performance of the cell array coupled with binary searches for the random points problem. The first plot shows the execution time in seconds versus R. The second plot shows the memory usage in megabytes versus R. The performance of the sparse cell array is shown for comparison. . . . . . . . . . . . . . . . . . . . . . . . . . .
84
xvi 3.22
The first plot shows the best cell size versus the query range size for the cell array coupled with binary searches on the random points problem. Next we show this data as the ratio of the cell size to the query range size. 85
3.23
Log-log plot of the average number of records in the query versus the query size for the randomly distributed points in a cube problem. . . .
3.24
Log-log plot of execution time versus query size for the sequential scan method with the randomly distributed points in a cube problem. . . .
3.25
86
86
Log-log plot of execution time versus query size for the projection method and the point-in-box method with the randomly distributed points in a cube problem. The performance of the sequential scan method is shown for comparison. . . . . . . . . . . . . . . . . . . . . . . . . . . . . . . .
3.26
87
Log-log plot of execution time versus query size for the kd-tree without domain checking on the randomly distributed points in a cube problem. The key shows the leaf size. The performance of the sequential scan method is shown for comparison. The second plot shows the execution time per reported record. . . . . . . . . . . . . . . . . . . . . . . . . .
3.27
88
Log-log plot of execution time versus query size for the kd-tree with domain checking on the randomly distributed points in a cube problem. The key shows the leaf size. The performance of the sequential scan method is shown for comparison. The second plot shows the execution time per reported record. . . . . . . . . . . . . . . . . . . . . . . . . .
3.28
89
Log-log plot of execution time versus query size for the octree on the randomly distributed points in a cube problem. The key shows the leaf size. The performance of the sequential scan method is shown for comparison. The second plot shows the execution time per reported record. . . . . . . . . . . . . . . . . . . . . . . . . . . . . . . . . . . . .
91
xvii 3.29
Log-log plot of execution time versus query size for the tree methods on the randomly distributed points in a cube problem. The key indicates the data structure. We show the kd-tree with a leaf size of 8, the kdtree with domain checking with a leaf size of 8 and the octree with a leaf size of 16. The performance of the sequential scan method is shown for comparison. The second plot shows the execution time per reported record. . . . . . . . . . . . . . . . . . . . . . . . . . . . . . . . . . . . .
3.30
92
Log-log plot of execution time versus query size for the cell array on the randomly distributed points in a cube problem. The key shows the cell size. The performance of the sequential scan method is shown for comparison. The second plot shows the execution time per reported record. . . . . . . . . . . . . . . . . . . . . . . . . . . . . . . . . . . . .
3.31
93
Log-log plot of execution time versus query size for the sparse cell array on the randomly distributed points in a cube problem. The key shows the cell size. The performance of the sequential scan method is shown for comparison. The second plot shows the execution time per reported record. . . . . . . . . . . . . . . . . . . . . . . . . . . . . . . . . . . . .
3.32
94
Log-log plot of execution time versus query size for the cell array with binary searching on the randomly distributed points in a cube problem. The key shows the cell size. The performance of the sequential scan method is shown for comparison. The second plot shows the execution time per reported record. . . . . . . . . . . . . . . . . . . . . . . . . .
3.33
95
Log-log plot of execution time versus query size for the cell methods on the randomly distributed points in a cube problem. The key indicates the data structure. We show the dense cell array with a cell size of 0.02, the sparse cell array with a cell size of 0.02 and the cell array with binary searching with a cell size of 0.01414. The performance of the sequential scan method is shown for comparison. The second plot shows the execution time per reported record. . . . . . . . . . . . . . . . . . .
96
xviii 3.34
Log-log plot of execution time versus query size for the orthogonal range query methods on the randomly distributed points in a cube problem. The key indicates the data structure. We show the sequential scan method, the projection method, the kd-tree with a leaf size of 8, the kd-tree with domain checking with a leaf size of 8 and the cell array with a cell size of 0.02. The second plot shows the execution time per reported record. . . . . . . . . . . . . . . . . . . . . . . . . . . . . . . .
3.35
Log-log plot of the average number of records in the query versus the query size for the randomly distributed points on a sphere problem. . .
3.36
99
Log-log plot of execution time versus query size for the sequential scan method on the randomly distributed points on a sphere problem. . . .
3.37
98
99
Log-log plot of execution time versus query size for the projection method and the point-in-box method on the randomly distributed points on a sphere problem. The performance of the sequential scan method is shown for comparison. . . . . . . . . . . . . . . . . . . . . . . . . . . . 100
3.38
Log-log plot of execution time versus query size for the kd-tree without domain checking data structure on the randomly distributed points on a sphere problem. The key shows the leaf size. The performance of the sequential scan method is shown for comparison. The second plot shows the execution time per reported record. . . . . . . . . . . . . . . . . . . 101
3.39
Log-log plot of execution time versus query size for the kd-tree with domain checking data structure on the randomly distributed points on a sphere problem. The key shows the leaf size. The performance of the sequential scan method is shown for comparison. The second plot shows the execution time per reported record. . . . . . . . . . . . . . . . . . . 102
3.40
Log-log plot of execution time versus query size for the octree data structure on the randomly distributed points on a sphere problem. The key shows the leaf size. The performance of the sequential scan method is shown for comparison. The second plot shows the execution time per reported record. . . . . . . . . . . . . . . . . . . . . . . . . . . . . . . . 103
xix 3.41
Log-log plot of execution time versus query size for the tree methods on the randomly distributed points on a sphere problem. The key indicates the data structure. We show the kd-tree with a leaf size of 8, the kd-tree with domain checking with a leaf size of 16 and the octree with a leaf size of 16. The performance of the sequential scan method is shown for comparison. The second plot shows the execution time per reported record. . . . . . . . . . . . . . . . . . . . . . . . . . . . . . . . . . . . . 104
3.42
Log-log plot of execution time versus query size for the cell array data structure on the randomly distributed points on a sphere problem. The key shows the cell size. The performance of the sequential scan method is shown for comparison. The second plot shows the execution time per reported record. . . . . . . . . . . . . . . . . . . . . . . . . . . . . . . . 105
3.43
Log-log plot of execution time versus query size for the sparse cell array data structure on the randomly distributed points on a sphere problem. The key shows the cell size. The performance of the sequential scan method is shown for comparison. The second plot shows the execution time per reported record. . . . . . . . . . . . . . . . . . . . . . . . . . 106
3.44
Log-log plot of execution time versus query size for the cell array with binary searching data structure on the randomly distributed points on a sphere problem. The key shows the cell size. The performance of the sequential scan method is shown for comparison. The second plot shows the execution time per reported record. . . . . . . . . . . . . . . . . . . 107
3.45
Log-log plot of execution time versus query size for the cell methods on the randomly distributed points on a sphere problem. The key indicates the data structure. We show the dense cell array, the sparse cell array and the cell array with binary searching, each with a cell size of 0.02. The performance of the sequential scan method is shown for comparison. The second plot shows the execution time per reported record. . . . . . 109
xx 3.46
Log-log plot of execution time versus query size for the orthogonal range query methods on the randomly distributed points on a sphere problem. The key indicates the data structure. We show the sequential scan method, the projection method, the kd-tree with a leaf size of 8, the kd-tree with domain checking with a leaf size of 16, the cell array with a cell size of 0.02 and the cell array with binary searching with a cell size of 0.02. The second plot shows the execution time per reported record.
3.47
110
The effect of leaf size on the performance of the cell array coupled with forward searches for the chair problem. The first plot shows the execution time in seconds versus R. The second plot shows the memory usage in megabytes versus R. The performance of the cell array coupled with binary searches is shown for comparison. . . . . . . . . . . . . . . . . . 117
3.48
The effect of leaf size on the performance of the cell array coupled with forward searches for the random points problem. The first plot shows the execution time in seconds versus R. The second plot shows the memory usage in megabytes versus R. The performance of the cell array coupled with binary searches is shown for comparison. . . . . . . . . . . . . . . 117
3.49
The first plot shows the best cell size versus the query range size for the cell array coupled with forward searches on the random points problem. Next we show this data as the ratio of the cell size to the query range size.118
3.50
The effect of leaf size on the performance of the cell array that stores keys and uses forward searches for the chair problem. The first plot shows the execution time in seconds versus R. The second plot shows the memory usage in megabytes versus R. The performance of the data structure that does not store the keys is shown for comparison. . . . . 119
3.51
The effect of leaf size on the performance of the cell array coupled with forward searches that stores the keys for the random points problem. The first plot shows the execution time in seconds versus R. The second plot shows the memory usage in megabytes versus R. The performance of the data structure that does not store the keys is shown for comparison.119
xxi 3.52
Log-log plots of the execution times versus the number of reported records and the memory usage versus the number of records in the file for each of the orthogonal range query methods on the chair problems. The execution time is shown in microseconds per returned record. The memory usage is shown in bytes per record. . . . . . . . . . . . . . . . 124
3.53
Log-log plots of the execution times versus the number of reported records and the memory usage versus the number of records in the file for each of the orthogonal range query methods on the random points problems. The execution time is shown in microseconds per returned record. The memory usage is shown in bytes per record. . . . . . . . . 127
4.1
Examples of the three test problems: A 3 × 3 grid graph, a complete graph with 5 vertices and a random graph with 5 vertices and 2 adjacent edges per vertex are shown. . . . . . . . . . . . . . . . . . . . . . . . . 135
4.2
Dijkstra’s algorithm for a graph with 9 vertices. . . . . . . . . . . . . . 138
4.3
Log-linear plots of the ratio of correctly determined vertices to labeled vertices versus the number of vertices in the graph. We show plots for a grid graph where each vertex has an edge to its four adjacent neighbors, a dense graph where each vertex has an edge to every other vertex, a graph where each vertex has edges to 4 randomly chosen vertices and finally a graph where each vertex has edges to 32 randomly chosen vertices. The tests are done for maximum-to-minimum edge weight ratios of 2, 10, 100 and ∞. . . . . . . . . . . . . . . . . . . . . . . . . . . . . . . . 142
4.4
Marching with a correctness criterion algorithm for a graph with 16 vertices. . . . . . . . . . . . . . . . . . . . . . . . . . . . . . . . . . . . 146
4.5
A depiction of the incident edges used in the level n correctness criterion for n = 0, . . . , 6. . . . . . . . . . . . . . . . . . . . . . . . . . . . . . . . 149
xxii 4.6
Log-linear plots of the ratio of correctly determined vertices to labeled vertices versus the number of vertices in the graph. The maximum-tominimum edge weight ratio is 2. The key shows the correctness criterion. We show levels 0 through 5. The ideal correctness criterion is shown for comparison. . . . . . . . . . . . . . . . . . . . . . . . . . . . . . . . . . 150
4.7
Log-linear plots of the ratio of correctly determined vertices to labeled vertices versus the number of vertices in the graph. The maximumto-minimum edge weight ratio is 10. The key shows the correctness criterion. We show levels 0 through 5. The ideal correctness criterion is shown for comparison. . . . . . . . . . . . . . . . . . . . . . . . . . . . 151
4.8
Log-linear plots of the ratio of correctly determined vertices to labeled vertices versus the number of vertices in the graph. The maximumto-minimum edge weight ratio is 100. The key shows the correctness criterion. We show levels 0 through 5. The ideal correctness criterion is shown for comparison. . . . . . . . . . . . . . . . . . . . . . . . . . . . 152
4.9
Log-linear plots of the ratio of correctly determined vertices to labeled vertices versus the number of vertices in the graph. The maximum-tominimum edge weight ratio is infinite. The key shows the correctness criterion. We show levels 0 through 5. The ideal correctness criterion is shown for comparison. . . . . . . . . . . . . . . . . . . . . . . . . . . . 153
4.10
Log-log plots of the execution time per vertex versus the number of vertices in the graph. The maximum-to-minimum edge weight ratio is 2. The key shows the method: Dijkstra, MCC level 1 or MCC level 3. . 157
4.11
Log-log plots of the execution time per vertex versus the number of vertices in the graph. The maximum-to-minimum edge weight ratio is 10. The key shows the method: Dijkstra, MCC level 1 or MCC level 3.
4.12
158
Log-log plots of the execution time per vertex versus the number of vertices in the graph. The maximum-to-minimum edge weight ratio is 100. The key shows the method: Dijkstra, MCC level 1 or MCC level 3. 159
xxiii 4.13
Log-log plots of the execution time per vertex versus the number of vertices in the graph. The maximum-to-minimum edge weight ratio is infinite. The key shows the method: Dijkstra, MCC level 1 or MCC level 3. . . . . . . . . . . . . . . . . . . . . . . . . . . . . . . . . . . . . 160
4.14
Two shortest-paths trees for a grid graph. . . . . . . . . . . . . . . . . 162
5.1
The three ways of labeling an adjacent neighbor using the first-order, adjacent difference scheme. . . . . . . . . . . . . . . . . . . . . . . . . 171
5.2
Log-log plots of the execution time per grid point versus the number of grid points for the fast marching method with and without a status array.176
5.3
The two test problems for exploring the Marching with a Correctness Criterion algorithm. In the left diagram, distance is computed from the (0, 0) grid point. In the right diagram, distance is computed from a line segment. . . . . . . . . . . . . . . . . . . . . . . . . . . . . . . . . . . . 178
5.4
Dependency diagrams for a 5-point, adjacent stencil. . . . . . . . . . . 179
5.5
Order diagrams for the 5-point, adjacent stencil. . . . . . . . . . . . . . 180
5.6
The 5-point, adjacent stencil and the 9-point, adjacent-diagonal stencil. 181
5.7
Dependency diagrams for the 9-point, adjacent-diagonal stencil. . . . . 181
5.8
Order diagrams for the 9-point, adjacent-diagonal stencil.
5.9
The three ways of labeling an adjacent neighbor and the three ways
. . . . . . . 182
of labeling a diagonal neighbor using the adjacent-diagonal, first-order difference scheme. 5.10
. . . . . . . . . . . . . . . . . . . . . . . . . . . . . 184
The direction of the characteristic is shown in blue. Upwind directions are shown in red; downwind directions are shown in green. . . . . . . . 185
5.11
The initial condition and the analytic solution on the grid. . . . . . . . 187
5.12
An adjacent-diagonal difference scheme that is upwind, but does not satisfy the CFL condition. . . . . . . . . . . . . . . . . . . . . . . . . . 187
5.13
An adjacent-diagonal difference scheme that satisfies the CFL condition. 188
xxiv 5.14
Test problem for a smooth solution. The top diagram depicts a 10 × 10 grid. The distance is computed from the point outside the grid depicted as a solid black disk. The red grid points show where the initial condition for first-order schemes is specified. The green grid points show the additional grid points where the initial condition is specified for second-order schemes. We show a plot of the smooth solution. . . . . . . . . . . . . 190
5.15
Test problem for a solution with high curvature. The diagram shows a 10 × 10 grid. The distance is computed from a point at the center of the grid. The red grid points show where the initial condition is specified for first-order and second-order schemes. Next we show a plot of the solution. . . . . . . . . . . . . . . . . . . . . . . . . . . . . . . . . . . . 191
5.16
Test problem for a solution with shocks. The diagram depicts a 10 × 10 grid. The distance is computed from the points on the unit circle. Lines show the locations of the shocks. The red grid points show where the initial condition for first-order schemes is specified. The green grid points show the additional grid points where the initial condition is specified for second-order schemes. Next we show a plot of the solution. . . . . . 192
5.17
Plots of the error for a smooth solution on a 40 × 40 grid. . . . . . . . 194
5.18
L1 and L∞ error for a smooth solution. Log-log plot of the error versus the grid spacing. . . . . . . . . . . . . . . . . . . . . . . . . . . . . . . 195
5.19
Plots of the error for a solution with high curvature on a 40 × 40 grid.
5.20
L1 and L∞ error for a solution with high curvature. Log-log plot of the
197
error versus the grid spacing. . . . . . . . . . . . . . . . . . . . . . . . 198 5.21
Plots of the error for a solution with shocks on a 40 × 40 grid. . . . . . 200
5.22
Log-log plot of the L1 and L∞ error versus the grid spacing for the solution with shocks. . . . . . . . . . . . . . . . . . . . . . . . . . . . . 201
5.23
Log-log plot of the execution time per grid point versus the number of grid points for the fast marching method with different stencils. . . . . 203
xxv 5.24
Log-linear plot of the execution time per grid point versus the number of grid points for the Fast Marching Method, the Marching with a Correctness Criterion algorithm and the ideal algorithm using a first-order, adjacent-diagonal scheme. . . . . . . . . . . . . . . . . . . . . . . . . . 205
5.25
Log-linear plot of the execution time per grid point versus the number of grid points for the Fast Marching Method, the Marching with a Correctness Criterion algorithm and the ideal algorithm using a second-order, adjacent-diagonal scheme. . . . . . . . . . . . . . . . . . . . . . . . . . 205
5.26
Log-log plot of the execution time versus the ratio of the maximum to minimum propagation speed in the eikonal equation. We compare the Fast Marching Method and the Marching with a Correctness Criterion algorithm using a first-order, adjacent-diagonal scheme. . . . . . . . . . 206
5.27
Log-log plot of the execution time versus the ratio of the maximum to minimum propagation speed in the eikonal equation. We compare the Fast Marching Method and the Marching with a Correctness Criterion algorithm using a second-order, adjacent-diagonal scheme. . . . . . . . 207
5.28
The 7-point, adjacent stencil and the 19-point, adjacent-diagonal stencil. 210
5.29
L1 and L∞ error for a smooth solution. Log-log plot of the error versus the grid spacing. . . . . . . . . . . . . . . . . . . . . . . . . . . . . . . 213
5.30
L1 and L∞ error for a solution with high curvature. Log-log plot of the error versus the grid spacing. . . . . . . . . . . . . . . . . . . . . . . . 215
5.31
L1 and L∞ error for a solution with shocks. Log-log plot of the error versus the grid spacing. . . . . . . . . . . . . . . . . . . . . . . . . . . 216
5.32
Log-log plot of the execution time per grid point versus the number of grid points for the fast marching method with different stencils. We show the algorithm with a first-order, adjacent scheme and a first-order, adjacent-diagonal scheme. . . . . . . . . . . . . . . . . . . . . . . . . . 217
xxvi 5.33
Log-log plot of the execution time per grid point versus the number of grid points for the fast marching algorithm, the marching with a correctness criterion algorithm and the ideal algorithm using the firstorder, adjacent-diagonal scheme. . . . . . . . . . . . . . . . . . . . . . 218
5.34
Left: A distribution of a 2-D grid over 16 processors. Each processor has one array. Right: A distribution that would better balance the load. Each processor has 9 arrays. . . . . . . . . . . . . . . . . . . . . . . . . 220
5.35
A pathological case in which a characteristic weaves through most of the grid points. We show a 9 × 9 grid. Green grid points have a high value of f while red grid points have a low value. If the initial condition were specified at the lower, left corner then there would be a characteristic roughly following the path of green grid points from the lower left corner to the upper right corner. . . . . . . . . . . . . . . . . . . . . . . . . . 223
xxvii
List of Tables 3.1
Labels and references for the orthogonal range query methods. . . . . . 120
3.2
Computational complexity and storage requirements for the orthogonal range query methods. . . . . . . . . . . . . . . . . . . . . . . . . . . . 120
3.3
The total number of records returned by the orthogonal range queries for the chair problems. . . . . . . . . . . . . . . . . . . . . . . . . . . . 122
3.4
The total execution time for the orthogonal range queries for the chair problem with a query size of 4. . . . . . . . . . . . . . . . . . . . . . . 123
3.5
The memory usage of the data structures for the chair problem. . . . . 123
3.6
The total number of records returned by the orthogonal range queries for the random points problems.
3.7
. . . . . . . . . . . . . . . . . . . . . 126
The total execution time for the orthogonal range queries for the random points problem. . . . . . . . . . . . . . . . . . . . . . . . . . . . . . . . 126
3.8
The memory usage of the data structures for the random points problem.126
5.1
Convergence to a smooth solution. . . . . . . . . . . . . . . . . . . . . 193
5.2
Convergence to a solution with high curvature. . . . . . . . . . . . . . 199
5.3
Convergence to a solution with shocks. . . . . . . . . . . . . . . . . . . 202
5.4
Convergence to a smooth solution. . . . . . . . . . . . . . . . . . . . . 214
5.5
Convergence to a solution with high curvature. . . . . . . . . . . . . . 214
5.6
Convergence to a solution with shocks. . . . . . . . . . . . . . . . . . . 217
1
Chapter 1 Introduction 1.1 1.1.1
Analytical Methods Notation
Hamilton-Jacobi equations are first-order partial differential equations. The equation may be time dependent or static. The Cauchy problem for a time dependent HamiltonJacobi equation is ∂u + H(x, t, u, Du) = 0 in Ω × (0..T ), ∂t u = φ on ∂Ω × (0..T ),
u(x, 0) = u0 (x) in Ω.
Here Du denotes the gradient of u, (Du ≡ ∇u ≡ (∂u/∂x1 , . . . , ∂u/∂xN )), Ω is an open domain in RN , φ is a given function and H is called the Hamiltonian. The Cauchy problem is intimately connected with problems in the calculus of variations and with Hamiltonian systems of ordinary differential equations. We will consider the Dirichlet problem for a static Hamilton-Jacobi equation, which can be written in the form: H(x, u, Du) = 0 on Ω,
u = φ on ∂Ω.
(1.1)
Equation 1.1 may be solved locally using the method of characteristics. (See Section 1.1.2.) However, in general, the equation does not have classical solutions, i.e.,
2 solutions which are C 1 . The problem does have generalized solutions, which are continuous and satisfy the differential equation almost everywhere. (See Section 1.1.3.)
1.1.2
Method of Characteristics
In this section we show how to solve the general static Hamilton-Jacobi equation (1.1) with the method of characteristics [21] [12] [16]. Then we will solve the eikonal equation as an example. Let (X, U, P) denote the characteristics. They satisfy the characteristic strip equations: ∂H ∂P ∂H U 0 (t) = ·P ∂p ∂H ∂H P0 (t) = − − P ∂x ∂u
X0 (t) =
X(t) is called the projected characteristic (because it is the projection of the characteristics (X, U, P) onto RN ) or simply the characteristic. The characteristics start on the boundary and propagate the solution into the domain. They satisfy the initial conditions: X(0) = x ∈ ∂Ω, U (0) = φ(x), P(0) = λn(x) + ∂φ. Here n is the outward unit normal to ∂Ω and ∂φ is the gradient of φ on ∂Ω. λ is chosen to satisfy the Hamilton-Jacobi equation at the point x, H(x, φ(x), P(0)) = 0. These 2N + 1 ordinary differential equations with initial conditions describe the characteristics which determine the solution in a neighborhood of the boundary. Consider the eikonal equation: |Du|f (x) = 1 in Ω,
u = φ on ∂Ω.
(1.2)
3 We write the equation as |Du|2 −
1 = 0. f2
The characteristic strip equations are X0 (t) = 2P(t),
X(0) = x
U 0 (t) = 2|P(t)|2 ,
U (0) = φ(x)
P0 (t) = −2
Df (X(t)) , f 3 (X(t))
P(0) = λn(x) + ∂φ(x)
λ is chosen to satisfy the Hamilton-Jacobi equation at t = 0. |λn(x) + ∂φ(x)|f (x) = 1 1 f 2 (x) �1/2 2 − (∂φ(x))
λ2 (x) + (∂φ(x))2 = λ(x) = −
�
1 f 2 (x)
The minus sign is chosen so that λn is an inward normal to the boundary. Now consider the case f = 1, φ = 0. We substitute these values into the characteristic strip equations. X0 (t) = 2P(t),
X(0) = x
U 0 (t) = 2|P(t)|2 ,
U (0) = 0
P0 (t) = 0,
P(0) = −n(x)
We integrate these equations to obtain the characteristics. X(t) = x − 2tn(x),
U (t) = 2t,
P(t) = −n(x)
We switch to an arc-length parameterization to simplify the result. X(t) = x − tn(x),
U (t) = t,
P(t) = −n(x)
(1.3)
4 From this we see that the projected characteristics X(t) are straight lines which are normal to the boundary and that the local solution u(x) is the distance to the boundary. u(x) = dist(x, ∂Ω)
1.1.3
Viscosity Solutions
1.1.3.1
A Motivating Example
In this section we introduce viscosity solutions of static Hamilton-Jacobi equations through a simple example. (See [12] or [21] for rigorous derivations.) We will compute the distance to the boundary of a domain by solving an eikonal equation: |Du| = 1 in Ω,
u = 0 on ∂Ω
(1.4)
u(−1) = u(1) = 0
(1.5)
First we consider this problem in 1-D: |u0 | = 1 in (−1..1),
Note that this problem does not have classical solutions, that is, u ∈ C 1 . The general solution of the differential equation is u = ±x + c. We cannot choose a sign for x and a constant of integration to satisfy both boundary conditions. We can however find a weak solution that satisfies the differential equation almost everywhere. The function u(x) = 1 − |x| =
1 + x for − 1 ≤ x ≤ 0, 1 − x for 0 ≤ x ≤ 1
satisfies the boundary conditions and satisfies the differential equation everywhere except x = 0. This solution has the right physical meaning: it gives the distance to the boundary of the domain. Unfortunately this solution is not unique. There are an infinite number of ways of constructing weak solutions by piecing together line segments of slope ±1 that satisfy the boundary conditions. Figure 1.1 shows a few of
5 these.
Figure 1.1: Three weak solutions of |u0 | = 1, u(−1) = u(1) = 0. We note that second-order quasi-linear boundary value problems have well developed existence/uniqueness theories. Consider the boundary value problem: u00 = f (x, u, u0 ) in (0..1),
u(0) = a, u(1) = b.
(1.6)
If f and fu are continuous and fu ≥ 0, then this problem has a unique solution [34]. We add a small viscosity term to Equation 1.5 to obtain a second-order equation for u� (x): −�u00� + |u0� | = 1 in (−1..1),
u� (−1) = u� (1) = 0,
�>0
(1.7)
By comparison with Equation 1.6 we see that the problem now has a unique solution. For small �, the viscosity term will have little effect on the solution u� (x) where it is smooth. However, it will smooth out the corners to make the solution C 2 . Note that we have chosen the sign of � to smooth the solution where it has a relative maxima. The distance function can have relative maxima, but not relative minima in the interior of the domain. Choosing the opposite sign for � would have smoothed the solution at minima. Equation 1.7 has the unique solution: � u� (x) = 1 − |x| + �e−1/� 1 − e(1−|x|)/� .
6 Figure 1.2 shows the solution for � = 1/5, 1/10, 1/20, 1/40. Then it shows the solution in the limit as � → 0. This is called the viscosity solution. Here the viscosity solution is the distance function we set out to find. 0.2 0.1 0.05 0.025 0
Figure 1.2: Solutions of −�u00� + |u0� | = 1, u� (−1) = u� (1) = 0 for � = 1/10, 1/20, 1/40 and the viscosity solution as � → 0. We can also obtain the viscosity solution of Equation 1.5 with the method of characteristics. We will make use of the solution we derived in Equation 1.3. The solution starting at the left boundary is u1 = x, while the solution starting at the right boundary is u2 = 1 − x. Combining these gives us a multi-valued solution. By taking the minimums of the multi-valued solution at each point, we obtain the viscosity solution: u = 1 − |x|. Figure 1.3 shows the multi-valued and the viscosity solution.
Figure 1.3: The multi-valued solution obtained with the method of characteristics and the viscosity solution obtained by taking the minimum of the multi-valued solutions.
7 1.1.3.2
The General Case
Now we consider the viscosity solution for a more general problem: H(Du, x) = 0 on Ω,
u = φ on ∂Ω.
(1.8)
We assume that H and φ are continuous. We add a viscosity term to this problem to obtain an elliptic equation: H(Du� , x) − �∆u� = 0 on Ω,
u� = φ on ∂Ω.
(1.9)
This problem has a smooth solution. One can show that u� (x) → u(x) as � → 0. However, as � → 0 we are no longer able to differentiate the solution. We would like a definition of the solution that does not involve differentiating u. To accomplish this we introduce a smooth test function v and move the derivatives to this function by using the maximum principle. We fix a smooth test function v ∈ C ∞ and suppose that u − v has a strict local maximum at x = x0 ∈ Ω. That is, u(x0 ) − v(x0 ) > u(x) − v(x) in some neighborhood of x0 . For � sufficiently small, u� − v has a strict local maximum at x = x� where x� → x0 as � → 0. We can relate the derivatives of u� and v through the maximum principle. Du� (x� ) = Dv(x� ) −∆u� (x� ) ≥ −∆v(x� ) Now we will show that H(Dv(x0 ), x0 ) ≤ 0. H(Dv(x� ), x� ) = H(Du� (x� ), x� ) = �∆u� (x� ) ≤ �∆v(x� )
8 Letting � → 0, we see that H(Dv(x0 ), x0 ) ≤ 0 This also holds if the maximum is not necessarily strict. Likewise, if we suppose that u − v has a local minimum at x0 then H(Dv(x0 ), x0 ) ≥ 0. These inequalities enable us to define a viscosity solution without differentiating the solution. A bounded, uniformly continuous function u is a viscosity solution of the problem: H(Du, x) = 0 on Ω,
u = φ on ∂Ω.
provided that the function satisfies the boundary condition and for each v ∈ C ∞ (Ω): • if u − v has a local maximum at x0 then H(Dv(x0 ), x0 ) ≤ 0, • if u − v has a local minimum at x0 then H(Dv(x0 ), x0 ) ≥ 0. This definition is consistent with the notion of a classical solution. Suppose that u ∈ C 1 (Ω) is a solution. If u − v has a local maximum or minimum at x0 then Du(x0 ) = Dv(x0 ). This implies that H(Dv(x0 ), x0 ) = 0 so both inequalities are satisfied. Further, one can show that the viscosity solution is unique and that it satisfies the differential equation wherever it is differentiable. Now we can directly verify that u = 1 − |x| is a viscosity solution of |u0 | = 1, u(−1) = u(1) = 0. We only have to check the point x = 0, since u satisfies the differential equation elsewhere. The Hamiltonian is H(u0 , x) = |u0 | − 1. If u − v has a local maximum at x = 0, then −1 ≤ v 0 (0) ≤ 1. Therefore |H(v 0 (0), 0)| ≤ 0. It is not possible for u − v to have a relative minimum at x = 0. Thus u = 1 − |x| is the unique viscosity solution. 1.1.3.3
An Example in 2-D
Now consider Equation 1.4 in 2-D. u(x) = dist(x, ∂Ω) is the viscosity solution. We will construct this solution with the method of characteristics for the case that the domain Ω is bounded by a polygon. (See Figure 1.4.)
9
Figure 1.4: A polygonal domain on which to solve the eikonal equation to determine the distance from the boundary. We can determine the method of characteristics solution starting from each edge. From Equation 1.3 we see that each of these solutions are planes. Figure 1.5 shows the solutions starting at each edge of the polygon.
Figure 1.5: The method of characteristics solution from each side of the polygon. We combine the method of characteristics solutions to obtain a multi-valued solution. Then we take the minimum at each point to obtain the viscosity solution. (See Figure 1.6.) This viscosity solution gives the minimum distance to the boundary: u(x) = dist(x, ∂Ω).
10
Figure 1.6: The left figure shows the multi-valued solution determined with the method of characteristics. The right figure shows the viscosity solution obtained by taking the minimum of the multi-valued solutions.
1.2
Numerical Methods
Static Hamilton-Jacobi equations may be numerically solved on a grid with finite difference methods. We consider the eikonal equation in 1-D, (Equation 1.5). In the method of characteristics solution, the solution propagates from the boundary and the solution u increases along the characteristics. At each point, we call the characteristic direction the downwind direction, as this is the direction in which information flows. Numerical differencing to determine Du at the grid point ui must only use grid points uj for which uj ≤ ui . That is, the differencing must be done in the upwind direction. One can accomplish this with one-sided differences Di+ and Di− to approximate u0 (x): Di+ u =
ui+1 − ui , ∆x
Di− u =
ui − ui−1 ∆x
One can easily see that a centered difference: Di0 u =
ui+1 − ui−1 2∆x
is not suitable. We simply note that it cannot be satisfied where the solution has an interior maximum. Suppose that ui−1 ≤ ui ≥ ui+1 . There is no way of defining ui−1
11 and ui+1 so that ui is a local maxima and |Di0 u| = 1. We will describe upwind, finite difference schemes in Section 5.2. Roughly speaking, given a scheme which differences in the upwind direction, one can use this scheme to propagate the solution from lower to higher values. One can specify the solution on the boundary and then iterate with the scheme until the solution converges. There is a way to avoid this iteration and directly solve for the solution by controlling the order in which the finite differences are applied. This is Sethian’s Fast Marching Method, (Section 5.3.) In this method the solution is marched out from the boundary and the grid points are sorted in a heap as the algorithm progresses.
1.3
Applications
Static Hamilton-Jacobi equations are useful in such areas as wave propagation, computational geometry, and optimal control. (See [29], [21], [3] and [26].) In this section we will introduce a few of these applications.
1.3.1
Wave Fronts in the Wave Equation: The Eikonal Equation
Many kinds of disturbances propagating in a media can be modeled with the wave equation: ∂2φ = c2 ∇2 φ. ∂t2 For example: in a fluid, small displacements φ to a uniform mass density ρ and pressure p satisfy the wave equation. Here c satisfies c2 = ∂p/∂ρ. In electrodynamics, each component of the fields satisfies the wave equation where c2 = c20 /µ�. (c0 is the speed of light in a vacuum, µ is the permeability and � is the dielectric constant.) A solution of the wave equation is called a wave. The moving boundary of a disturbance is called a wave front. In this section we will show how the wave front can be described by an eikonal equation. We follow the derivation presented in [10].
12 If c is constant, then there are plane traveling wave solutions of the form φ = φ0 eı(k·x−ωt) . (We can take the real or imaginary part to obtain a real-valued solution.) Here the constant φ0 is the amplitude and ω is the frequency. The wave number vector k is in the direction of the wave. This is perpendicular to the wave fronts which satisfy √ k · x − ωt = constant. The wave number k is the length of the wave vector, k = k · k and satisfies k = ω/c. The index of refraction n is defined by c = c0 /n. Let k0 be the wave number in a vacuum where the index of refraction is unity. For simplicity, consider a wave propagating in the first coordinate direction. φ = φ0 eık0 (nx−c0 t) .
(1.10)
Here we have factored out k0 because we will be considering the case when the wave number is large. Now we consider the case that the index of refraction n is spatially dependent. We seek a solution that is similar to the plane wave in (1.10). φ = exp (A(x) + ık0 (ψ(x) − c0 t)) .
(1.11)
Here the amplitude eA and the phase k0 ψ are determined by the slowly varying functions A(x) and ψ(x). We compute the derivatives of this approximate plane wave. ∇φ = φ∇(A + ık0 ψ) ∇2 φ = φ ∇2 A + ık0 ∇2 ψ + (∇A)2 − k02 (∇ψ)2 + ı2k0 ∇A · ∇ψ
�
13 We substitute (1.11) into the wave equation. n2 φ = ∇2 φ 2 tt c0 −k02 n2 = ∇2 A + ık0 ∇2 ψ + (∇A)2 − k02 (∇ψ)2 + ı2k0 ∇A · ∇ψ Since A and ψ are real-valued, we equate the real and imaginary parts. � ∇2 A + (∇A)2 + k02 n2 − (∇ψ)2 = 0 2∇A · ∇ψ + ∇2 ψ = 0 We assume that n varies slowly on the length scale of a wavelength, λ = 2π/k. Alternatively, for a fixed function n, we assume that the frequency is high (the wavelength is short). This is the geometrical optics approximation. For large k0 , the first equation is approximately solved by an eikonal equation: |∇ψ|2 = n2 . We rewrite this eikonal equation in terms of the phase u of the wave. φ = exp (A(x) + ı(u(x) − ωt)) . |∇u|2 =
ω2 c2
Surfaces of constant u describe the wave fronts.
1.3.2
Computational Geometry
Consider a surface in 3-D. One could represent the surface explicitly with a parameterization. For example, consider the unit sphere: x = cos α sin β,
y = sin α sin β,
z = cos β,
α ∈ [0..2π), β ∈ [0..π]
14 One can also represent the surface implicitly with a level set function u. The surface is the set of points which satisfy u = const. For example, the unit sphere is the zero iso-surface of u=
p
x2 + y 2 + z 2 − 1.
An explicit representation of a surface can be approximated with a polygon mesh surface. The implicit representation can be approximated by storing values of u on a grid. For evolving surfaces or for applying geometric operations, the implicit representation has some advantages over the explicit one. Partial differential equations governing the evolution of the surface may be applied directly to the grid representation of u. Also, it is difficult to handle intersections and changes in topology in the explicit framework. These issues do not require special treatment in the level set approach. On the other hand, the level set approach also has disadvantages in the areas of storage and accuracy. The memory required to store the grid function u is typically much greater than that required to store a polygon mesh. Also, it is easier for polygon meshes to represent a surface that has features on multiple scales. For example, it may take a very fine grid to capture the features of a surface that has thin spikes. In the end, the ease of use and the generality of level set methods makes them the preferred method for many problems. In computational geometry, we can represent solids within the level set framework. The surface of the solid is the zero iso-surface of the signed distance from the surface u. Grid points with (negative/positive) distance are (inside/outside) the solid. With this representation, one easily perform Boolean operations to build complex objects from simple geometric primitives. Consider two solids, X and Y , with level set functions u and v, respectively. Below we give formulas for the three most common operations:
15 union, intersection and difference. X ∪ Y = min(u, v) X ∩ Y = max(u, v) X − Y = max(u, −v) Another common problem in computational geometry is surface offsetting, that is, enlarging or reducing a solid by offsetting its surface in the normal direction. This is a complicated operation with a polygon mesh representation, but is trivial when using level set methods: one simply adds a constant to the distance function u. One can generate the distance function u of a solid by solving the eikonal equation |∇u| = 1 where the boundary condition is specified on the surface S by u|S = 0. For example, if u were specified near the surface, one could use finite difference methods to extend u to the rest of the grid. The more common scenario would be that one has an explicit representation of a solid that one wishes to convert to a level set function. We develop an optimal algorithm for this transformation in Chapter 2.
1.3.3
Optimal Path Planning
The eikonal equation may be used to solve problems in shortest arrival times or minimum cost paths [29]. Consider a positive cost function f defined on some domain. Given points a and b, we wish to find the path Γ that minimizes the cost in going from a to b. That is, if γ(τ ) is the arc-length parameterization of Γ, we wish to minimize the integral: Z
b=γ(L)
f (γ(τ )) dτ
a=γ(0)
We define a function u(x) that is the minimum cost to go from a to x. u(x) = min γ
Z a
x
f (γ(τ )) dτ
16 The level set u(x) = c is the set of points that can be reached with minimum cost c. The minimum cost paths are orthogonal to the level sets. Differentiating the expression for u, we see that ∇u(x) = f (x)n where n is normal to the level set at x. Thus u satisfies an eikonal equation: |∇u| = f Once we have solved for u, we can find the minimum cost path by following ∇u from b back to a. That is, we solve Xt = −∇u,
X(0) = b
until we reach a.
1.4
Overview
In Chapter 2 we consider the problem of converting an explicit representation of a curve or surface into an implicit, level set representation. That is, an explicit surface such as a triangle mesh is converted to a distance function. We discuss previous work on this problem and present a new algorithm. This Characteristic/Scan Conversion algorithm (CSC) has the optimal computational complexity. The CSC Algorithm solves the eikonal equation |∇u| = 1 subject to the boundary condition that u is zero on the surface with the method of characteristics. This method is implemented efficiently with the aid of computational geometry and polygon/polyhedron scan conversion. For comparison, we also discuss the related problem of extending the distance function if the distance function is specified near the surface, which can be accomplished with Sethian’s Fast Marching Method. In Chapter 3 we consider orthogonal range queries (ORQ), a fundamental operation in computational geometry. Given a set of points in k-dimensional space, an ORQ returns the points inside a specified axis aligned range. In the CSC algorithm, one uses scan conversion to determine the grid points which lie inside a polyhedron. If one
17 were computing the distance transform on an irregular grid, one would use orthogonal range queries to determine the grid points inside the polyhedron. In Chapter 3 we first analyze the standard data structures for performing ORQ’s. Then we develop additional data structures based on cell arrays. In particular we address the problem of doing multiple ORQ’s on a given data set. In preparation for developing a new ordered, upwind method for solving static Hamilton-Jacobi equations, we discuss the single-source shortest paths problem for graphs in Chapter 4. Sethian’s Fast Marching Method (FMM), which has computational complexity O(N log N ) where N is the number of grid points, has been regarded as an optimal algorithm because it is closely related to Dijkstra’s algorithm for solving the single-source shortest path problem, which has computational complexity O((E + V ) log V ) where E is the number of edges and V is the number of vertices. We first discuss Dijkstra’s algorithm for solving this problem and then present a new algorithm called Marching with a Correctness Criterion (MCC). The MCC algorithm can reduce the computational complexity to O(E + V + D/A) where D is the largest distance in the shortest path tree and A is the smallest edge weight. In Chapter 5 we first present Sethian’s Fast Marching Method for solving static Hamilton-Jacobi Equations. Then we develop a Marching with a Correctness Criterion algorithm for solving this problem. This MCC algorithm requires difference schemes that difference not only in coordinate directions, but in diagonal directions as well. The MCC algorithm produces the same solution as the FMM, but with computational complexity O(N ).
18
Chapter 2 Closest Point Transform 2.1
Introduction
Let u(x), x ∈ Rn , be the distance from the point x to a manifold S. If dim(S) = n − 1, (for example curves in 2-D or surfaces in 3-D), then the distance is signed. The orientation of the manifold determines the sign of the distance. One can adopt the convention that the outward normal points in the direction of positive or negative distance. In order for the distance to be well defined, the manifold must be orientable and have a consistent orientation. A Klein bottle in 3-D for example is not orientable. Two concentric circles in 2-D have consistent orientations only if the normals of the inner circle point “inward” and the normals of the outer circle point “outward”, or vice versa. Otherwise the distance would be ill defined in the region between the circles. For manifolds which are not closed, the distance is ill defined in any neighborhood of the boundary. However, the distance is well defined in neighborhoods of the manifold which do not contain the boundary. If dim(S) < n − 1 (for example a set of points in 2-D or a curve in 3-D) the distance is unsigned and can be taken as nonnegative. One can consider the distance to be the arrival time of a front propagating with unit speed from the manifold. Consider a manifold S that moves in a direction normal to itself with unit speed. Let u(x) be the arrival time of the surface at the point x. |∇u| has unit magnitude. On the manifold S, u is zero. The arrival time u is the
19 solution of the eikonal equation [29], |∇u| = 1,
u S = 0.
(2.1)
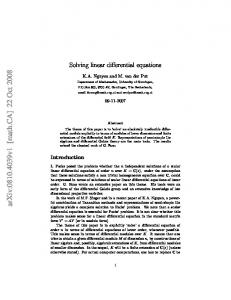
For most initial conditions, there is no strong solution, i.e., a solution which is everywhere differentiable. However, as described in Chapter 1, there is a vanishing viscosity solution which is continuous (C 0 ) and satisfies the eikonal equation where it is differentiable. Let ξ be the closest point on a manifold to the point x. The distance to the manifold is |x − ξ|. x and ξ are the endpoints of the line segment that is a characteristic of the solution of Equation 2.1. If the manifold is smooth then the line connecting x to ξ is orthogonal to the manifold. If the manifold is not smooth at ξ then the line lies “between” the normals of the smooth parts of the manifold surrounding ξ. The distance transform transforms an explicit representation of a manifold into an implicit one. Specifically, it transforms the manifold to its distance function, u(x). The manifold can be implicitly represented as the level set of distance zero of the distance function, u(x) = 0. The inverse operation, converting the distance function to a manifold may be accomplished with algorithms such as Marching Cubes [22], which transform the distance function sampled on a regular grid into a triangle mesh surface. The closest point transform (CPT) also transforms an explicit representation of a manifold into an implicit one. The closest point function, p(x), gives the closest point on the manifold to x. The manifold can be implicitly represented as p(x) = x. The algorithm developed in this chapter computes distance and closest point to manifolds which are composed of simple geometric primitives. The manifold may be given as sets of points, curves composed of line segments or surfaces composed of triangular facets. As an example, Figure 2.1 shows a triangle mesh. The second picture is a density plot of a slice of the distance. The final picture shows the closest point transform calculated for the grid points close to the surface. The closest point
20 is depicted as line segments from grid points to closest points on the surface.
Figure 2.1: A triangle mesh, its distance transform and its closest point transform.
In the next section we will present some applications of the distance and closest point transform. These will demonstrate the utility of the new CPT algorithm. Before presenting the details of this new algorithm we will examine previous work on the distance and closest point transform. We will consider geometrically based methods for computing the closest point transform and finite difference based methods for computing approximate distance transforms. Then we will cover some background material that is a prerequisite for developing an improved closest point transform algorithm. This algorithm will be demonstrated first in the context of computing the closest point transform to a piecewise linear curve in 2-D and then a triangle mesh surface in 3-D. Finally, we will examine the performance of the improved closest point transform algorithm and compare its performance to some other methods.
2.2
Applications
The distance and closest point transforms are important in several applications which we discuss briefly below. The distance transform can be used to convert an explicit surface into a level set representation of the surface. The surface is the iso-
21 surface of value zero. Algorithms for working with the level set are often simpler and more robust than dealing with the surface directly. Set operations like union and intersection for facetted surfaces or polynomial patch surfaces are difficult to implement. However, set operations on the level set representation of the surfaces are trivial. Another example of the utility of the distance transform is the application to surface propagation problems in which a surface moves with a given normal velocity. A simple example is surface offsetting, that is, finding the surface that is a given distance from another surface. Working with the surface explicitly can be difficult because one needs ad hoc methods for dealing with self-intersections and topological changes. By working with the level set representation of the surface one can describe these problems with partial differential equations and use finite difference methods for their solution [25]. Surface offsetting is trivial when the level set representation of a surface is the distance transform. The surface a distance d from the given surface is just the iso-surface of value d. The closest point transform is useful when one needs information about the closest point on a surface in addition to the distance. Each point on a surface has a position and may have an associated velocity, color, or other data. For instance, one can use the closest point transform to do offsetting to a color-shaded surface. By performing the CPT we obtain closest point volume data. That is, each point in a 3-D grid stores the closest point on the surface. With the closest point information, we can generate color volume data, each grid point stores the color of the closest point. Then an offset surface may be color shaded by conceptually embedding it within the color and closest point volumes. When the offset surface is rendered, the color value at any location on its surface may be retrieved as the value of the color at the closest point on the original surface [6] [5] [7]. The closest point transform has recently found application in certain coupled solid mechanics/fluid mechanics computations in which we want to explicitly track the location of the solid/fluid interface [13] [26] [23]. Using a closest point transform, a Lagrangian solid mechanics code can communicate the position and velocity of the
22 solid interface to an Eulerian fluid mechanics code. Consider a fluid grid which spans the entire domain, inside and outside the solid. Thus only a portion of the grid points lie in the fluid. Suppose further that the solid mechanics is done on a tetrahedral mesh. The boundary of the solid is then a triangle mesh surface. Computing the distance transform to this surface on the fluid mechanics grid indicates which grid points are outside the solid and thus in the fluid domain. Through the closest point transform one can implement boundary conditions for the fluid at the solid boundary. In particular, it is necessary to recreate the closest point transform at each time step if the solid/fluid interface is itself time dependent. For such simulations it is highly desirable that the closest point transform have linear computational complexity in both the size of the fluid grid and solid mesh. If the CPT does not have linear computational complexity, determining the fluid boundary condition through the CPT would likely dominate the computation.
2.3
Previous Work
Brute Force Approach. The closest point transform to a manifold may be computed directly by iterating over the geometric primitives in the manifold as one iterates over the grid points. Consider a manifold S composed of M geometric primitives. We compute the distance to the manifold and the closest point on the manifold for the points in a 3-D regular grid with N grid points. The brute force algorithm for computing the distance and closest point transform follows.
closest point transform brute( distance, closest point, manifold ) for all i, j, k: distance[i,j,k] = ∞ for primitive in manifold: for all i, j, k: new distance = distance from grid point (i,j,k) to primitive if |new distance| < |distance[i,j,k]|:
23 distance[i,j,k] = new distance closest point[i,j,k] = closest point on primitive return Since there are M geometric primitives in the manifold and N grid points, the computational complexity of the brute force algorithm is O(M N ). If the distance and closest point are only needed in a neighborhood around the manifold, then the inner for loop is replaced by a loop over all the grid points within a certain distance of each geometric primitive. The following function computes the distance and closest point for all grid points within max distance of the manifold.
closest point transform brute( distance, closest point, manifold, max distance ) for all i, j, k: distance[i,j,k] = ∞ for primitive in manifold: close grid points = the set of grid indices within max distance of primitive for i, j, k in close grid points: new distance = distance from grid point (i,j,k) to primitive if |new distance| ≤ max distance and |new distance| < |distance[i,j,k]|: distance[i,j,k] = new distance closest point[i,j,k] = closest point on primitive return The brute force algorithm is slow. However, it is embarrassingly concurrent with respect to both the distribution of the geometric primitives and the grid points. If the grid points are distributed over a number of processors, then the concurrent algorithm consists of each processor executing the above sequential algorithm on its share of the grid points. Next, assume that the geometric primitives are distributed over a number of processors with each processor holding the entire grid. After each processor executes the sequential code with its share of the primitives, the grids can be merged by choosing the smallest distance for each of the grid points.
24 LUB-Tree Methods. One can also use lower-upper-bound tree methods to compute the distance and closest point transforms [18]. The surface is stored in a tree data structure in which each subtree can return upper and lower bounds on the distance to any given point. This is accomplished by constructing bounding boxes around each subtree. (See Figure 2.2.) For each grid point, the tree is searched to find the closest point on the surface. As the search progresses, the tree is pruned by using upper and lower bounds on the distance. Since the average computational complexity of each search is O(log M ), the overall complexity is O(N log M ).
Figure 2.2: A LUB-tree for an eight-sided polygon. We show each level in the tree. The diagram along the bottom shows the branching structure. The data structure stores a bounding box around each branch. The leaves of the tree are the line segments.
Finite Difference Methods. Instead of computing the distance to an explicitly represented manifold, consider an implicitly represented manifold. Then one can use upwind finite difference methods to solve the eikonal equation (Equation 2.1) and obtain an approximate distance transform [25]. The initial data is the value of the distance on the grid points surrounding the surface. (This is the implicit description of the surface.) This initial condition can be generated with the brute force method. An upwind finite difference scheme is then used to propagate the distance to the rest
25 of the grid points. The scheme may be solved iteratively, yielding a computational complexity of O(αN ), where α is the number of iterations required for convergence. The scheme may also be solved by ordering the grid points so that information is always propagated in the direction of increasing distance. This is Sethian’s Fast Marching Method [27] which has computational complexity O(N log N ). Tsai has developed a method for computing the distance transform with geometrically based finite difference schemes [31]. The solution is propagated outward from the initial surface by sweeping through the grid in each diagonal coordinate direction. The computational complexity of the algorithm is O(α2K N ), where K is the dimension and α is the number of iterations.
1
The number of iterations required
for this method is small. By using sophisticated finite difference schemes one can compute the distance accurately. If the manifold is a set of points, the distance can be computed to within machine precision. This method has been extended to solve static Hamilton-Jacobi equations [19]. The result is named the fast sweeping method. It has computational complexity O(α2K N ) where the number of iterations α depends on the complexity of the Hamiltonian.
2.4
Scan Conversion and Voronoi Diagrams
In order to develop the present algorithm for computing the closest point transform, we introduce the concepts of scan conversion and Voronoi diagrams. Scan conversion or rasterization is a standard technique in computer graphics for displaying filled polygons on raster displays [14] [33]. It is a method for determining the pixels on the display which lie inside a polygon. Consider a convex polygon and a rectilinear grid. We can use scan conversion to efficiently determine the grid points which lie inside the polygon (see Figure 2.3). For each grid row that intersects the polygon we find the left and right intersection points and mark each grid point in between as being inside the polygon. Let e be the number of edges of the polygon, 1 Though we have not explicitly indicated it, the complexity of the other finite difference methods also depends on the dimension.
26 let r be the number of rows that intersect the polygon and let n be the number of grid points inside it. The computational complexity of the scan conversion algorithm is O(e + r + n). If the sides of the polygon are not smaller than the grid spacing, then the computational complexity is O(n). Now consider a convex polyhedron and a 3-D rectilinear grid. We can scan convert the polyhedron by intersecting the polyhedron with the planes that coincide with the grid rows to form polygons. This reduces the problem to polygon scan conversion. Figure 2.3 shows a pyramid and the polygons formed by intersecting with grid rows. If the sides of the polyhedron are not smaller than the grid spacing, then the computational complexity is linear in the number of grid points inside the polyhedron.
Figure 2.3: The left figure depicts scan conversion of a polygon in 2-D. The right figure shows slicing a polyhedron to form polygons.
Consider a set of points P = {p1 , p2 , . . . , pM } in R2 . The Voronoi diagram [24] is a subdivision of the plane into M cells such that the Voronoi cell corresponding to pi , V (pi ), contains all the points in R2 to which pi is the closest point in P . Each Voronoi cell is a bounded or unbounded convex polygon. If we consider a set of points P in the rectangle [x0 , x1 ] × [y0 , y1 ] ⊂ R2 then each Voronoi cell is a bounded convex polygon. (See Figure 2.4.) For a set of points in R3 the Voronoi cells are convex polyhedra. The computational complexity of computing the Voronoi diagram is O(M log M ) in 2-D, and O(M 2 ) in 3-D.
27
Figure 2.4: Unbounded and bounded Voronoi diagrams. As a step toward computing the closest point transform to a curve or surface, we consider the closest point transform to a set of points S. For each point in a rectilinear grid we will compute the closest point in S and the distance to that point. We proceed by first finding the Voronoi diagram of S. For each point p ∈ S and its Voronoi cell, we use scan conversion to determine the grid points which lie inside this Voronoi polygon/polyhedron. Then the distance to p is computed for each of these grid points and p is set as its closest point. This process is show pictorially in Figure 2.5. In implementing the algorithm, the polygons/polyhedra must be enlarged slightly to make sure that grid points are not missed due to finite precision arithmetic. As a byproduct of enlarging the polygons/polyhedra, some grid points may be scan converted more than once. In this case, the smaller distance and thus the closer point is chosen. Below is the function for computing the closest point transform on a regular grid to a set of points.
closest point transform point set( distance, closest point, point set ) for all i, j, k: distance[i,j,k] = ∞ voronoi diagram = voronoi diagram for point set for point, voronoi cell in voronoi diagram:
28 Grid
Voronoi Diagram
Scan Convert
Compute Distance
Figure 2.5: Computing the closest point transform on a regular grid to a set of points. voronoi cell = enlarge( voronoi cell ) grid points = scan convert( voronoi cell ) for i, j, k in grid points: new distance = distance from grid point (i,j,k) to point if |new distance| < |distance[i,j,k]|: distance[i,j,k] = new distance closest point[i,j,k] = point return If the edges of the Voronoi polygons/polyhedra are no smaller than the grid spacing, then the computational complexity of the scan conversion will be linear in the number of interior grid points. In this case, the computation complexity of the closest point transform is O(M log M + N ) in 2-D and O(M 2 + N ) in 3-D, where M is the
29 number of points in S and where N is the number of grid points.
2.5
An Improved CPT Algorithm
In this section we develop an improved algorithm for computing the closest point transform to a manifold for the points in a regular grid. We will use a similar approach to that for computing the CPT to a set of points. As a first step in the algorithm, we need something like a Voronoi diagram for the manifold. However, instead of computing polygons/polyhedra that exactly contain the closest grid points to a point, we will compute polygons/polyhedra that at least contain the closest grid points to the components of the manifold. These polygons/polyhedra can then be scan converted to determine the grid points that are possibly closest to a given component. Unlike a Voronoi diagram, we will not need to store all of these polygons/polyhedra at once. They will be constructed and used one at a time.
2.5.1
The CPT for Piecewise Linear Curves
Consider the distance to a piecewise linear curve. For a given point, the closest point on a piecewise linear curve either lies on one of the edges or at one of the vertices. Suppose that the closest point ξ on the curve to a given point x lies on an edge. The vector from ξ to x is orthogonal to the line segment. Thus the closest points to a given line segment must lie within an infinite strip. The strip defined by the line segment and the (outward/inward) normals contains the points of (positive/negative) distance from the line. See Figure 2.6 for an illustration of the positive and negative strips for a simple curve. Note that the strips for each edge exactly contain the characteristic curves of the eikonal equation emanating from that edge. Next, consider a point x whose closest point ξ is at a vertex. The vector from ξ to x must lie between the normal vectors to the two adjacent line segments at the vertex. Thus the closest points to a vertex must lie in a wedge. If the (outside/inside) angle between two adjacent line segments is less than π, then there are no points of (positive/negative) distance from the vertex. See Figure 2.7 for an illustration of the
30
x ξ
Figure 2.6: The left figure shows a polygon in thick lines. The strips contain the points which have positive distance to the edges of the polygon. We depict a point x and its closest point on the curve, ξ. The right figure shows the strips containing points which have negative distance to the edges. positive and negative wedges. These wedges again exactly contain the characteristic curves of the eikonal equation emanating from the vertices.
x ξ
Figure 2.7: The left figure shows a polygon in thick lines. The wedges contain the points which have positive distance to the vertices of the polygon. We depict a point x and its closest point on the curve, ξ. The right figure shows the wedges containing points which have negative distance to the vertices.
Now we consider computing the distance and closest point transform to a distance d away from the curve. We use the fact that the closest points to edges/vertices lie in strips/wedges to construct polygons which contain the points within a distance
31 d. (See Figure 2.8.) For vertices, these are wedge-shaped polygons containing points of either positive or negative distance. For edges, these are rectangles containing points of both positive and negative distance. Note that these polygons are similar to Voronoi cells. They contain at least (instead of exactly) the points which are closest to the edge or vertex. By using scan conversion, we can determine the grid points which lie inside each polygon. We can use simple formulas from geometry to compute the distance and closest point for a given line segment or vertex. If the closest point transform is being computed to a relatively large distance away from the curve, the polygons which contain the closest points may have large overlaps. In this case, we can reduce the size of these polygons by using information about the curve to clip them. This will result in fewer scan converted grid points and hence fewer closest point calculations.
d
d
d d
Figure 2.8: The left figure shows a piecewise linear curve and the polygon containing points within a distance d of a vertex. The right figure shows a portion of a piecewise linear curve and the polygons containing points of positive and negative distance which are within a distance d of an edge.
We can now describe a fast algorithm for computing the distance and closest point transform to a piecewise linear curve for the points in a 2-D grid.
closest point transform( distance, closest point, edges, vertices ) for all i,j: distance[i,j] = ∞ // Loop over the edges. for edge in edges:
32 polygon = polygon containing closest points to edge grid indices = scan convert( polygon ) // Loop over the scan converted grid points. for i,j in grid indices: new distance = distance from grid point (i,j) to edge if |new distance| < |distance[i,j]|: distance[i,j] = new distance closest point[i,j] = closest point on edge // Loop over the vertices. for vertex in vertices: polygon = polygon containing closest points to vertex grid indices = scan convert( polygon ) // Loop over the scan converted grid points. for i,j in grid indices: new distance = distance from grid point (i,j) to vertex if |new distance| < |distance[i,j]|: distance[i,j] = new distance closest point[i,j] = vertex return Because of the use of floating point arithmetic in representing the polygons, one needs to increase the size of the polygons by a small amount in the outward normal direction. This ensures that grid points which are close to the boundary of the polygon are included and no grid points are left out. In implementing the method, only the polygons for edges need to be enlarged. This ensures that there is a small overlap between neighboring polygons. (Note that this step would not be necessary if the characteristic polygons were constructed so that neighbors share vertices. Then the scan conversion would not miss any grid points. This restriction is easy to enforce in 2-D when the characteristic polygons are not clipped. However, it would be more difficult to implement in 3-D or in the presence of clipping. It is easiest to just enlarge
33 the polygons.) Suppose the curve has M edges and vertices. Let there be N grid points within a distance d of the curve and let r be the ratio of the sum of the areas of all the scan converted polygons divided by the area of the domain within a distance d of the curve. The total computational complexity of the algorithm is O(rN +M ). The O(rN ) term comes from scan conversion and the closest point and distance computations for the grid points. The ratio r depends on the shape of the curve and the distance d. If the curve is jagged and d is relatively large, then r will be large. If the curve is smooth and d is relatively small (or if d is large and the polygons are effectively clipped) then r will be close to unity. The O(M ) term represents the construction and perhaps the clipping of the polygons.
2.5.2
Triangle Mesh Surface
We next consider the closest point transform for a triangle mesh surface in 3-D. The algorithm is very similar to that for computing the CPT to a piecewise linear curve. Instead of a curve composed of edges and vertices, we will deal with a surface composed of triangular faces, edges and vertices. For a given grid point, the closest point on the triangle mesh either lies on one of the faces, edges or vertices. Analogous to the polygons containing the grid points which are possibly closest to a given edge or vertex of a curve, in 3-D we will find polyhedra which contain the grid points which are possibly closest to the faces, edges or vertices. Suppose that the closest point ξ to a grid point x lies on a triangular face. The vector from ξ to x is orthogonal to the face. Thus the closest points to a given face must lie within a triangular prism defined by the face and the normal vectors at its three vertices. The prism defined by the face and the outward/inward normals contains the points of positive/negative distance from the face. See Figure 2.9a for the face polyhedra of an icosahedron. Consider a grid point x whose closest point ξ is on a edge. Each edge in the mesh is shared by two faces. The closest points to an edge must lie in a cylindrical
34 wedge defined by the line segment and the normals to the two adjacent faces. If the outside/inside angle between the two adjacent faces is less than π, then there are no points of positive/negative distance from the line segment. See Figure 2.9b for the edge polyhedra of an icosahedron. Figure 2.9c shows a single edge polyhedron. Finally consider a grid point x whose closest point ξ is on a vertex. Each vertex in the mesh is shared by three or more faces. The closest points to a vertex must lie in a cone defined by the normals to the adjacent faces. If the mesh is convex/concave at the vertex then there will only be a cone outside/inside the mesh and only points of positive/negative distance. Figure 2.9d shows the vertex polyhedra of an icosahedron.
(a)
(b)
(c)
(d)
Figure 2.9: (a) The positive polyhedra for the faces. (b) The polyhedra for the edges. (c) The polyhedron for a single edge. (d) The polyhedra for the vertices.
35 We next present a fast algorithm for computing the distance and closest point transform to a triangle mesh surface for the points in a 3-D grid.
closest point transform( distance, closest point, faces, edges, vertices ) for all i,j,k: distance[i,j,k] = ∞ for face in faces: polyhedron = polyhedron containing the closest points to face grid indices = scan convert( polyhedron ) // Loop over the scan converted points. for i,j,k in grid points: new distance = distance from grid point (i,j,k) to face if |new distance| < |distance[i,j,k]|: distance[i,j,k] = new distance closest point[i,j,k] = closest point on face for edge in edges: ... for vertex in vertices: ... return Let the triangle mesh surface have M faces, edges and vertices. Let the 3-D rectilinear grid have N points within a distance d of the surface. Let r be the ratio of the sum of the volumes of all the scan converted polyhedra divided by the volume of the domain within a distance d of the surface. As in 2-D, the ratio r depends on the shape of the surface and the distance d. If the surface is jagged and d is relatively large, then r will be large. If the surface is smooth and d is relatively small then r will be close to unity. The total computational complexity of the algorithm is O(rN + M ). The O(rN ) term again comes from scan conversion and the closest point and distance computations for the grid points. The O(M ) term represents the construction of the
36 polyhedra.
2.5.3
The General Algorithm
Consider a manifold composed of simple shapes, for example, a piecewise cubic curve in 2-D or 3-D or a surface composed of cubic patches in 3-D. One can construct polygons/polyhedra which contain the closest points within a given distance of these shapes. Then one can apply the Characteristics/Scan Conversion algorithm for computing the closest point transform. The algorithm is essentially the same as that presented for the examples of piecewise linear curves and triangle meshes. The only difference lies in the details of constructing the polygons/polyhedra and computing distance/closest point to the component shapes. For each component, one constructs a polygon/polyhedron which contains all the grid points within a given distance of the component. One then uses scan conversion to determine which grid points are possibly within the given distance of the component. Then the distance to the component and the closest point on the component are computed for these grid points. For more complicated component shapes, such as cubic patches, one would need to solve nonlinear equations to determine the distance and closest point.
2.5.4
Concurrent Algorithm
We note that the Characteristics/Scan Conversion algorithm is embarrassingly concurrent. Suppose the grid on which we want to compute the CPT is distributed over a number of processors. Consider computing the closest point transform to a distance d away from a manifold. If each processor has the portion of the manifold that is within a distance d of its grid, then each processor simply executes the sequential algorithm with its portion of the manifold and the grid. Additionally, one can take advantage of multi-threaded concurrency. For shared-memory architectures, scan converting and computing closest points for each polygon/polyhedron are independent tasks which can proceed concurrently.
37
2.5.5
Characteristic Polygons/Polyhedra versus Voronoi Diagrams
In the CSC algorithm we have used characteristic polygons/polyhedra which contain at least all of the closest points to primitives in the curve/surface. For some types of curves and surfaces it is possible to efficiently construct the Voronoi diagram. For example, in 2-D the Voronoi diagram of a set of line segments may constructed in O(M log M ) time (M is the number of line segments) using Fortune’s sweepline algorithm [15]. For this case, the Voronoi cells are not necessarily convex and their boundaries are composed of line segments and parabolic arcs. Thus one could compute the closest point transform to a piecewise linear curve by first computing its Voronoi diagram and then scan converting the Voronoi cells. The computational complexity of this algorithm would be O(P + M log M ) where P is the total number of grid points. By comparison, the CSC algorithm has complexity O(rN + M ) where N is the number of grid points within the specified distance from the curve. This raises the question of which approach is more efficient. There are several advantages to using the characteristic polygons/polyhedra instead of computing the Voronoi diagram to a curve/surface. The characteristic polygons/polyhedra are easier to construct than the Voronoi diagram (both in terms of computational complexity and in terms of implementation). Also characteristic polygons/polyhedra are simpler structures than Voronoi cells. The former are convex polygons/polyhedra while the latter are nonconvex regions with boundaries composed of curves/surfaces. In order to scan convert these Voronoi cells, one would likely have to bound them with a polygon/polyhedron. Finally, because they can be constructed independently, characteristic polygons/polyhedra are better suited to concurrent implementations. As noted before, for many applications the closest point transform is only needed in a narrow band around the curve/surface. The CSC algorithm is well suited for this scenario. Since the Voronoi cells contain all of the closest points, not just the closest points within the specified distance d, computing the Voronoi diagram might
38 be a waste. Especially because one would clip the Voronoi cell to exclude points farther away than d before scan converting it. This clipped Voronoi cell would likely resemble the corresponding characteristic polygon/polyhedra. On the other hand, if the closest point transform is required on the entire grid then it may be advantageous to use the Voronoi diagram. This is because the characteristic polygons/polyhedra may have large amounts of overlap. This may also be the case if the curve/surface is jagged.
2.6 2.6.1
Performance of the CPT Algorithm Execution Time
First we examine the performance of the Characteristics/Scan Conversion algorithm as we vary the grid size. To verify that the algorithm has linear computational complexity in the grid size, we examine execution time as we refine the grid. We compute the closest point transform to a tessellation of the unit sphere with 2048 faces on the domain (−2, 2) × (−2, 2) × (−2, 2) to a distance of 0.05 for grid sizes from 103 to 2003 . Figure 2.10 shows a log-log plot of execution time versus grid size. Next we show the scaled execution time per grid point. Let T be the execution time and N be the grid size. We subract the execution time for the smallest grid T0 and then divide by N − N0 where N0 = 103 is the smallest grid size. The result is the execution time per grid point, which should be a constant if the method has linear complexity. From Figure 2.10, we see that there is sub-linear scalability in the grid size. This is due to coarser inner loops in the algorithm. As the grid is refined, the polyhedra contain more grid points. Scan converting polyhedra containing many points is more efficient than scan converting polyhedra containing few points. Note that the scaled execution time does not level off until the grid size is fairly large. This is because there are three nested loops in the scan conversion function. (There is a loop for each dimension. In the outer loop the polyhedron is sliced into polygons. The middle loop finds the intersections of a polygon with grid rows. Finally, the inner loop scans along
39 a single grid row from the left intersection to the right intersection.) For this example, the grid must be quite refined before the inner loop scans a moderate number of grid points. This explains the slow decay of the scaled execution time.
8 4 2 1 0.5 1000
10000
100000 Grid Size
1e+06
CPT: Effect of Grid Size Time per Grid Point (microsec)
Total Execution Time (s)
CPT: Effect of Grid Size 15
10
5
0 10000
100000 1e+06 Grid Size
Figure 2.10: The left graph shows a log-log plot of execution time versus grid size for grids varying in size from 103 to 2003 . Next we show the scaled execution time per grid point for grids varying in size from 203 to 2003 . Next we examine the performance of the Characteristics/Scan Conversion algorithm as we vary the mesh size. To verify that the algorithm has linear computational complexity in the mesh size, we examine the execution time as we refine the mesh. We compute the closest point transform on a 100 × 100 × 100 grid to tessellations of the unit sphere on the domain (−1.2, 1.2) × (−1.2, 1.2) × (−1.2, 1.2) to a distance of 0.1 for mesh sizes from 8 to 131072 faces. Figure 2.11 shows a log-log plot of execution time versus mesh size. Next we show the scaled execution time per face. Let F be the number of faces. We subract the execution time for the coarsest mesh T0 and then divide by F − F0 where F0 = 8. The result is the execution time per face, which should be a constant if the method has linear complexity. From Figure 2.11, we see that there is sub-linear scalability in the complexity of the mesh. This is because the total volume of the polyhedra decreases as the mesh is refined.
40 CPT: Effect of Mesh Refinement 8
64
Time per Face (millisec)
Total Execution Time (s)
CPT: Effect of Mesh Refinement
16 4 1
6 4 2 0
10
100 1000 10000 Number of Faces
100000
100
1000 10000 Number of Faces
100000
Figure 2.11: The left graph shows a log-log plot of execution time versus the number of faces for meshes varying in size from 8 to 131072 faces. Next we show the scaled execution time per face for meshes varying in size from 32 to 131072.
2.6.2
Storage Requirements
The CSC algorithm stores the grids for distance and closest point and the mesh to which the CPT is computed. Beyond these data structures which define the problem, it does not require significant additional storage. The components of the mesh (i.e., the faces, edges and vertices) are dealt with one at a time. The memory required to scan convert a single polyhedron is insignificant compared to the grid and the mesh. Thus the CSC algorithm essentially has the minimum storage requirements for the CPT problem.
2.6.3
Comparison with Other Methods
2.6.3.1
Finite Difference Methods
We compare finite difference methods for computing distance with the CSC algorithm. • Finite difference methods compute an approximate distance. The CSC algorithm is accurate to within machine precision. • The CSC algorithm computes the closest point. To compute the approximate closest point with a finite difference method, one first computes the distance and then follows the gradient back to the manifold for each grid point.
41 • The CSC algorithm takes an explicit representation of the manifold as an initial condition. Finite difference methods take an implicit representation, i.e., the value of the distance on grid points surrounding the manifold, as an initial condition. • In d-dimensional space, the computational complexity of the CSC algorithm is linear in both the size of the manifold and the size of the grid, O(M + N ). Once one has generated the initial condition by computing the distance on the grid points close to the manifold, the computational complexity of finite difference methods is O(α2d N ) for iterative methods and O(N log N ) for fast marching methods. • It is relatively easy to implement finite difference methods in higher-dimensional spaces. A finite difference method in 4-D is little different than one in 2-D. It requires significant work to implement the CSC algorithm in higher-dimensional spaces. This is because the geometry involved in constructing the characteristic volumes and the process of scan converting these volumes is complicated. In more than 3 dimensions, it is not feasible to construct characteristic volumes which contain only the closest points. Instead, one would simply put a bounding box around each component of the manifold to obtain the closest points. In this case, the method no longer has linear complexity in the number of grid points because the grid points could be scan converted many times. • The CSC algorithm is embarrassingly concurrent; each process runs the sequential algorithm independent of other processes. Finite difference methods require communication between neighboring processes for concurrent implementations. Although they solve different problems, we compare the performance of the Characteristics/Scan Conversion algorithm and the Fast Marching Method on a test problem. We compute the distance transform to tessellations of a unit sphere to a distance of 0.1 on the domain (−1.2, 1.2) × (−1.2, 1.2) × (−1.2, 1.2). The CSC algorithm was run for tessellations with 2048 faces and 32768 faces. (The FMM takes an initial con-
42 CSC Algorithm and FMM Execution Time (sec)
1000 CSC, 2048 Faces CSC, 32768 Faces FMM
100 10 1
100000 1e+06 Number of Grid Points
1e+07
Figure 2.12: Comparison of execution times (sec) for computing the distance transform. dition on the grid so the execution time is independent of the tessellation refinement.) Figure 2.12 shows the execution times. The CSC algorithm compares favorably with the FMM, especially as the grid is refined. For initial data given explicitly as a surface (instead of implicitly on the grid) using the CSC algorithm to compute the distance transform would typically be preferable to generating an implicit initial condition and using a finite difference method. 2.6.3.2
LUB-Tree Methods
The LUB-Tree method and the CSC algorithm are both geometrically based and thus have many similarities. They both compute the distance and closest point, accurate to within machine precision. They take an explicit representation of the manifold as an initial condition. Both algorithms are embarrassingly concurrent. The primary difference between the algorithms is in performance. The computational complexity of the CSC algorithm is O(M + N ), while the LUB-Tree method is O(M log M + N log M ). Thus the LUB-Tree method is well suited for computing a small number of closest points but is not efficient in computing the closest point transform. Also, the LUB-Tree method is not easily adapted to computing the distance/closest point for only those grid points within a specified distance of the manifold.
43 -2
0
-8
2
2
-4
0
4
8
8
8
4
4
0
0
2
0
0
-2
-4
-4
-8
-8
-2
-2
0
2
-8
-4
0
4
8
Figure 2.13: Two views of the characteristics used in the CSC algorithm applied to an anisotropic eikonal equation. Note the intersection of characteristics and the adding of new characteristics.
2.7
Extending the CSC Algorithm to Solving Static Hamilton-Jacobi Equations
In principal the characteristic/scan conversion algorithm could be generalized to solve static Hamilton-Jacobi equations such as the anisotropic eikonal equation, |∇u|f = 1. In this case the characteristics would no longer be straight lines, but would be curves. These curves, which are determined through the method of characteristics, define volumes emanating from the geometric primitives which define the manifold. By scan converting these volumes and extrapolating the solution from the characteristic curves to the grid points one could solve the Hamilton-Jacobi equation. The problem is dynamic as one marches out from the initial manifold. The characteristics may intersect or they may spread far apart in which case additional characteristics need to be computed. (Figure 2.13 shows two views of these characteristics for an anisotropic eikonal equation where the initial surface is the unit circle.) This algorithm would have linear computational complexity in the number of grid points. This extension was attempted. In 2-D the implementation is not easy. While
44 conceptually simple, the algorithm would be quite difficult to implement in 3 or more dimensions because of its mix of geometry, scan conversion and extrapolation. It was this difficulty which led us to consider ordered, upwind, finite difference methods of solving static Hamilton-Jacobi equations. Though it is difficult to implement, there exists an algorithm with linear computational complexity for solving static HamiltonJacobi equations. Therefore it seems reasonable that a linear complexity algorithm exists which uses finite differences. Furthermore, if such a finite difference algorithm exists then there ought to be a corresponding algorithm for solving the single-source shortest path problem on graphs. It was this optimistic assumption which led to the new algorithms for computing shortest path trees in Chapter 4 and for solving static Hamilton-Jacobi equations in Chapter 5.
2.8
Conclusions
We have presented the Characteristics/Scan Conversion algorithm for computing the closest point transform to a manifold. The algorithm utilizes scan conversion to efficiently solve the eikonal equation with the method of characteristics. The algorithm has optimal computational complexity. In computing the closest point or distance transform to within a given distance of a manifold the CSC algorithm typically performs better than previously developed geometry based methods for computing the closest point transform and finite difference based methods for computing the approximate distance transform.
45
Chapter 3 Orthogonal Range Queries 3.1
Introduction
Consider a database whose entries have multiple searchable attributes. Perhaps a personnel database that stores employees’ names, addresses, salaries and dates of birth, or a map that stores the population and location of cities, or a mesh that stores the Cartesian locations of points. In database terminology, the entries are called records and the attributes are called keys. A collection of records is a file. If there are K keys then one can identify each key with a coordinate direction in Cartesian space. Then each record represents a point in K-dimensional space. Searching a file for records whose keys satisfy certain criteria is a query. A query for which the keys must lie in specified ranges is called an orthogonal range query. This is because each of the ranges correspond to intervals in orthogonal directions. The records which satisfy the criteria lie in a box in K-dimensional space. The process of finding these records is called range searching. For example, one could search for cities which lie between certain coordinates longitude and latitude and have populations between 10,000 and 100,000. This orthogonal range query is depicted in Figure 3.1. The box is projected onto the three coordinate planes.
46 Longitude Latitude
Population
Figure 3.1: An orthogonal range query for cities.
3.1.1
Example Application: CPT on an Irregular Mesh
Many query problems can be aided by using orthogonal range queries. Consider a file which holds points in 3-D space. Suppose we wish to find the points which lie inside a polyhedron. The brute force approach would be to check each point to see if it is inside. An efficient algorithm would make a bounding box around the polyhedron. To check if a point is inside the polyhedron, one would first check that it is inside the bounding box since that is a much simpler test. In this way one could rule out most of the points before doing the complicated test to see which points are inside the polyhedron. A better approach (for most scenarios) would be to do an orthogonal range query to determine which points lie inside the bounding box. Then one could do the more detailed check on those points. (More generally, one could compute a set of boxes that together contain the polyhedron. This would be more efficient if the volume of the bounding box were much greater than the volume of the polyhedron.) Consider computing the closest point transform presented in Part 2 not on the points of a regular grid, but on the points of an irregular mesh (perhaps the vertices of a tetrahedral mesh). To do this one would have to do polyhedron scan conversion for these irregularly spaced points. That is, given a characteristic polyhedron of a
47 face, edge or vertex, we must determine which mesh points are inside. This can be implemented efficiently using orthogonal range queries.
3.1.2
Example Application: Contact Detection
In this section we consider the finite deformation contact problem for finite element meshes. A detailed account of this problem is given in [20]. We will follow the treatment in [1]. Consider a finite element tetrahedron mesh modeling an object (or objects). The boundary of this mesh is a triangle mesh that comprises the surface of the object. The vertices on the surface are called contact nodes and the triangle faces on the surface are called contact surfaces. During the course of a simulation the object may come in contact with itself or other objects. Unless restoring forces are applied on the boundary, the objects will inter-penetrate. In order to prevent this, the contact constraint is applied at the contact nodes. Contact forces are applied to those nodes that have penetrated contact surfaces. Below is an outline of a time step in the simulation. 1. Define the contact surface. 2. Predict the location of nodes assuming no contacts by integrating the equations of motion. 3. Search for potential contacts between nodes and surfaces. 4. Perform a detailed contact check on the potential contacts. 5. Enforce the contacts by applying forces to remove the overlap. The contact search in step 3 is the most time consuming part of the contact detection algorithm. At each time step, each triangle face on the surface is displaced. Nodes which are close to volumes swept out by this motion could potentially contact the surface. One can find these nodes with the following three steps. 1) Compute a bounding box around the two positions (the position at the beginning of the time step and the predicted position at the end of the time step) of the contact surface.
48 bounding box capture box
node on surface
surface at time t predicted position at t+dt
Figure 3.2: Contact search for a face. The orthogonal range query returns the nodes in the capture box.
surface at time t surface at time t+dt
node at time t+dt node at time t
Figure 3.3: The contact check for a single contact surface and node. The node penetrates the face. 2) Enlarge the bounding box to account for motion of the nodes. This is called the capture box. 3) Perform an orthogonal range query on the surface nodes to find those in the capture box. The contact search is depicted in Figure 3.2. Following the contact search, the detailed contact check, step 4, is performed on the potential contacts. In this step, contact is detected by determining if the node penetrates the contact surface during the time step. This is depicted in Figure 3.3. Since the contact search is the most time consuming part of contact detection, the performance of the algorithm depends heavily on efficient methods for doing orthogonal range queries. The contact detection problem has more structure than many orthogonal range query problems. Firstly, there are many range queries. Since
49 there is a query for every face, the number of orthogonal range queries is of the same order as the number of nodes. Secondly, the problem is dynamic. At each time step, the nodes and faces move a small amount. From one time step to the next, the nodes and ranges are slightly different. We will first consider the problem of doing a single range query, noting which methods are easily adapted to dynamic problems. For this we will collect and compare previously developed algorithms and data structures. Then we will consider the problem of performing a set of orthogonal range queries. The multiple query problem has not previously been studied.
3.2
Range Queries
As a stepping stone to orthogonal range queries in K-dimensional space, we consider the problem of 1-D range queries. We will analyze the methods for doing range queries and see which ideas carry over well to higher dimensions. Consider a file of N records. Some of the methods will require only that the records are comparable. Other methods will require that the records can be mapped to numbers so that we can use arithmetic methods to divide or hash them. In this case, let the records lie in the interval [α..β]. We wish to do a range query for the interval [a..b]. Let there be I records in the query range. We introduce the following notations for the complexity of the algorithms. • Preprocess(N ) denotes the preprocessing time to build the data structures. • Reprocess(N ) denotes the reprocessing time. That is if the records change by small amounts, Reprocess(N ) is the time to rebuild or repair the data structures. • Storage(N ) denotes the storage required by the data structures. • Query(N, I) is the time required for a range query if there are I records in the query range. For some methods, Query() will depend upon additional parameters.
50 • For some data structures, the average case performance is much better than the worst-case complexity. Let AverageQuery(N, I) denote the average case performance.
3.2.1
Sequential Scan
The simplest approach to the range query problem is to examine each record and test if it is in the range. Below is the sequential scan algorithm [4]. (Functions for performing range queries will have the RQ prefix.)
RQ sequential scan( file, range ): included records = ∅ for record in file: if record ∈ range: included records + = record return included records The algorithm has the advantage that it is trivial to implement and trivial to adapt to higher dimensions and dynamic problems. However, the performance is acceptable only if the file is small or most of the records lie in the query range. Preprocess = O(N ),
3.2.2
Reprocess = 0,
Storage = O(N ),
Query = O(N )
Binary Search on Sorted Data
If the records are sorted, then we can find any given record with a binary search at a cost of O(log N ). To do a range query for the interval [a..b], we use a binary search to find the first record x that satisfies x ≥ a. Then we collect records x in order while x ≤ b. Alternatively, we could also do a binary search to find the last record in the interval. Then we could iterate from the first included record to the last without checking the condition x ≤ b. Either way, the computational complexity of the range query is O(log N + I).
51 To find the first record in the range we use binary search lower bound(). begin and end are random access iterators to the sorted records. The function returns the first iterator whose key is greater than or equal to value. (Note that this binary search is implemented in the C++ STL function std::lower bound() [2].)
binary search lower bound( begin, end, value ): if begin == end: return end middle = (begin + end) / 2 if *middle < value: return binary search lower bound( middle + 1, end, value) else: return binary search lower bound( begin, middle, value ) To find the last record in the range we use binary search upper bound(), which returns the last iterator whose key is less than or equal to value. (This binary search is implemented in the C++ STL function std::upper bound() [2].)
binary search upper bound( begin, end, value ): if begin == end: return end middle = (begin + end) / 2 if value < *middle: return binary search lower bound( begin, middle, value ) else: return binary search lower bound( middle + 1, end, value) Below are the two methods of performing a range query with a binary search on sorted records. If the number of records in the interval is small, specifically I � log N then RQ binary search single will be more efficient. RQ binary search double has better performance when there are many records in the query range.
52
RQ binary search single( sorted records, range = [a..b] ): included records = ∅ iter = binary search lower bound( sorted records.begin, sorted records.end, a ) while *iter ≤ b: included records + = iter ++iter return included records
RQ binary search double( sorted records, range = [a..b] ): included records = ∅ begin = binary search lower bound( sorted records.begin, sorted records.end, a ) end = binary search upper bound( sorted records.begin, sorted records.end, b ) for iter in [begin..end): included records + = iter return included records The preprocessing time is O(N log N ) because the records must be sorted. The reprocessing time is O(N ), because a nearly sorted sequence can be sorted in linear time with insertion sort [9]. The storage requirement is linear because the data structure is simply an array of pointers to the records. Preprocess = O(N log N ), Storage = O(N ),
3.2.3
Reprocess = O(N ),
Query = O(log N + I)
Trees
The records in the file can be stored in a binary search tree data structure [4] [9]. The records are stored in the leaves. Each branch of the tree has a discriminator. Records with keys less than the discriminator are stored in the left branch, the other records
53 are stored in the right branch. There are a couple of sensible criteria for determining a discriminator which splits the records. We can split by the median, in which case half the records go to the left branch and half to the right. We recursively split until we have no more than a certain number of records. Let this number be leaf size. These records, stored in a list or an array, make up a leaf of the tree. The depth of the tree depends only on the number of records. We can also choose the discriminator to be the midpoint of the interval. If the records span the interval [α..β] then all records x that satisfy x < (α + β)/2 go to the left branch and the other records go to the right. Again, we recursively split until there are no more than leaf size records at which point we store the records in a leaf. Note that the depth of the tree depends on the distribution of the records. Below is the code for constructing a binary search tree. The function returns the root of the tree.
tree make( records ): if records.size ≤ leaf size: Make a leaf. leaf.insert( records ) return leaf else: Make a branch. Choose the branch.discriminator. left records = { x ∈ records | x < discriminator } branch.left = tree make( left records ) right records = { x ∈ records | x ≥ discriminator } branch.right = tree make( right records ) return branch We now consider range queries on records stored in binary search trees. Given a branch and a query range [a..b], the domain of the left sub-tree overlaps the query
54 range if the discriminator is greater than or equal to a. In this case, the left sub-tree is searched. If the discriminator is less than or equal to b, then the domain of the right sub-tree overlaps the query range and the right sub-tree must be searched. This gives us a prescription for recursively searching the tree. When a leaf is reached, the records are checked with a sequential scan. RQ tree() performs a range query when called with the root of the binary search tree.
RQ tree( node, range = [a..b] ): if node is a leaf: return RQ sequential scan( node.records, range ) else: included records = ∅ if node.discriminator ≥ a: included records + = RQ tree( node.left, range ) if node.discriminator ≤ b: included records + = RQ tree( node.right, range ) return included records If the domain of a leaf or branch is a subset of the query range then it is not necessary to check the records for inclusion. We can simply report all of the records in the leaf or sub-tree. (See the tree report() function below.) This requires that we store the domain at each node (or compute the domain as we traverse the tree). The RQ tree domain() function first checks if the domain of the node is a subset of the query range and if not, then checks if the domain overlaps the query range.
tree report( node ): if node is a leaf: return node.records else: return (tree report( node.left ) + tree report( node.right ) )
55
RQ tree domain( node, range = [a..b] ): if node.domain ⊆ range: return tree report( node ) else: if node is a leaf: return RQ sequential scan( node.records, range ) else: included records = ∅ if node.discriminator ≥ a: included records + = RQ tree( node.left, range ) if node.discriminator ≤ b: included records + = RQ tree( node.right, range ) return included records RQ tree() and RQ tree domain() have the same computational complexity. The former has better performance when the query range contains few records. The latter performs better when the number of records in the range is larger than leaf size. For median splitting, the depth of the tree depends only on the number of records. The computational complexity depends only on the total number of records, N , and ˜ the number of records which are reported or checked for inclusion, I. Preprocess = O(N log N ), Storage = O(N ),
Reprocess = O(N ),
˜ Query = O(log N + I)
For midpoint splitting, the depth of the tree D depends on the distribution of records. Thus the computational complexity depends on this parameter. The average case performance of a range query is usually much better than the worst-case
56 computational complexity. Preprocess = O((D + 1)N ),
Reprocess = O((D + 1)N ),
Query = O(N ),
3.2.4
Storage = O((D + 1)N ),
˜ AverageQuery = O(D + I)
Cells or Bucketing
We can apply a bucketing strategy to the range query problem [4]. Consider a uniform partition of the interval [α..β] with the points x0 , . . . , xM . x0 = α,
xM > β,
xm+1 − xm =
xM − x0 M
The mth cell (or bucket) Cm holds the records in the interval [xm ..xm+1 ). We have an array of M cells, each of which holds a list or an array of the records in its interval. We can place a record in a cell by converting the key to a cell index. Let the cell array data structure have the attribute min which returns the minimum key in the interval α and the attribute delta which returns the size of a cell. The process of putting the records in the cell array is called a cell sort.
cell sort( cells, file ): for record in file: cells[key to cell index( cells, record.key )] + = record
key to cell index( cells, key ): return b(key - cells.min) / cells.deltac We perform a range query by determining the range of cells [i..j] whose intervals overlap the query range [a..b]. Let J be the number of overlapping cells. The contents of the cells in the range [i + 1..j − 1] lie entirely in the query range. The contents of the two boundary cells Ci and Cj lie partially in the query range. We must check the records in these two cells for inclusion in the query range.
57
RQ cell( cells, range = [a .. b] ): included records = ∅ i = key to cell index(cells, a) j = key to cell index(cells, b) for x in cells[i]: if x ≥ a: included records + = x for k in [i+1 .. j-1]: for x in cells[k]: included records + = x for x in cells[j]: if x ≤ b: included records + = x return included records The preprocessing time is linear in the number of records N and the number of cells M and is accomplished by a cell sort. Reprocessing is done by scanning the contents of each cell and moving records when necessary. Thus reprocessing has linear complexity as well. Since the data structure is an array of cells each containing a list or array of records, the storage requirement is O(N + M ). Let I˜ be the number records in the J cells that overlap the query range. The computational complexity of ˜ If the cell size is no larger than the query range, then we expect a query is O(J + I). that I˜ ≈ I. If the number of records is greater than the number of cells, then the expected computational complexity is O(I). Preprocess = O(N + M ),
Reprocess = O(N + M ),
˜ Query = O(J + I),
Storage = O(N + M ),
AverageQuery = O(I)
58
3.3
Orthogonal Range Queries
In this section we develop methods for doing orthogonal range queries in K-dimensional space as extensions of the methods for doing 1-D range queries. We will consider several standard methods. In addition, we introduce a new method of using cells coupled with a binary search. The execution time and memory usage of tree methods and cell methods depend on the leaf size and cell size, respectively. For these methods we will examine their performance in 3-D on two test problems.
3.3.1
Test Problems
The records in our test problems are points in 3-D. We do an orthogonal range query around each record. The query range is a small cube. 3.3.1.1
Chair
For the chair problem, the points are vertices in the surface mesh of a chair. See Figure 3.4 for a plot of the vertices in a low resolution mesh. For the tests in this section, the mesh has 116, 232 points. There is unit spacing between adjacent vertices. The query size is 8 in each dimension. The orthogonal range queries return a total of 11, 150, 344 records. 3.3.1.2
Random Points
For the random points problem, the points are uniformly randomly distributed in the unit cube, [0..1]3 . There are 100, 000 points. To test the effect of varying the leaf size or cell size, the query range will have a size of 0.1 in each dimension. For this case, the orthogonal range queries return a total of 9, 358, 294 records. To show how the best leaf size or cell size varies with different query ranges, we will use ranges which vary in size from 0.01 to 0.16.
59
Figure 3.4: Points in the surface mesh of a chair. 7200 points.
60
3.3.2
Sequential Scan
The simplest approach to the orthogonal range query problem is to examine each record and test if it is in the range. Below is the sequential scan algorithm.
ORQ sequential scan( file, range ) included records = ∅ for record in file: if record ∈ range: included records + = record return included records The sequential scan algorithm is implemented by storing pointers to the records in an array or list. Thus the preprocessing time and storage complexity is O(N ). Since each record is examined once during an orthogonal range query, the complexity is O(N ). The performance of the sequential scan algorithm is acceptable only if the file is small. However, the sequential scan (or a modification of it) is used in all of the orthogonal range query algorithms to be presented. Preprocess = O(N ),
3.3.3
Reprocess = 0,
Storage = O(N ),
Query = O(N )
Projection
We extend the idea of a binary search on sorted data presented in Section 3.2.2 to higher dimensions. We simply sort the records in each dimension. Let sorted[k] be an array of pointers to the records, sorted in the k th dimension. This is called the projection method because the records are successively projected onto each coordinate axis before each sort. Doing a range query in one coordinate direction gives us all the records that lie in a slice of the domain. This is depicted in three dimensions in Figure 3.5. The orthogonal range along with the slices obtained by doing range queries in each direction are shown. To perform an orthogonal range query, we determine the number of records in each slice by finding the beginning and end of the slice with
61
Figure 3.5: The projection method. The query range is the intersection of the three slices. binary searches. Then we choose the slice with the fewest records and perform the sequential scan on those records.
ORQ projection( range ): // Do binary searches in each direction to find the size of the slices. for k ∈ [0..K): slice[k].begin = binary search lower bound( sorted[k].begin, sorted[k].end, range.min[k] ) slice[k].end = binary search upper bound( sorted[k].begin, sorted[k].end, range.max[k] ) smallest slice = slice with the fewest elements. return ORQ sequential scan( smallest slice, range ) The projection method requires storing K arrays of pointers to the records so the storage requirement is O(KN ). Preprocessing is comprised of sorting in each direction and so has complexity O(KN log N ). Reprocessing can be accomplished
62 by insertion sorting [9] the K arrays of pointers to records. Thus it has complexity O(KN ). The orthogonal range query is comprised of two steps: 1) Determine the K slices with 2K binary searches on the the N records at a cost of O(K log N ). 2) Perform a sequential scan on the smallest slice. Thus the computational complexity for a query is O(K log N + smallest slice size). Typically the number of records in the smallest slice is much greater than K log N , so the sequential scan is more costly than the binary searches. Consider the case that the records are uniformly distributed in [0..1]K . The expected distance between adjacent records is of the order N −1/K . Suppose that the query range is small and has length O(N −1/K ) in each dimension. Then the volume of any of the slices is of the order N −1/K and thus contains O(N 1−1/K ) records. The sequential scan on these records will be more costly than the binary searches. Below we give the expected cost for this case. In general, the projection method has acceptable performance only if the total number of records is small or if the number of records in some slice is small.
Preprocess = O(KN log N ),
Reprocess = O(KN ),
Storage = O(KN ),
Query = O(K log N + smallest slice size), � AverageQuery = O K log N + N 1−1/K
3.3.4
Point-in-Box Method
A modification of the projection method was developed by J. W. Swegle. See [1] and [17], where the method has been applied to the contact detection problem. In addition to sorting the records in each coordinate direction, the rank of each record is stored for each direction. When iterating through the records in the smallest slice the rank arrays are used so that one can compare the rank of keys instead of the keys themselves. This allows one to do integer comparisons instead of floating point comparisons. On some architectures, like a Cray Y-MP, this modification will
63 significantly improve performance, on others, like most x86 processors, it has little effect. Also, during the sequential scan step, the records are not accessed, only their ranks are compared. This improves the performance of the sequential scan. The projection method requires K arrays of pointers to records. For the Pointin-Box method, there is a single array of pointers to the records. There are K arrays of pointers to the record pointers which sort the records in each coordinate direction. Finally there are K arrays of integers which hold the rank of each record in the given coordinate. Thus the storage requirement is O((2K +1)N ). The point-in-box method has the same computational complexity as the projection method, but has a higher storage overhead. Below are the methods for initializing the arrays and performing an orthogonal range query.
initialize(): // Initialize the vectors of sorted pointers. for i ∈ [0..num records): for k ∈ [0..K): sorted[k][i] = record pointers.begin + i // Sort in each direction. for k ∈ [0..K): sort by coordinate( sorted[k].begin, sorted[k].end, k ) // Make the rank vectors. for i ∈ [0..num records): for k ∈ [0..K): rank[k][ sorted[k][i] - record pointers.begin ] = i return
ORQ point in box( range ): // Do binary searches in each direction to find the size of the slices. for k ∈ [0..K):
64 slice[k].begin = binary search lower bound( sorted[k].begin, sorted[k].end, range.min[k] ) slice[k].end = binary search upper bound( sorted[k].begin, sorted[k].end, range.max[k] ) rank range.min[k] = slice[k].begin - sorted[k].begin rank range.max[k] = slice[k].end - sorted[k].end smallest slice = slice with the fewest elements. // Do a sequential scan on the smallest slice. included records = ∅ for ptr ∈ [smallest slice.begin .. smallest slice.end): for k ∈ [0..K): record rank[k] = rank[k][*ptr - record pointers.begin] if record rank ∈ rank range: included records + = **ptr return included records
Preprocess = O(KN log N ),
Reprocess = O(KN ),
Query = O(K log N + smallest slice size),
3.3.5
Storage = O((2K + 1)N ),
AverageQuery = O K log N + N 1−1/K
�
Kd-Trees
We generalize the trees with median splitting presented in Section 3.2.3 to higher dimensions. Now instead of a single median, there are K medians, one for each coordinate. We split in the key with the largest spread. (We could use the distance from the minimum to maximum keys or some other measure of how spread out the records are.) The records are recursively split by choosing a key (direction), and putting the records less than the median in the left branch and the other records in the right branch. The recursion stops when there are no more than leaf size records. These records are then stored in a leaf. Figure 3.6 depicts a kd-tree in 2-D with a leaf
65 9 3
5 4
10 8
1
7
1
2 3
6 2
6 4
5
7 8 9
10
Figure 3.6: A kd-tree in 2-D. size of unity. Horizontal and vertical lines are drawn through the medians to show the successive splitting. A kd-tree divides a domain into hyper-rectangles. Note that the depth of the kd-tree is determined by the number of records alone and is dlog2 N e. Below is the function construct(), which constructs the kd-tree and returns its root. Leaves in the tree simply store records. Branches in the tree must store the dimension with the largest spread, split dimension, the median value in that dimension, discriminator, and the left and right sub-trees.
construct( file ): if file.size > leaf size: return construct branch( file ) else: return construct leaf( file )
construct branch( file ): branch.split dimension = dimension with largest spread branch.discriminator = median key value in split dimension left file = records with key < discriminator in split dimension if left file.size > leaf size:
66 branch.left = construct branch( left file ) else: branch.left = construct leaf( left file ) right file = records with key ≥ discriminator in split dimension if right file.size > leaf size: branch.right = construct branch( right file ) else: branch.right = construct leaf( right file ) return branch
construct leaf( file ): leaf.records = file return leaf We define the orthogonal range query recursively. When we are at a branch in the tree, we check if the domains of the left and right sub-trees intersect the query range. We can do this by examining the discriminator. If the discriminator is less than the lower bound of the query range (in the splitting dimension), then only the right tree intersects the query range so we return the ORQ on that tree. If the discriminator is greater than the upper bound of the query range, then only the left tree intersects the query range so we return the ORQ on the left tree. Otherwise we return the union of the ORQ’s on the left and right trees. When we reach a leaf in the tree, we use the sequential scan algorithm to check the records.
ORQ KDTree( node, range ): if node is a leaf: return ORQ sequential scan( node.records, range ) else: if node.discriminator < range.min[node.split dimension]:
67 return ORQ KDTree( node.right, range ) else if node.discriminator > range.max[node.split dimension]: return ORQ KDTree( node.left, range ) else: return ( ORQ KDTree( node.left, range ) + ORQ KDTree( node.right, range ) ) Note that with the above implementation of ORQ’s, every record that is returned is checked for inclusion in the query range with the sequential scan algorithm. Thus the kd-tree identifies the records that might be in the query range and then these records are checked with the brute force algorithm. If the query range contains most of the records, then we expect that the kd-tree will perform no better than the sequential scan algorithm. Below we give an algorithm that has better performance for large queries. As we traverse the tree, we keep track of the domain containing the records in the current sub-tree. If the current domain is a subset of the query range, then we can simply report the records and avoid checking them with a sequential scan. Note that this modification does not affect the computational complexity of the algorithm but it will affect performance. The additional work to maintain the domain will increase the query time for small queries (small meaning that the number of records returned is not much greater than the leaf size). However, this additional bookkeeping will pay off when the query range spans many leaves.
ORQ KDTree domain( node, range, domain ): if node is a leaf: if domain ⊆ range: return node.records else: return ORQ sequential scan( node.records, range ) else: if node.discriminator ≥ range.min[node.split dimension]:
68 domain max = domain.max[node.split dimension] domain.max[node.split dimension] = node.discriminator if domain ⊆ range: included records += report( node.left ) else: included records += ORQ KDTree( node.left, domain, range ) domain.max[node.split dimension] = domain max if node.discriminator ≤ range.max[node.split dimension]: domain min = domain.min[node.split dimension] domain.min[node.split dimension] = node.discriminator if domain ⊆ range: included records += report( node.right ) else: included records += ORQ KDTree( node.right, domain, range ) domain.min[node.split dimension] = domain min return included records The worst-case query time for kd-trees is O(N 1−1/K + I) [4], which is not very encouraging. However, if the query range is nearly cubical and contains few elements the average case performance is much better: Preprocess = O(N log N ),
Reprocess = O(N log N ), Storage = O(N ), � Query = O N 1−1/k + I , AverageQuery = O(log N + I)
Figure 3.7 shows the execution times and storage requirements for the chair problem. The best execution times are obtained for leaf sizes of 4 or 8. There is a moderately high memory overhead for small leaf sizes. For the random points problem, a leaf size of 8 gives the best performance and has a modest memory overhead. In Figure 3.8 we show the best leaf size versus the average number of records in a query for the random points problem. We see that the best leaf size is correlated to the number of records in a query. For small query sizes, the best leaf size is on
69
Kd-tree, Leaf Size, Chair Memory Usage (Mb)
Execution Time (s)
Kd-tree, Leaf Size, Chair 30 20 10 0 2
4
8 16 Leaf Size
32
3 2 1 0
64
2
20 16 12 8 4 0 2
4
8 16 Leaf Size
32
64
8 16 Leaf Size
32
64
Kd-tree, Leaf Size, Random Points Memory Usage (Mb)
Execution Time (s)
Kd-tree, Leaf Size, Random Points
4
3 2 1 0 2
4
8 16 Leaf Size
32
64
Figure 3.7: The effect of leaf size on the performance of the kd-tree for the chair problem and the random points problem.
70
32 16 8 4 10
100
1000
Records per Query
Kd-tree, Best Size Ratio, Random Leaf Size / Query Size
Best Leaf Size
Kd-tree, Best Leaf Size, Random
1.28 0.32 0.08 0.02 10
100
1000
Records per Query
Figure 3.8: The best leaf size as a function of records per query for the kd-tree for the random points problem. The second plot shows the ratio of the number of records per query and the leaf size. the order of the number of records in a query. For larger queries, it is best to choose a larger leaf size. However, the best leaf size is much smaller than the number of records in a query. This leaf size balances the costs of accessing leaves and testing records for inclusion in the range. It reflects that the cost of accessing many leaves is amortized by the structure of the tree.
3.3.6
Quadtrees and Octrees
We can also generalize the trees with midpoint splitting presented in Section 3.2.3 to higher dimensions. Now instead of splitting an interval in two, we split a Kdimensional domain into 2K equal size hyper-rectangles. Each non-leaf node of the tree has 2K branches. We recursively split the domain until there are no more than leaf size records, which we store at a leaf. In 2-D these trees are called quadtrees, in 3-D they are octrees. Figure 3.9 depicts a quadtree. Note that the depth of these trees depends on the distribution of records. If some records are very close, the tree could be very deep. Let D be the depth of the octree. The worst-case query time is as bad as sequential
71
Figure 3.9: A quadtree in 2-D. scan, but in practice the octree has much better performance. Preprocess = O((D + 1)N ), Query = O (N + I)
Storage = O((D + 1)N ),
AverageQuery = O (log N + I)
Figure 3.10 shows the execution times and storage requirements for the chair problem. The best execution times are obtained for a leaf size of 16. There is a high memory overhead for small leaf sizes. For the random points problem, leaf sizes of 8 and 16 give the best performance. The execution time is moderately sensitive to the leaf size. Compared with the kd-tree, the octree’s memory usage is higher and more sensitive to the leaf size. In Figure 3.11 we show the best leaf size versus the average number of records in a query for the random points problem. We see that the best leaf size is correlated to the number of records in a query. The results are similar to those for a kd-tree, but for octrees the best leaf size is a little larger.
3.3.7
Cells
The cell method presented in Section 3.2.4 is easily generalized to higher dimensions [4]. Consider an array of cells that spans the domain containing the records. Each cell spans a rectilinear domain of the same size and contains a list or an array of pointers to the records in the cell. See Figure 3.12 for a representation of a 2-D cell
72
Octree, Leaf Size, Chair Memory Usage (Mb)
Execution Time (s)
Octree, Leaf Size, Chair 8 6 4 2 0 2
4
8 16 Leaf Size
32
10 8 6 4 2 0
64
2
2
4
8 16 Leaf Size
32
8 16 Leaf Size
32
64
Octree, Leaf Size, Random Points Memory Usage (Mb)
Execution Time (s)
Octree, Leaf Size, Random Points 28 24 20 16 12 8 4 0
4
64
8 6 4 2 0 2
4
8 16 Leaf Size
32
64
Figure 3.10: The effect of leaf size on the performance of the octree for the chair problem and the random points problem.
64 32 16 8 4 10 100 1000 Records per Query
Octree, Best Size Ratio, Random Leaf Size / Query Size
Best Leaf Size
Octree, Best Leaf Size, Random 1.28 0.32 0.08 0.02
10 100 1000 Records per Query
Figure 3.11: The best leaf size as a function of records per query for the octree for the random points problem. The second plot shows the ratio of the number of records per query and the leaf size.
73
Figure 3.12: First we depict a 2-D cell array. The 8 × 8 array of cells contains records depicted as points. Next we show an orthogonal range query. The query range is shown as a rectangle with thick lines. There are eight boundary cells and one interior cell. array (also called a bucket array). We cell sort the records by converting their multikeys to cell indices. Let the cell array data structure have the attribute min which returns the minimum multikey in the domain and the attribute delta which returns the size of a cell. Below are the functions for this initialization of the cell data structure.
multikey to cell index( cells, multikey ): for k ∈ [0 .. K): index[k] = b(multikey[k] - cells.min[k]) / cells.delta[k]c return index
cell sort( cells, file ): for record in file: cells[multikey to cell index( cells, record.multikey )] += record
74 An orthogonal range query consists of accessing cells and testing records for inclusion in the range. The query range partially overlaps boundary cells and completely overlaps interior cells. See Figure 3.12. For the boundary cells we must test for inclusion in the range; for interior cells we don’t. Below is the orthogonal range query algorithm.
ORQ cell( cells, range ): included records = ∅ for each boundary cell: for record in boundary cell: if record ∈ range: included records += record for each interior cell: for record in interior cell: included records += record return included records The query performance depends on the size of the cells and the query range. If the cells are too large, the boundary cells will likely contain many records which are not in the query range. We will waste time doing inclusion tests on records that are not close to the range. If the cells are too small, we will spend a lot of time accessing cells. The cell method is particularly suited to problems in which the query ranges are approximately the same size. Then the cell size can be chosen to give good performance. Let M be the total number of cells. Let J be the number of cells which overlap the query range and I˜ be the number of records in the overlapping cells. Suppose that the cells are no larger than the query range and that both are roughly cubical. Let R be the ratio of the length of a query range to the length of a cell in a given coordinate. In this case we expect J ≈ (R + 1)K . The number of records in these cells will be about I˜ ≈ (1 + 1/R)K I, where I is the number of records in the query range. Let AverageQuery be the expected computational complexity for
75 Cell Array, Cell Size, Chair Memory Usage (Mb)
Execution Time (s)
Cell Array, Cell Size, Chair 12 8 4 0 0.5
1
1.5
64 16 4 1
2
0.5
Cell Size / Query Size
2
Cell Array, Cell Size, Random Points Memory Usage (Mb)
Execution Time (s)
1.5
Cell Size / Query Size
Cell Array, Cell Size, Random Points 60 50 40 30 20 10 0 0.5 1 1.5 Cell Size / Query Size
1
8 4 2 1 0.5
2
0.5 1 1.5 Cell Size / Query Size
2
Figure 3.13: The effect of leaf size on the performance of the cell array for the chair problem and the random points problem. this case.
Preprocess = O(M + N ), ˜ Query = O(J + I),
Reprocess = O(M + N ),
Storage = O(M + N ), � AverageQuery = O (R + 1)K + (1 + 1/R)K I
Figure 3.13 shows the execution times and storage requirements for the chair problem. The best execution times are obtained when the ratio of cell length to query range length, R, is between 1/4 and 1/2. There is a large storage overhead for R & 3/8. For the random points problem, the best execution times are obtained when R is between 1/5 and 1/2. There is a large storage overhead for R & 1/5. In Figure 3.14 we show the best cell size versus the query range size for the random points problem. We see that the best cell size is correlated to the query size. For
76
0.03
0.02 0.01
0.04
0.16
Cell Array, Best Size Ratio, Random Cell Size / Query Size
Best Cell Size
Cell Array, Best Cell Size, Random
2 1 0.5 0.25 0.01
Cell Records / Query Records
Query Size
0.04
0.16
Query Size Cell Array, Record Ratio, Random
0.128 0.032 0.008 0.002 10 100 1000 Query Records
Figure 3.14: The first plot shows the best cell size versus the query range size for the cell array on the random points problem. Next we show this data as the ratio of the cell size to the query range size. Finally we plot the average number of records in a cell versus the average number of records returned by an orthogonal range query as a ratio. small query sizes which return only a few records, the best cell size is a little larger than the query size. The ratio of best cell size to query size decreases with increasing query size.
3.3.8
Sparse Cells
Consider the cell method presented in Section 3.3.7. If the cell size and distribution of records is such that many of the cells are empty then the storage requirement for the cells may exceed that of the records. Also, the computational cost of accessing cells may dominate the orthogonal range query. In such cases it may be advantageous to use a sparse cell data structure in which only non-empty cells are stored and use
77
Figure 3.15: A sparse cell array in 2-D. The array is sparse in the x coordinate. Only the non-empty cells are stored. hashing to access cells. As an example, one could use a sparse array data structure. Figure 3.15 depicts a cell array that is sparse in the x coordinate. For cell arrays that are sparse in one coordinate, we can access a cell by indexing an array and then performing a binary search in the sparse direction. The orthogonal range query algorithm is essentially the same as that for the dense cell array. As with dense cell arrays, the query performance depends on the size of the cells and the query range. The same results carry over. However, accessing a cell is more expensive because of the binary search in the sparse direction. One would choose a sparse cell method when the memory overhead of the dense cell method is prohibitive. Let M be the number of cells used with the dense cell method. The sparse cell method has an array of sparse cell data structures. The array spans K − 1 dimensions and thus has size O(M 1−1/K ). The binary searches are performed on the sparse cell data structures. The total number of non-empty cells is bounded by N . Thus the storage requirement is O(M 1−1/K +N ). The data structure is built by cell sorting the records. Thus the preprocessing and reprocessing times are O(M 1−1/K + N ). Let J be the number of non-empty cells which overlap the query range and I˜
78 be the number of records in the overlapping cells. There will be at most J binary searches to access the cells. There are O(M 1/K ) cells in the sparse direction. Thus the ˜ worst-case computational cost of an orthogonal range query is O(J log(M 1/K ) + I). Next we determine the expected cost of a query. Suppose that the cells are no larger than the query range and that both are roughly cubical. Let R be the ratio of the length of a query range to the length of a cell in a given coordinate. In this case J . (R + 1)K . We will have to perform about (R + 1)K−1 binary searches to access these cells. Each binary search will be performed on no more than O(M 1/K ) cells. Thus the cost of the binary searches is O((R + 1)K−1 log(M 1/K )). Excluding the binary searches, the cost of accessing cells is O((R + 1)K ). The number of records in the overlapping cells will be about I˜ . (1 + 1/R)K I, where I is the number of records in the query range. For the interior cells, records are simply returned. For the boundary cells, which partially overlap the query range, the records must be tested for inclusion. These operations add a cost of O((1 + 1/R)K I):
Preprocess = O(M 1−1/K + N ), Storage = O(M 1−1/K + N ),
Reprocess = O(M 1−1/K + N ), ˜ Query = O(J log(M )/K + I),
AverageQuery = O (R + 1)K−1 log(M )/K + (R + 1)K + (1 + 1/R)K I
�
Figure 3.16 shows the execution times and storage requirements for the chair problem. Again the best execution times are obtained when R is between 1/4 and 1/2. The performance of the sparse cell arrays is very close to that of dense cell arrays. The execution times are a little higher than those for dense cell arrays for medium to large cell sizes. This reflects the overhead of the binary search to access cells. The execution times are lower than those for dense cell arrays for small cell sizes. This is due to removing the overhead of accessing empty cells. Figure 3.17 shows the execution times and storage requirements for the random points problem. The execution times are very close to those for the dense cell array. In Figure 3.18 we show the best cell size versus the query range size for the random
79
16 12
Sparse Dense
8 4 0 0.5 1 1.5 Cell Size / Query Size
Sparse Cell Array, Cell Size, Chair Memory Usage (Mb)
Execution Time (s)
Sparse Cell Array, Cell Size, Chair 4 3
Sparse Dense
2 1 0
2
0.5 1 1.5 Cell Size / Query Size
2
Figure 3.16: The effect of leaf size on the performance of the sparse cell array for the chair problem. The first plot shows the execution time in seconds versus R. The second plot shows the memory usage in megabytes versus R. The performance of the dense cell array is shown for comparison.
70 60 50 40 30 20 10 0
Sparse Dense
0.5 1 1.5 Cell Size / Query Size
Sparse Cell Array, Cell Size, Random Memory Usage (Mb)
Execution Time (s)
Sparse Cell Array, Cell Size, Random
2
4 3
Sparse Dense
2 1 0 0.5 1 1.5 Cell Size / Query Size
2
Figure 3.17: The effect of leaf size on the performance of the sparse cell array for the random points problem. The first plot shows the execution time in seconds versus R. The second plot shows the memory usage in megabytes versus R. The performance of the dense cell array is shown for comparison.
80
0.045 0.03 0.02 0.01
0.04
0.16
Sparse Cells, Best Size Ratio, Random Cell Size / Query Size
Best Cell Size
Sparse Cells, Best Cell Size, Random
2 1 0.5 0.25 0.01
Cell Records / Query Records
Query Size
0.04
0.16
Query Size
Sparse Cells, Record Ratio, Random 0.256 0.064 0.016 0.004 10 100 1000 Query Records
Figure 3.18: The first plot shows the best cell size versus the query range size for the sparse cell array on the random points problem. Next we show this data as the ratio of the cell size to the query range size. Finally we plot the average number of records in a cell versus the average number of records returned by an orthogonal range query as a ratio. points problem. We see that the best cell size is correlated to the query size. The results are very similar to those for dense cell arrays. For sparse cell arrays, the best cell size is slightly larger due to the higher overhead of accessing a cell.
3.3.9
Cells Coupled with a Binary Search
One can couple the cell method with other search data structures. For instance, one could sort the records in each of the cells or store those records in a search tree. Most such combinations of data structures do not offer any advantages. However, there are some that do. Based on the success of the sparse cell method, we couple a binary search to a cell array. For the sparse cell method previously presented, there is a
81
Figure 3.19: First we depict a cell array with binary search in 2-D. There are 8 cells which contain records sorted in the x direction. Next we show an orthogonal range query. The query range is shown as a rectangle with thick lines. There are three overlapping cells. dense cell array which spans K − 1 dimensions and a sparse cell structure in the final dimension. Instead of storing sparse cells in the final dimension, we store records sorted in that direction. We can access a record with array indexing in the first K − 1 dimensions and a binary search in the final dimension. See Figure 3.19 for a depiction of a cell array with binary searching. We construct the data structure by cell sorting the records and then sorting the records within each cell. Let the data structure have the attribute min which returns the minimum multikey in the domain and the attribute delta which returns the size of a cell. Let cells be the cell array. Below is the method for constructing the data structure.
multikey to cell index( multikey ): for k ∈ [0..K-1): index[k] = b(multikey[k] - min[k]) / delta[k]c return index
82 construct( file ): for record in file: cells[multikey to cell index( record.multikey )] + = record for cell in cells: sort by last key( cell ) return The orthogonal range query consists of accessing cells that overlap the domain and then doing a binary search followed by a sequential scan on the sorted records in each of these cells. Below is the orthogonal range query method.
ORQ cell binary search( range ): included records = ∅ min index = multikey to index( range.min ) max index = multikey to index( range.max ) for index in [min index..max index]: iter = binary search lower bound( cells[index].begin, cells[index].end, range.min[K-1] ) while (*iter).multikey[K-1] ≤ range.max[K-1]: if *iter ∈ range: included records + = iter return included records As with sparse cell arrays, the query performance depends on the size of the cells and the query range. The same results carry over. The only differences are that the binary search on records is more costly than the search on cells, but we do not have the computational cost of accessing cells in the sparse data structure or the storage overhead of those cells. Let M be the number of cells used with the dense cell method. The cell with binary search method has an array of cells which contain sorted records. This array spans K − 1 dimensions and thus has size O(M 1−1/K ). Thus the storage requirement is O(M 1−1/K + N ). The data structure is built by cell sorting the records
83 and then sorting the records within each cell. We will assume that the records are approximately uniformly distributed. Thus each cell contains O(N/M 1−1/K ) records. Thus each sort of the records in a cell costs O((N/M 1−1/K ) log(N/M 1−1/K )). The preprocessing time is O(M 1−1/K + N + N log(N/M 1−1/K )). We can use insertion sort for reprocessing, so its cost is O(M 1−1/K + N ). Let J be the number of cells which overlap the query range and I˜ be the number of records which are reported or checked for inclusion in the overlapping cells. There will be J binary searches to find the starting record in each cell. Thus the worst-case ˜ computational complexity of an orthogonal range query is O(J log(N/M 1−1/K ) + I). Next we determine the expected cost of a query. Suppose that the cells are no larger than the query range and that both are roughly cubical (except in the binary search direction). Let R be the ratio of the length of a query range to the length of a cell in a given coordinate. In this case J . (R + 1)K−1 . Thus the cost of the binary searches is O((R + 1)K−1 log(N/M 1−1/K )). The number of records in the overlapping cells that are checked for inclusion is about I˜ . (1+1/R)K−1 I, where I is the number of records in the query range. These operations add a cost of O((1 + 1/R)K−1 I):
Preprocess = O(M 1−1/K + N + N log(N/M 1−1/K )),
Reprocess = O(M 1−1/K + N ),
˜ Query = O(J log(N/M 1−1/K ) + I), � � AverageQuery = O (R + 1)K−1 log N/M 1−1/K + (1 + 1/R)K−1 I Storage = O(M 1−1/K + N ),
Figure 3.20 shows the execution times and storage requirements for the chair problem. Like the sparse cell array, the best execution times are obtained when R is between 1/4 and 1/2. The performance of the cell array coupled with a binary search is comparable to that of the sparse cell array. However, it is less sensitive to the size of the cells. Also, compared to sparse cell arrays, there is less memory overhead for small cells. Figure 3.21 shows the execution times and storage requirements for the random points problem. The execution times are better than those for the sparse cell array
84
16 12
Search Sparse
8 4 0 0.5
Cells Binary Search, Cell Size, Chair Memory Usage (Mb)
Execution Time (s)
Cells Binary Search, Cell Size, Chair
1
1.5
2.5
Search Sparse
2 1.5 1 0.5 0
2
0.5
Cell Size / Query Size
1
1.5
2
Cell Size / Query Size
Figure 3.20: The effect of leaf size on the performance of the cell array coupled with binary searches for the chair problem. The first plot shows the execution time in seconds versus R. The second plot shows the memory usage in megabytes versus R. The performance of the sparse cell array is shown for comparison.
70 60 50 40 30 20 10 0
Search Sparse
0.5 1 1.5 Cell Size / Query Size
Cells Binary Search, Cell Size, Random Memory Usage (Mb)
Execution Time (s)
Cells Binary Search, Cell Size, Random
2
2 1.5
Search Sparse
1 0.5 0 0.5 1 1.5 Cell Size / Query Size
2
Figure 3.21: The effect of leaf size on the performance of the cell array coupled with binary searches for the random points problem. The first plot shows the execution time in seconds versus R. The second plot shows the memory usage in megabytes versus R. The performance of the sparse cell array is shown for comparison. and are less dependent on the cell size. Again, there is less memory overhead for small cells. In Figure 3.22 we show the best cell size versus the query range size for the random points problem. Surprisingly, we see that the best cell size for this problem is not correlated to the query size.
85
0.05 0.0475 0.045 0.0425 0.01
0.04
0.16
Query Size
Cells B. S., Best Size Ratio, Random Cell Size / Query Size
Best Cell Size
Cells B. S., Best Cell Size, Random
4 2 1 0.5 0.25 0.01
0.04
0.16
Query Size
Figure 3.22: The first plot shows the best cell size versus the query range size for the cell array coupled with binary searches on the random points problem. Next we show this data as the ratio of the cell size to the query range size.
3.4
Performance Tests over a Range of Query Sizes
By choosing the leaf size or cell size, tree methods and cell methods can be tuned to perform well for a given fixed query size. In this section we well consider how the various methods for doing single orthogonal range queries perform over a range of query sizes. For each test there are one million records. The records are points in 3-D space. The query ranges are cubes.
3.4.1
Randomly Distributed Points in a Cube
The records for this test are uniform randomly distributed points in the unit cube, p [0..1]3 . The query sizes are { 3 1/2n : n ∈ [1..20]} and range in size from about 0.01 to about 0.8. The smallest query range contains about a single record on average. The largest query range contains about half the records. See Figure 3.23. 3.4.1.1
Sequential Scan
Figure 3.24 shows the performance of the sequential scan method. The performance is roughly constant for small and medium sized queries. The execution time is higher for large query sizes for two reasons. Firstly, more records are returned. Secondly, for large query sizes the inclusion test is unpredictable. (If a branching statement is
86
Reported Records
Random Points in a Cube 100000 10000 1000 100 10 1 0.01
0.04 0.16 Query Size
0.64
Figure 3.23: Log-log plot of the average number of records in the query versus the query size for the randomly distributed points in a cube problem. predictable, modern CPU’s will predict the answer to save time. If they guess incorrectly, there is a roll-back penalty.) Still, the performance is only weakly dependent on the query size. There is only a factor of 2 difference between the smallest and largest query. We will see that the sequential scan algorithm performs poorly except for the largest query sizes.
Execution Time (s)
Sequential Scan, Random in Cube 0.25 0.2 0.15 0.1 0.05 0 0.01
0.04 0.16 Query Size
0.64
Figure 3.24: Log-log plot of execution time versus query size for the sequential scan method with the randomly distributed points in a cube problem.
3.4.1.2
Projection Methods
The performance of the projection method and the related point-in-box method are shown in Figure 3.25. They perform much better than the sequential scan method,
87
Execution Time (s)
Projection Methods, Random in Cube 0.16 0.08 0.04 0.02 0.01
Projection Point-In-Box Sequential Scan
0.005 0.01
0.04 0.16 Query Size
0.64
Figure 3.25: Log-log plot of execution time versus query size for the projection method and the point-in-box method with the randomly distributed points in a cube problem. The performance of the sequential scan method is shown for comparison. but we will see that they are not competitive with tree or cell methods. The projection method has slightly lower execution times than the point-in-box method. The benefit of doing integer comparisons is outweighed by the additional storage and complexity of the point-in-box method. 3.4.1.3
Tree Methods
Figure 3.26 shows the performance of the kd-tree data structure. The execution time is moderately sensitive to the leaf size for small queries and mildly sensitive for large queries. As expected, small leaf sizes give good performance for small queries and large leaf sizes give good performance for large queries. The test with a leaf size of 8 has the best overall performance. Figure 3.27 shows the performance of the kd-tree data structure with domain checking. The performance is similar to the kd-tree without domain checking, but is less sensitive to leaf size for small queries. Again, the test with a leaf size of 8 has the best overall performance. Figure 3.28 shows the performance of the octree data structure. In terms of leaf size dependence, the performance is similar to the kd-tree with domain checking,
88 Kd-tree with No Domain Checking, Random Points in a Cube
Execution Time (s)
0.1
0.01
0.001 2 4 8 16 32 64 Sequential Scan
0.0001
0.01
0.02
0.04
0.08 0.16 Query Size
0.32
0.64
Time Per Reported Record (microsec)
Kd-tree with No Domain Checking, Random Points in a Cube 2 4 8 16 32 64
256 128 64 32 16 8 1
10
100
1000
10000
100000
Number of Reported Records
Figure 3.26: Log-log plot of execution time versus query size for the kd-tree without domain checking on the randomly distributed points in a cube problem. The key shows the leaf size. The performance of the sequential scan method is shown for comparison. The second plot shows the execution time per reported record.
89 Kd-tree with Domain Checking, Random Points in a Cube
Execution Time (s)
0.1
0.01
0.001 2 4 8 16 32 64 Sequential Scan
0.0001
0.01
0.02
0.04
0.08 0.16 Query Size
0.32
0.64
Time Per Reported Record (microsec)
Kd-tree with Domain Checking, Random Points in a Cube 2 4 8 16 32 64
256 128 64 32 16 8 4 2 1
10
100
1000
10000
100000
Number of Reported Records
Figure 3.27: Log-log plot of execution time versus query size for the kd-tree with domain checking on the randomly distributed points in a cube problem. The key shows the leaf size. The performance of the sequential scan method is shown for comparison. The second plot shows the execution time per reported record.
90 however the execution times are higher. The test with a leaf size of 16 has the best overall performance. We compare the performance of the tree methods in Figure 3.29. For small queries, the kd-tree method without domain checking gives the best performance. For large queries, domain checking becomes profitable. The kd-tree data structure with domain checking during the query appears to give the best overall performance. 3.4.1.4
Cell Methods
Figure 3.30 shows the performance of the cell array data structure. The execution time is highly sensitive to the cell size for small queries and moderately sensitive for large queries. Small cell sizes give good performance for small queries. For large queries, the best cell size is still quite small. The test with a cell size of 0.02 has the best overall performance. Figure 3.31 shows the performance of the sparse cell array data structure. The performance characteristics are similar to those of the dense cell array, however the execution time is less sensitive to cell size for large queries. The test with a cell size of 0.02 has the best overall performance. Figure 3.32 shows the performance of using a cell array with binary searching. The performance characteristics are similar to those of the dense and sparse cell arrays, however the execution time is less sensitive to cell size. The test with a cell size of 0.01414 has the best overall performance. We compare the performance of the cell methods in Figure 3.33. For small queries, the execution times of the three methods are very close. For large queries, the dense cell array has a little better performance. Thus dense cell arrays give the best overall performance for this test. 3.4.1.5
Comparison
We compare the performance of the orthogonal range query methods in Figure 3.34. We plot the execution times of the best performers from each family of methods. The projection method has relatively high execution times, especially for small query
91 Octree, Random Points in a Cube
Execution Time (s)
0.1
0.01
2 4 8 16 32 64 Sequential Scan
0.001
0.0001 0.01
0.02
0.04
0.08 0.16 Query Size
0.32
0.64
Time Per Reported Record (microsec)
Octree, Random Points in a Cube 2 4 8 16 32 64
512 256 128 64 32 16 8 1
10
100
1000
10000
100000
Number of Reported Records
Figure 3.28: Log-log plot of execution time versus query size for the octree on the randomly distributed points in a cube problem. The key shows the leaf size. The performance of the sequential scan method is shown for comparison. The second plot shows the execution time per reported record.
92 Tree Methods, Random Points in a Cube
Execution Time (s)
0.1
0.01
0.001
kd-tree kd-tree w/ domain checking octree Sequential Scan
0.0001
0.01
0.02
0.04
0.08 0.16 Query Size
0.32
0.64
Tree Methods, Random Points in a Cube Time Per Reported Record (microsec)
512 kd-tree kd-tree w/ domain checking octree
256 128 64 32 16 8 4 2 1
10
100
1000
10000
100000
Number of Reported Records
Figure 3.29: Log-log plot of execution time versus query size for the tree methods on the randomly distributed points in a cube problem. The key indicates the data structure. We show the kd-tree with a leaf size of 8, the kd-tree with domain checking with a leaf size of 8 and the octree with a leaf size of 16. The performance of the sequential scan method is shown for comparison. The second plot shows the execution time per reported record.
93 Cell Array, Random Points in a Cube
Execution Time (s)
0.1
0.01
0.001 0.01 0.01414 0.02 0.02828 0.04 0.05657 0.08 Sequential Scan
0.0001
1e-05 0.01
0.02
0.04
0.08 0.16 Query Size
0.32
0.64
Time Per Reported Record (microsec)
Cell Array, Random Points in a Cube 0.01 0.01414 0.02 0.02828 0.04 0.05657 0.08
1024 512 256 128 64 32 16 8 4 2 1
10
100
1000
10000
100000
Number of Reported Records
Figure 3.30: Log-log plot of execution time versus query size for the cell array on the randomly distributed points in a cube problem. The key shows the cell size. The performance of the sequential scan method is shown for comparison. The second plot shows the execution time per reported record.
94 Sparse Cell Array, Random Points in a Cube
Execution Time (s)
0.1
0.01
0.001
0.01 0.01414 0.02 0.02828 0.04 0.05657 0.08 Sequential Scan
0.0001
0.01
0.02
0.04
0.08 0.16 Query Size
0.32
0.64
Time Per Reported Record (microsec)
Sparse Cell Array, Random Points in a Cube 0.01 0.01414 0.02 0.02828 0.04 0.05657 0.08
1024 512 256 128 64 32 16 8 1
10
100
1000
10000
100000
Number of Reported Records
Figure 3.31: Log-log plot of execution time versus query size for the sparse cell array on the randomly distributed points in a cube problem. The key shows the cell size. The performance of the sequential scan method is shown for comparison. The second plot shows the execution time per reported record.
95 Cell Array with Binary Searching, Random Points in a Cube
Execution Time (s)
0.1
0.01
0.001
0.01 0.01414 0.02 0.02828 0.04 0.05657 0.08 Sequential Scan
0.0001
0.01
0.02
0.04
0.08 0.16 Query Size
0.32
0.64
Time Per Reported Record (microsec)
Cell Array with Binary Searching, Random Points in a Cube 256
0.01 0.01414 0.02 0.02828 0.04 0.05657 0.08
128 64 32 16 8 4 1
10
100
1000
10000
100000
Number of Reported Records
Figure 3.32: Log-log plot of execution time versus query size for the cell array with binary searching on the randomly distributed points in a cube problem. The key shows the cell size. The performance of the sequential scan method is shown for comparison. The second plot shows the execution time per reported record.
96 Cell Methods, Random Points in a Cube
Execution Time (s)
0.1
0.01
0.001
0.0001
Cell Array Sparse Cell Array Cells w/ Binary Searching Sequential Scan 0.01
0.02
0.04
0.08 0.16 Query Size
0.32
0.64
Time Per Reported Record (microsec)
Cell Methods, Random Points in a Cube 128
Cell Array Sparse Cell Array Cells w/ Binary Searching
64 32 16 8 4 2 1
10
100
1000
10000
100000
Number of Reported Records
Figure 3.33: Log-log plot of execution time versus query size for the cell methods on the randomly distributed points in a cube problem. The key indicates the data structure. We show the dense cell array with a cell size of 0.02, the sparse cell array with a cell size of 0.02 and the cell array with binary searching with a cell size of 0.01414. The performance of the sequential scan method is shown for comparison. The second plot shows the execution time per reported record.
97 sizes. The kd-tree without domain checking has good performance for small queries. The kd-tree with domain checking performs well for large queries and has pretty good execution times for small queries as well. The dense cell array method has lower execution times than each of the other methods for all query sizes. It gives the best overall performance for this test.
3.4.2
Randomly Distributed Points on a Sphere
In the test of the previous section the records were distributed throughout the 3-D domain. Now we do a test in which the records lie on a 2-D surface. The records for this test are uniform randomly distributed points on the surface of a sphere with p unit radius. The query sizes are { 1/2n : n ∈ [−2..19]} and range in size from about 0.001 to 2. The query ranges are centered about points on the surface of the sphere. The smallest query range contains about a single record on average. The largest query range contains about 40% of the records. See Figure 3.35. 3.4.2.1
Sequential Scan
Figure 3.36 shows the performance of the sequential scan method. As before, the performance is roughly constant for small and medium sized queries but is higher for large query sizes. 3.4.2.2
Projection Methods
The performance of the projection method and the point-in-box method are shown in Figure 3.37. Again the projection method has slightly lower execution times than the point-in-box method. 3.4.2.3
Tree Methods
Figure 3.38 shows the performance of the kd-tree data structure. The execution time is moderately sensitive to the leaf size for small queries and mildly sensitive for large queries. As before, small leaf sizes give better performance for small queries and large
98 Comparison of ORQ Methods, Random Points in a Cube
Execution Time (s)
0.1
0.01
0.001 Cell Array Kd-tree Kd-tree w/ Domain Checking Projection Sequential Scan
0.0001
0.01
0.02
0.04
0.08 0.16 Query Size
0.32
0.64
Time Per Reported Record (microsec)
Comparison of ORQ Methods, Random Points in a Cube Cell Array Kd-tree Kd-tree w/ Domain Checking
128 64 32 16 8 4 2 1
10
100
1000
10000
100000
Number of Reported Records
Figure 3.34: Log-log plot of execution time versus query size for the orthogonal range query methods on the randomly distributed points in a cube problem. The key indicates the data structure. We show the sequential scan method, the projection method, the kd-tree with a leaf size of 8, the kd-tree with domain checking with a leaf size of 8 and the cell array with a cell size of 0.02. The second plot shows the execution time per reported record.
99
Reported Records
Random Points on a Sphere 100000 10000 1000 100 10 1 0.01 0.1 Query Size
1
Figure 3.35: Log-log plot of the average number of records in the query versus the query size for the randomly distributed points on a sphere problem.
Execution Time (s)
Sequential Scan, Random on Sphere 0.2 0.15 0.1 0.05 0 0.01 0.1 Query Size
1
Figure 3.36: Log-log plot of execution time versus query size for the sequential scan method on the randomly distributed points on a sphere problem. leaf sizes give better performance for large queries. The test with a leaf size of 8 has the best overall performance. Figure 3.39 shows the performance of the kd-tree data structure with domain checking. The performance characteristics are similar to the kd-tree without domain checking. The test with a leaf size of 16 has the best overall performance. Figure 3.40 shows the performance of the octree data structure. The test with a leaf size of 16 has the best overall performance. We compare the performance of the tree methods in Figure 3.41. For small queries, the kd-tree method without domain checking gives the best performance. For large
100
Execution Time (s)
Projection Methods, Random on Sphere 0.1
0.01
Projection Point-In-Box Sequential Scan
0.001
0.01
0.1 Query Size
1
Figure 3.37: Log-log plot of execution time versus query size for the projection method and the point-in-box method on the randomly distributed points on a sphere problem. The performance of the sequential scan method is shown for comparison. queries, domain checking becomes profitable. For medium sized queries, the different methods perform similarly. The kd-tree data structure without domain checking during the query appears to give the best overall performance. 3.4.2.4
Cell Methods
Figure 3.42 shows the performance of the cell array data structure. The execution time is highly sensitive to the cell size. Small cell sizes give good performance for small queries. Medium to large cell sizes give good performance for large queries. The test with a cell size of 0.02 has the best overall performance. Figure 3.43 shows the performance of the sparse cell array data structure. The performance is similar to that of the dense cell array for small queries. The execution time is less sensitive to cell size for large queries. In fact, the performance hardly varies with cell size. The test with a cell size of 0.02 has the best overall performance. Figure 3.44 shows the performance of using a cell array with binary searching. The execution time is moderately sensitive to cell size for small query sizes and mildly sensitive for large queries. The test with a cell size of 0.02 has the best overall performance.
101 Kd-tree with No Domain Checking, Random Points on a Sphere
Execution Time (s)
0.1
0.01
0.001 2 4 8 16 32 64 Sequential Scan
0.0001
1e-05 0.0025
0.01
0.04 0.16 Query Size
0.64
Time Per Reported Record (microsec)
Kd-tree with No Domain Checking, Random Points on a Sphere 2 4 8 16 32 64
128
64
32
16
8 10
100
1000
10000
100000
Number of Reported Records
Figure 3.38: Log-log plot of execution time versus query size for the kd-tree without domain checking data structure on the randomly distributed points on a sphere problem. The key shows the leaf size. The performance of the sequential scan method is shown for comparison. The second plot shows the execution time per reported record.
102 Kd-tree with Domain Checking, Random Points on a Sphere
Execution Time (s)
0.1
0.01
0.001 2 4 8 16 32 64 Sequential Scan
0.0001
1e-05 0.0025
0.01
0.04 0.16 Query Size
0.64
Time Per Reported Record (microsec)
Kd-tree with Domain Checking, Random Points on a Sphere 2 4 8 16 32 64
128 64 32 16 8 4 10
100
1000
10000
100000
Number of Reported Records
Figure 3.39: Log-log plot of execution time versus query size for the kd-tree with domain checking data structure on the randomly distributed points on a sphere problem. The key shows the leaf size. The performance of the sequential scan method is shown for comparison. The second plot shows the execution time per reported record.
103 Octree, Random Points on a Sphere
Execution Time (s)
0.1
0.01
0.001
2 4 8 16 32 64 Sequential Scan
0.0001
0.0025
0.01
0.04 0.16 Query Size
0.64
Time Per Reported Record (microsec)
Octree, Random Points on a Sphere 2 4 8 16 32 64
256 128 64 32 16 8
10
100
1000
10000
100000
Number of Reported Records
Figure 3.40: Log-log plot of execution time versus query size for the octree data structure on the randomly distributed points on a sphere problem. The key shows the leaf size. The performance of the sequential scan method is shown for comparison. The second plot shows the execution time per reported record.
104 Tree Methods, Random Points on a Sphere
Execution Time (s)
0.1
0.01
0.001
0.0001 kd-tree kd-tree w/ domain checking octree Sequential Scan
1e-05 0.0025
0.01
0.04 0.16 Query Size
0.64
Time Per Reported Record (microsec)
Tree Methods, Random Points on a Sphere kd-tree kd-tree w/ domain checking octree
128 64 32 16 8 4 10
100
1000
10000
100000
Number of Reported Records
Figure 3.41: Log-log plot of execution time versus query size for the tree methods on the randomly distributed points on a sphere problem. The key indicates the data structure. We show the kd-tree with a leaf size of 8, the kd-tree with domain checking with a leaf size of 16 and the octree with a leaf size of 16. The performance of the sequential scan method is shown for comparison. The second plot shows the execution time per reported record.
105 Cell Array, Random Points on a Sphere
Execution Time (s)
0.1
0.01
0.001
0.01 0.01414 0.02 0.02828 0.04 0.05657 0.08 Sequential Scan
0.0001
1e-05 0.0025
0.01
0.04 0.16 Query Size
0.64
Cell Array, Random Points on a Sphere Time Per Reported Record (microsec)
1024
0.01 0.01414 0.02 0.02828 0.04 0.05657 0.08
512 256 128 64 32 16 8 4 2 10
100
1000
10000
100000
Number of Reported Records
Figure 3.42: Log-log plot of execution time versus query size for the cell array data structure on the randomly distributed points on a sphere problem. The key shows the cell size. The performance of the sequential scan method is shown for comparison. The second plot shows the execution time per reported record.
106 Sparse Cell Array, Random Points on a Sphere
Execution Time (s)
0.1
0.01
0.001 0.01 0.01414 0.02 0.02828 0.04 0.05657 0.08 Sequential Scan
0.0001
1e-05 0.0025
0.01
0.04 0.16 Query Size
0.64
Time Per Reported Record (microsec)
Sparse Cell Array, Random Points on a Sphere 1024
0.01 0.01414 0.02 0.02828 0.04 0.05657 0.08
512 256 128 64 32 16 8 4 10
100
1000
10000
100000
Number of Reported Records
Figure 3.43: Log-log plot of execution time versus query size for the sparse cell array data structure on the randomly distributed points on a sphere problem. The key shows the cell size. The performance of the sequential scan method is shown for comparison. The second plot shows the execution time per reported record.
107 Cell Array with Binary Searching, Random Points on a Sphere
Execution Time (s)
0.1
0.01
0.001 0.01 0.01414 0.02 0.02828 0.04 0.05657 0.08 Sequential Scan
0.0001
1e-05 0.0025
0.01
0.04 0.16 Query Size
0.64
Time Per Reported Record (microsec)
Cell Array with Binary Searching, Random Points on a Sphere 0.01 0.01414 0.02 0.02828 0.04 0.05657 0.08
64
32
16
8
4 10
100
1000
10000
100000
Number of Reported Records
Figure 3.44: Log-log plot of execution time versus query size for the cell array with binary searching data structure on the randomly distributed points on a sphere problem. The key shows the cell size. The performance of the sequential scan method is shown for comparison. The second plot shows the execution time per reported record.
108 We compare the performance of the cell methods in Figure 3.45. Each method has a cell size of 0.02. For small queries, the cell array with binary searching has the best performance. For large queries, the dense cell array method is a little faster. 3.4.2.5
Comparison
We compare the performance of the orthogonal range query methods in Figure 3.46. We plot the execution times of the best overall performers from each family of methods. The projection method has relatively high execution times, especially for small query sizes. The kd-tree without domain checking has good performance for small queries. There is a performance penalty for domain checking for small queries and a performance boost for large queries. The cell array with binary searching performs better than the dense cell array for small queries. This is because the size of a cell in the dense cell array is much larger than the query size so time is wasted with inclusion tests. The dense cell array has the edge for large queries because the query range spans many cells. For small query sizes, the cell array with binary searching and the kd-tree without domain checking both perform well. For large query sizes the dense cell array performs best, followed by the cell array with binary searching. The cell array with binary searching has the best overall performance for this test.
3.5 3.5.1
Multiple Range Queries Single versus Multiple Queries
To the best of our knowledge, there has not been any previously published work addressing the issue of doing a set of orthogonal range queries. There has been a great deal of work on doing single queries. However, there are no previously introduced algorithms that can perform a set of Q queries in less time than the product of Q and the time of a single query. In this section we will introduce an algorithm for doing multiple 1-D range queries. In the following section we will extend the algorithm to
109 Cell Methods, Random Points on a Sphere
Execution Time (s)
0.1
0.01
0.001
0.0001 Cell Array Sparse Cell Array Cells w/ Binary Searching Sequential Scan
1e-05 0.0025
0.01
0.04 0.16 Query Size
0.64
Time Per Reported Record (microsec)
Cell Methods, Random Points on a Sphere Cell Array Sparse Cell Array Cells w/ Binary Searching
64
32
16
8
4
10
100
1000
10000
100000
Number of Reported Records
Figure 3.45: Log-log plot of execution time versus query size for the cell methods on the randomly distributed points on a sphere problem. The key indicates the data structure. We show the dense cell array, the sparse cell array and the cell array with binary searching, each with a cell size of 0.02. The performance of the sequential scan method is shown for comparison. The second plot shows the execution time per reported record.
110 Comparison of ORQ Methods, Random Points on a Sphere
Execution Time (s)
0.1
0.01
0.001 Cell Array Cells w/ Binary Searching Kd-tree Kd-tree w/ Domain Checking Projection Sequential Scan
0.0001
1e-05 0.0025
0.01
0.04 0.16 Query Size
0.64
Time Per Reported Record (microsec)
Comparison of ORQ Methods, Random Points on a Sphere Cell Array Cells w/ Binary Searching Kd-tree Kd-tree w/ Domain Checking
64
32
16
8
4
10
100
1000
10000
100000
Number of Reported Records
Figure 3.46: Log-log plot of execution time versus query size for the orthogonal range query methods on the randomly distributed points on a sphere problem. The key indicates the data structure. We show the sequential scan method, the projection method, the kd-tree with a leaf size of 8, the kd-tree with domain checking with a leaf size of 16, the cell array with a cell size of 0.02 and the cell array with binary searching with a cell size of 0.02. The second plot shows the execution time per reported record.
111 higher dimensions.
3.5.2
Sorted Key and Sorted Ranges with Forward Searching
In Section 3.2.2 we sorted the file by its keys. The purpose of this was to enable us to use a binary search to find a record. The binary search requires a random access iterator to the records. That is, it can access any record of the file in constant time. Typically this means that the records are stored in an array. Now we introduce a data structure that stores its data in sorted order, but need only provide a forward iterator. A container of this type must provide the attribute begin, which points to the first element and the attribute end, which points to one past the last element. A forward iterator must support the following operations. dereference: *iter returns the element pointed to by iter. increment: ++iter moves iter to the next element. In addition, the forward iterator supports assignment and equality tests. All of the containers in the C++ STL library satisfy these criteria. (See [2] for a description of containers, iterators and the C++ STL library.) We will store pointers to the records in such a container, sorted by key. Likewise for the ranges, sorted by the lower end of each range. Below is the algorithm for doing a set of range queries. The MRQ prefix stands for multiple range queries.
MRQ sorted key sorted range( records, ranges ): initialize( records ) range iter = ranges.begin while range iter 6= ranges.end: included records = RQ forward search( records, *iter ) // Do something with included records ++range iter
112
initialize( container ): container.first in range = container.begin
RQ forward search( records, range ): 1
included records = ∅
2
while ( records.first in range 6= records.end and (*records.first in range).key < range.min ):
3
++records.first in range
4
iter = records.first in range
5
while (*iter).key ≤ range.max:
6
included records + = iter
7
++iter
8
return included records Let there be N elements and Q queries. Let T be the total number of records in
query ranges, counting multiplicities. The computational complexity of doing a set of range queries is O(N + Q + T ). Iterating over the query ranges introduces the O(R) term. Searching for the beginning of each range accounts for O(N ). This occurs on lines 2 and 3 of RQ forward search(). Finally, collecting the included records (lines 4-7) accounts for the O(T ) term. To match the previous notation, let I be the average number of records in a query. The average cost of a single query is O(N/Q + I) The preprocessing time for making the data structure is O(N log N + Q log Q) because the records and query ranges must be sorted. If the records and query ranges change by small amounts, the reprocessing time is O(N + Q) because the records and query ranges can be resorted with an insertion sort. The storage requirement is linear in the number of records and query ranges.
113
Preprocess = O(N log N + Q log Q), Storage = O(N + Q),
3.6 3.6.1
Reprocess = O(N + Q),
Query = O(N/Q + I)
Multiple Orthogonal Range Queries Cells Coupled with Forward Searching
In this section we extend the algorithm for doing multiple 1-D range queries to higher dimensions. Note that one can couple the cell method with other search data structures. For instance, one could sort the records in each of the cells or store those records in a search tree. Most such combinations of data structures do not offer any advantages. However, there are some that do. For example, we coupled a binary search to a cell array. (Section 3.3.9.) For this data structure, we can access a record with array indexing in the first K − 1 dimensions and a binary search in the final dimension. Coupling the forward search of the previous section, which was designed for multiple queries, with a cell array makes sense. The data structure is little changed. Again there is a dense cell array which spans K −1 dimensions. In each cell, we store records sorted in the remaining dimension. However, now each cell has the first in range attribute. In performing range queries, we access records with array indexing in K − 1 dimensions and a forward search in the final dimension. We construct the data structure by cell sorting the records and then sorting the records within each cell. Then we sort the query ranges by their minimum key in the final dimension. Let the data structure have the attribute min which returns the minimum multikey in the domain and the attribute delta which returns the size of a cell. Let cells be the cell array. Below are the functions for constructing and initializing the data structure.
114 construct( file ): for record in file: cells[multikey to cell index( record.multikey )] + = record for cell in cells: sort by last key( cell ) sort by last key( queries ) return
multikey to cell index( multikey ): for k ∈ [0..K-1): index[k] = b(multikey[k] - min[k]) / delta[k]c return index
initialize(): for cell in cells: cell.first in range = cell.begin Each orthogonal range query consists of accessing cells that overlap the domain and then doing a forward search followed by a sequential scan on the sorted records in each of these cells. Below is the orthogonal range query method.
MORQ cell forward search( range ): included records = ∅ min index = multikey to index( range.min ) max index = multikey to index( range.max ) for index in [min index..max index]: cell = cells[index] while ( cell.first in range 6= cell.end and
115 (*cell.first in range).multikey[K-1] < range.min[K-1] ): ++cell.first in range iter = cell.first in range while (*iter).multikey[K-1] ≤ range.max[K-1]: if *iter ∈ range: included records + = iter ++iter return included records As with cell arrays with binary searching, the query performance depends on the size of the cells and the query range. The same results carry over. The only difference is that the binary search on records is replaced with a forward search. If the total number of records in ranges, T , is at least as large as the number of records N , then we expect the forward searching to be less costly. The preprocessing time for the cell array with binary search is O(M 1−1/K + N + N log(N/M 1−1/K )). For the forward search method we must also sort the Q queries, so the preprocessing complexity is O(M 1−1/K + N + N log(N/M 1−1/K ) + Q log Q). The reprocessing time for the cell array with binary search is O(M 1−1/K + N ). If the records and query ranges change by small amounts, we can use insertion sort (combined with cell sort for the records) to resort them. Thus the reprocessing complexity for the forward search method is O(M 1−1/K + N + Q). The forward search method requires that we store the sorted � query ranges. This the storage requirement is O M 1−1/K + N + Q . We will determine the expected cost of a query. Let I the number of records in a single query range. Let J be the number of cells which overlap the query range and I˜ be the number of records which are reported or checked for inclusion in the overlapping cells. There will be J forward searches to find the starting record in each cell. The total cost of the forward searches for all the queries (excluding the cost of starting the search in each cell) is O(N ). Thus the average cost of the forward searching per query is O(J + N/Q). As with the binary search method, we suppose that the cells are no larger than the query range and that both are roughly cubical
116 (except in the forward search direction). Let R be the ratio of the length of a query range to the length of a cell in a given coordinate. In this case J . (R + 1)K−1 . The number of records in the overlapping cells that are checked for inclusion is about I˜ . (1 + 1/R)K−1 I. The inclusion tests add a cost of O((1 + 1/R)K−1 I). Thus the average cost of a single query is O((R + 1)K−1 + N/Q + (1 + 1/R)K−1 I).
� Preprocess = O M 1−1/K + N + N log(N/M 1−1/K ) + Q log Q , � � Reprocess = O M 1−1/K + N + Q , Storage = O M 1−1/K + N + Q , � AverageQuery = O (R + 1)K−1 + N/Q + (1 + 1/R)K−1 I , � TotalQueries = O Q(R + 1)K−1 + N + (1 + 1/R)K−1 T , Figure 3.47 shows the execution times and storage requirements for the chair problem. The performance is similar to the cell array coupled with binary searching. As expected, the execution times are lower, and the memory usage is higher. Because the forward searching is less costly than the binary searching, the forward search method is less sensitive to cell size. It has a larger “sweet spot.” For this test, the best execution times are obtained when R is between 1/8 and 1/2. Figure 3.48 shows the execution times and storage requirements for the random points problem. The execution times are better than those for the cell array with binary searching. This improvement is significant near the sweet spot, but diminishes when the cell size is not tuned to the query size. There is an increase in memory usage from the binary search method. In Figure 3.49 we show the best cell size versus the query range size for the random points problem. As with the cell array with binary searching, we see that the best cell size for this problem is not correlated to the query size.
117
10 8 6 4 2 0
Forward Binary
0.5
Cells Forward Search, Cell Size, Chair Memory Usage (Mb)
Execution Time (s)
Cells Forward Search, Cell Size, Chair
1
1.5
Forward Binary
1 0.5 0
2
0.5
Cell Size / Query Size
1
1.5
2
Cell Size / Query Size
Figure 3.47: The effect of leaf size on the performance of the cell array coupled with forward searches for the chair problem. The first plot shows the execution time in seconds versus R. The second plot shows the memory usage in megabytes versus R. The performance of the cell array coupled with binary searches is shown for comparison.
20 15
Forward Binary
10 5 0 0.5 1 1.5 Cell Size / Query Size
Cells Forward Search, Cell Size, Random Memory Usage (Mb)
Execution Time (s)
Cells Forward Search, Cell Size, Random
2
1
0.5 Forward Binary 0 0.5 1 1.5 Cell Size / Query Size
2
Figure 3.48: The effect of leaf size on the performance of the cell array coupled with forward searches for the random points problem. The first plot shows the execution time in seconds versus R. The second plot shows the memory usage in megabytes versus R. The performance of the cell array coupled with binary searches is shown for comparison.
118
0.035 0.03 0.025 0.01
0.04
0.16
Cells Forward S., Best Size Ratio, Random Cell Size / Query Size
Best Cell Size
Cells Forward S., Best Cell Size, Random
2 1 0.5 0.25 0.01
Query Size
0.04
0.16
Query Size
Figure 3.49: The first plot shows the best cell size versus the query range size for the cell array coupled with forward searches on the random points problem. Next we show this data as the ratio of the cell size to the query range size.
3.6.2
Storing the Keys
The most expensive part of doing the orthogonal range queries with the cell array coupled with forward searching is actually just accessing the records and their keys. This is because the search method is very efficient and the forward search needs to access the records. To cut the cost of accessing the records and their keys, we can store the keys in the data structure. This will reduce the cost of the forward searches and the inclusion tests. However, there will be a substantial increase in memory usage. We will examine the effect of storing the keys. Figure 3.50 shows the execution times and storage requirements for the chair problem. The performance has the same characteristics as the data structure that does not store the keys. By storing the keys, we roughly cut the execution time in half. However, there is a fairly large storage overhead. Instead of just storing a pointer to the record, we store the pointer and three keys. In this example, the keys are double precision numbers. Thus the memory usage goes up by about a factor of seven. If the keys had been integers or single precision floats, the increase would have been smaller. Figure 3.51 shows the execution times and storage requirements for the random points problem. Again we see that storing the keys improves the execution time at
119
10 8 6 4
Store Keys Look Up Keys
2 0 0.5
Cells F. S. Store Keys, Cell Size, Chair Memory Usage (Mb)
Execution Time (s)
Cells F. S. Store Keys, Cell Size, Chair
1
1.5
4 3
Store Keys Look Up Keys
2 1 0
2
0.5
Cell Size / Query Size
1
1.5
2
Cell Size / Query Size
Figure 3.50: The effect of leaf size on the performance of the cell array that stores keys and uses forward searches for the chair problem. The first plot shows the execution time in seconds versus R. The second plot shows the memory usage in megabytes versus R. The performance of the data structure that does not store the keys is shown for comparison.
16 12
Store Keys Look Up Keys
8 4 0 0.5 1 1.5 Cell Size / Query Size
Cells F. S. Store Keys, Cell Size, Random Memory Usage (Mb)
Execution Time (s)
Cells F. S. Store Keys, Cell Size, Random
2
3 2
Store Keys Look Up Keys
1 0 0.5 1 1.5 Cell Size / Query Size
2
Figure 3.51: The effect of leaf size on the performance of the cell array coupled with forward searches that stores the keys for the random points problem. The first plot shows the execution time in seconds versus R. The second plot shows the memory usage in megabytes versus R. The performance of the data structure that does not store the keys is shown for comparison. the price of increased memory usage.
3.7
Computational Complexity Comparison
Table 3.1 gives labels to the orthogonal range query methods that we will compare. It also gives a reference to the section in which the method is introduced. Related
120 label seq. scan projection pt-in-box kd-tree kd-tree d. octree cell sparse cell cell b. s. cell f. s. cell f. s. k.
description sequential scan projection point-in-box kd-tree kd-tree with domain checking octree cell array sparse cell array cell array with binary search cell array with forward search cell array with forward search on keys
reference 3.3.2 3.3.3 3.3.4 3.3.5 3.3.5 3.3.6 3.3.7 3.3.8 3.3.9 3.6.1 3.6.2
Table 3.1: Labels and references for the orthogonal range query methods. Method seq. scan projection pt-in-box kd-tree kd-tree d. octree cell sparse cell cell b. s. cell f. s. cell f. s. k.
Expected Complexity of ORQ N K log N + N 1−1/K K log N + N 1−1/K log N + I log N + I log N + I (R + 1)K + (1 + 1/R)K �I (R + 1)K−1 log M 1/K + (R + 1)K + (1 + 1/R)K I � (R + 1)K−1 log N/M 1−1/K + (1 + 1/R)K−1 I (R + 1)K−1 + N/Q + (1 + 1/R)K−1 I (R + 1)K−1 + N/Q + (1 + 1/R)K−1 I
Storage N KN (2K + 1)N N N (D + 1)N M +N M 1−1/K + N M 1−1/K + N M 1−1/K + N M 1−1/K + N
Table 3.2: Computational complexity and storage requirements for the orthogonal range query methods. methods are grouped together. Table 3.2 lists the expected computational complexity for an orthogonal range query and the storage requirements of the data structure for each of the presented methods. We consider the case that the query range is small and cubical. To review the notation: There are N records in K-dimensional space. There are I records in the query range. There are M cells in the dense cell array method. R is the ratio of the length of a query range to the length of a cell in a given coordinate. The depth of the octree is D. For multiple query methods, Q is the number of queries.
121 The sequential scan is the brute force method and is rarely practical. For the projection and point-in-box methods the N 1−1/K term, which is the expected number of records in a slice, typically dominates the query time. This strong dependence on N means that the projection methods are usually suitable when the number of records is small. The projection methods also have a fairly high storage overhead, storing either K or 2K + 1 arrays of length N . Although the leaf size does not appear in the computational complexity or storage complexity, choosing a good leaf size is fairly important in getting good performance from tree methods. Dense cell array methods are attractive when the distribution of records is such that the memory overhead of the cells is not too high. A uniform distribution of records would be the best case. If one can afford the memory overhead of cells, then one can often choose a cell size that balances the cost of cell accesses, O((R+1)K ), and inclusion tests, O((1 + 1/R)K I), to obtain a method that is close to linear complexity in the number of included records. If the dense cell array method requires too much memory, then a sparse cell array or a cell array coupled with a binary search on records may give good performance. Both use a binary search; the former to access cells and the latter to � access records. Often the cost of the binary searches, (O((R + 1)K−1 log M 1/K ) � and O((R + 1)K−1 log N/M 1−1/K ), respectively), is small compared to the costs of the inclusion tests. This is because the number of cells, O(M 1/K ), or the number of records, O(N/M 1−1/K ), in the search is small. For multiple query problems, if the total number T of records in query ranges is at least as large as the number of records N then a cell array coupled with forward searching will likely give good performance. In this case the cost of the searching, O(N/Q), will be small and the cell size can be chosen to balance the cost of accessing cells, O((R + 1)K−1 ), with the cost of inclusion tests, O((1 + 1/R)K−1 I).
122 # records 1,782 7,200 28,968 116,232 465,672 1,864,200 # returned 65,412 265,104 864,296 3,192,056 12,220,376 47,768,216 Table 3.3: The total number of records returned by the orthogonal range queries for the chair problems.
3.8
Performance Tests for Multiple Queries over a Range of File Sizes
3.8.1
Points on the Surface of a Chair
We consider the chair data set, introduced in Section 3.3.1. By refining the surface mesh of the chair, we vary the number of records from 1, 782 to 1, 864, 200. There is unit spacing between adjacent records. We perform a cubical orthogonal range query of size 4 around each record. Table 3.3 shows the total number of records returned for the six tests. Table 3.4 shows the execution times for the chair problems. The leaf sizes and cell sizes are chosen to minimize the execution time. The memory usage is shown in Table 3.5. An entry of “o.t.” indicates that the test exceeded the time limit. An entry of “o.m.” means out of memory. (Note that the kd-tree method with domain checking has the same memory usage as the kd-tree method without domain checking as the data structure is the same.) Figure 3.52 shows the execution times and memory usage for the various methods. First consider the tree methods. The octree has significantly lower execution times than the kd-tree methods. It performs the orthogonal range queries in less than half the time of the kd-tree methods. This is because the records are regularly spaced. Having regularly spaced records avoids the primary problem with using octrees: the octree may be much deeper than a kd-tree. However, memory usage is a different story. The octree uses about four times the memory of the kd-tree methods. Next consider the cell methods. The dense cell array has reasonable execution times, but the the memory usage increases rapidly with the problem size. Recall that
123
# records 1,782 7,200 28,968 116,232 465,672 1,864,200 seq. scan 0.195 3.453 98.72 o.t. o.t. o.t. projection 0.061 0.480 3.86 33.01 322.0 o.t. pt-in-box 0.045 0.366 2.94 25.78 205.9 o.t. kd-tree 0.081 0.383 1.94 9.58 46.7 o.t. kd-tree d. 0.101 0.475 2.50 12.66 63.0 o.t. octree 0.035 0.164 0.78 3.12 13.4 56 cell 0.024 0.102 0.37 1.41 5.6 o.m. sparse cell 0.025 0.108 0.40 1.50 5.9 25 cell b. s. 0.028 0.121 0.49 1.89 8.1 34 cell f. s. 0.019 0.081 0.31 1.24 5.0 21 cell f. s. k. 0.013 0.055 0.23 0.93 3.8 17 Table 3.4: The total execution time for the orthogonal range queries for the chair problem with a query size of 4.
# records seq. scan projection pt-in-box kd-tree octree cell sparse cell cell b. s. cell f. s. cell f. s. k.
1,782 7,140 21,420 49,980 17,416 62,708 32,328 14,360 8,836 16,764 63,132
7,200 28,968 116,232 465,672 1,864,200 28,812 115,884 o.t. o.t. o.t. 86,436 347,652 1,394,820 5,588,100 o.t. 201,684 811,188 3,254,580 13,038,900 o.t. 69,808 279,760 1,120,336 4,484,176 o.t. 272,212 1,160,492 4,520,452 17,979,204 72,681,460 206,412 1,446,540 10,760,556 82,850,988 o.m. 63,088 252,976 1,013,680 4,058,800 16,243,888 34,684 137,884 550,300 2,199,196 8,793,244 66,372 264,708 1,057,860 4,230,084 16,918,212 252,168 1,009,224 4,039,272 16,163,112 64,665,768
Table 3.5: The memory usage of the data structures for the chair problem.
124 Comparison for Different File Sizes, Chair Problems Time per Reported Record (microsec)
32 seq. scan projection pt-in-box kd-tree kd-tree d. octree cell sparse cell cell b. s. cell f. s. cell f. s. k.
16 8 4 2 1 0.5 0.25 100000 1e+06 1e+07 Number of Reported Records Comparison for Different File Sizes, Chair Problems
Memory per Record (bytes)
40
seq. scan projection pt-in-box kd-tree kd-tree d. octree cell sparse cell cell b. s. cell f. s. cell f. s. k.
32
24
16
8
0 10000
100000
1e+06
Number of Records in File
Figure 3.52: Log-log plots of the execution times versus the number of reported records and the memory usage versus the number of records in the file for each of the orthogonal range query methods on the chair problems. The execution time is shown in microseconds per returned record. The memory usage is shown in bytes per record.
125 the cell size is chosen to minimize execution time. Following this criterion, the dense cell array runs out of memory for the largest test case. The execution times of the sparse cell array are close to those of the dense cell array. However, it uses much less memory. Like the rest of the cell methods, the memory usage is proportional to the problem size. The cell array with binary searches has higher execution times than the other cell methods but has the lowest memory requirements. The cell array with forward searching has lower execution times than than above methods. Its memory usage is about the same as the sparse cell array. Finally, storing the keys with the cell array coupled with forward searching gives the lowest execution times at the price of a higher memory overhead. Among the tree methods, the octree offered the lowest execution times. For cell methods, the sparse cell array and the cell array with forward searching have good performance. These two cell methods perform significantly better than the octree. The cell methods do the queries in about half the time of the octree method and use one quarter of the memory. The cell array with forward searching has the lower execution times of the two cell methods.
3.8.2
Randomly Distributed Points in a Cube
We consider the random points data set, introduced in Section 3.3.1. The number of records varies from 100 to 1, 000, 000. We perform cubical orthogonal range queries around each record. The query size is chosen to contain an average of about 10 records. Table 3.3 shows the total number of records returned for the five tests. Table 3.7 shows the execution times for the chair problems. Again, the leaf sizes and cell sizes are chosen to minimize the execution time. The memory usage is shown in Table 3.8. An entry of “o.t.” indicates that the test exceeded the time limit. (The kd-tree method with domain checking has the same memory usage as the kd-tree method without domain checking as the data structure is the same.) Figure 3.53 shows the execution times and memory usage for the various methods. First consider the tree methods. The kd-tree methods have lower execution times
126
# records 100 1,000 10,000 100,000 1,000,000 # returned 886 9,382 102,836 1,063,446 10,842,624 Table 3.6: The total number of records returned by the orthogonal range queries for the random points problems.
# records seq. scan projection pt-in-box kd-tree kd-tree d. octree cell sparse cell cell b. s. cell f. s. cell f. s. k.
100 0.00071 0.00077 0.00061 0.00095 0.00114 0.00079 0.00091 0.00101 0.00088 0.00068 0.00050
1,000 10,000 100,000 1,000,000 0.0683 8.173 o.t. o.t. 0.0281 1.323 104.15 o.t. 0.0254 1.304 112.61 o.t. 0.0154 0.205 3.56 44 0.0187 0.268 4.31 52 0.0212 0.363 7.08 92 0.0135 0.173 3.03 36 0.0146 0.201 3.24 39 0.0109 0.140 1.74 27 0.0082 0.109 1.15 16 0.0054 0.067 0.77 11
Table 3.7: The total execution time for the orthogonal range queries for the random points problem.
# records seq. scan projection pt-in-box kd-tree octree cell sparse cell cell b. s. cell f. s. cell f. s. k.
100 412 1,236 2,884 1,088 4,628 724 928 652 1,124 3,848
1,000 4,012 12,036 28,084 9,168 46,280 5,500 6,400 4,508 8,708 33,608
10,000 40,012 120,036 280,084 121,968 398,488 52,000 57,600 41,708 82,508 326,108
100,000 1,000,000 o.t. o.t. 1,200,036 o.t. 2,800,084 o.t. 1,055,408 9,242,928 3,425,956 30,199,580 527,776 5,245,876 578,112 5,696,368 407,852 4,035,452 811,724 8,053,124 3,229,148 32,132,648
Table 3.8: The memory usage of the data structures for the random points problem.
127 Comparison for Different File Sizes, Random Points Time per Reported Record (microsec)
8
seq. scan projection pt-in-box kd-tree kd-tree d. octree cell sparse cell cell b. s. cell f. s. cell f. s. k.
4
2
1
0.5 1000
10000 100000 1e+06 Number of Reported Records
1e+07
Memory per Record (bytes)
Comparison for Different File Sizes, Random Points seq. scan projection pt-in-box kd-tree kd-tree d. octree cell sparse cell cell b. s. cell f. s. cell f. s. k.
40 32 24 16 8 0 100
1000
10000
100000
1e+06
Number of Records in File
Figure 3.53: Log-log plots of the execution times versus the number of reported records and the memory usage versus the number of records in the file for each of the orthogonal range query methods on the random points problems. The execution time is shown in microseconds per returned record. The memory usage is shown in bytes per record.
128 than the octree method. This result differs from the chair problems, because now the records are not regularly spaced. Where records are close to each other, the octree does more subdivision. Because of the small query size, it is advantageous to not do domain checking in the kd-tree algorithm. Finally, we note that the kd-tree methods use about a third of the memory of the octree. Next consider the cell methods. The dense and sparse cell arrays have the highest execution times, but they have fairly low memory requirements. Since the records are distributed throughout the domain, there are few empty cells, and there is nothing to be gained by using a sparse array over a dense array. However, the penalty for using the sparse array (in terms of increased cell access time and increased memory usage) is small. The cell array with binary searching outperforms the dense and sparse cell arrays. It has lower execution times and uses less memory. The execution times of the cell array with forward searching are lower still. However, storing the sorted queries increases the memory usage. Finally, by storing the keys one can obtain the best execution times at the price of higher memory usage. Among the tree methods, the kd-tree without domain checking offered the best performance. For cell methods, the cell array with binary searching and the cell array with forward searching have low execution times. These two cell methods outperform the kd-tree method. The cell array with binary searching does the queries in about half the time of the kd-tree while using less than the half the memory. The cell array with forward searching has significantly lower execution times than the binary search method, but uses about twice the memory.
3.9
Conclusions
The performance of orthogonal range query methods depends on many parameters: the dimension of the record’s multikey, the number of records and their distribution and the query range. The performance may also depend on additional parameters associated with the data structure, like leaf size for tree methods or cell size for cell methods. Also important are the implementation of the algorithms and the computer
129 architecture. There is no single best method for doing orthogonal range queries. Some methods perform well over a wide range of parameters. Others perform well for only a small class of problems. In this section we will compare the methods previously presented. We will base our conclusions on our numerical experiments. Thus we restrict our attention to records with 3-D multikeys and cubic query ranges. Also, only a few distributions of the records were tested. Finally, note that all codes were implemented in C++ and executed on a 450 MHz i686 processor with 256 MB of memory.
3.9.1
Projection Methods
The projection methods have the advantage that they are relatively easy to implement. The fundamental operations in these methods are sorting an array and doing binary searches on that array. These operations are in many standard libraries. (The C++ STL library provides this functionality.) Also, projection methods are easily adaptable to dynamic problems. When the records change, one merely resorts the arrays. However, the projection method and the related point-in-box method usually perform poorly. The execution time does not scale well with the file size, so the methods are only practical for small files. The memory usage of the projection method is moderate. It is typically not much higher than a kd-tree. The point-in-box method has a high memory requirement. Storing the rank arrays in order to do integer comparisons more than doubles the memory usage. Also, on x86 processors, doing integer instead of floating point comparisons usually increases execution time. So the “optimization” of integer comparisons becomes a performance penalty. The projection method typically outperforms the point-in-box method, but neither is recommended for time critical applications.
3.9.2
Tree Methods
Kd-trees usually outperform octrees by a moderate factor. The octree typically has higher execution times and uses several times the memory of a kd-tree. This is
130 because the octree partitions space while the kd-tree partitions the records. The high memory usage of the octree is also a result of storing the domain of each sub-tree. The exception to this rule is when the records are regularly spaced, as in the chair problem. Then the octree may have lower execution times than the kd-tree. The octree is also more easily adapted to dynamic problems than the kd-tree. For kd-trees, it is advantageous to do domain checking during the orthogonal range query only when the query range is large. For small queries, it is best to not do domain checking and thus get faster access to the leaves. For a given problem, kd-trees are typically not the best method for doing orthogonal range queries; there is usually a cell method that has better execution times and uses less memory. However, kd-trees perform pretty well in a wide range of problems and the performance is only moderately sensitive to leaf size.
3.9.3
Cell Methods
The dense cell array method performs very well on problems for which it is well suited. The structure of tree methods amortizes the cost of accessing leaves. The cell array offers constant time access to any cell. If the cell array with cell size chosen to optimize execution time will fit in memory, then the cell array will usually have lower execution times than any tree method. Depending on the number and distribution of the records, the memory usage may be quite low or very high. The performance of cell arrays is fairly sensitive to the cell size. It has been reported [4] that cell arrays are applicable only in situations when the query size is fixed and that in this case the cell size should be chosen to match the query size. This was not the case in our experiments. For the tests in Section 3.4 the cell array with a fixed cell size performed well over a wide range of query sizes. Choosing the best cell size has more to do with the distribution of the records than with the size of the query range. Sparse cell arrays usually have execution times that are almost as low as dense cell arrays. The binary search to access cells has little effect on performance. If the
131 dense cell array has many empty cells, then the sparse cell array may offer significant savings in memory. However, if the records are distributed throughout the domain, using the sparse array structure only increases the memory usage and access time to a cell. Like the dense cell array, the performance of the sparse cell array is fairly sensitive to the cell size. Cell arrays coupled with binary searching are similar in structure to sparse cell arrays. The former searches on records while the latter searches on cells. The execution times are usually comparable with the other cell methods. However, the memory usage is typically lower and the performance is less sensitive to cell size. In fact, the memory usage is often little more than the sequential scan method which stores only a single pointer for each record. It is interesting to note that like the projection methods, there is a binary search on records. However, the projection methods perform this search on the entire file, while the cell array coupled with binary searching searches only within a single cell. The combination of low execution times, low memory usage and insensitivity to cell size make this an attractive method for many problems.
3.9.4
Multiple Queries
For multiple query problems where the total number of records inside query ranges is at least as large as the number records, the cell array coupled with forward searching typically performs very well. To store the records, it uses almost the same data structure as the cell array coupled with binary searching. However, its method of sweeping through the records is more efficient than the binary search. Having to store the queries so that they can be processed in order increases the memory usage from light to moderate. One can moderately decrease the execution time (a factor of 1/3 was common in our tests) by storing the multikeys to avoid accessing the records. However, this does increase the memory usage. Storing the keys is a useful optimization in situations when execution time is critical and available memory is sufficient.
132
Chapter 4 Single-Source Shortest Paths 4.1
Introduction
Consider a weighted, directed graph with V vertices and E edges. Let w be the weight function, which maps edges to real numbers. The weight of a path in the graph is the sum of the weights of the edges in the path. Given a vertex u, some subset of the vertices can be reached by following paths from u. The shortest-path weight from u to v is the minimum weight path over all paths from u to v. A shortest path from vertex u to vertex v is any path that has the minimum weight. Thus the shortest path is not necessarily unique. If there is no path from u to v then one can denote this by defining the shortest-path weight to be infinite. We consider the single-source shortest-paths problem [9]: given a graph and a source vertex we want to find the shortest paths to all other vertices. There are several related shortest-paths problems. For the single-destination shortest-paths problem we want to find the shortest paths from all vertices to a given destination vertex. This problem is equivalent to the single-source problem. Just reverse the orientation of the edges. For the single-pair shortest-path problem we want to find the shortest path from a given source vertex to a given destination vertex. One can solve the single-pair problem by solving the single-source problem. Actually, there are no known single-pair algorithms with lower computational complexity than single-source algorithms. Finally, there is the all-pairs shortest-paths problem. For this we want to find the shortest paths between all pairs of vertices. For dense graphs, one typi-
133 cally solves this problem with the Floyd-Warshall algorithm [9]. For sparse graphs, Johnson’s algorithm [9], which computes the single-source problem for each vertex, is asymptotically faster. If the graph contains negative weight edges, then the shortest path between two connected vertices may not be well defined. This occurs if there is a negative weight cycle reachable between the source and the destination. Then one can construct a path between the source and the destination with arbitrarily low weight by repeating the negative weight cycle. Some shortest-path algorithms, like the Bellman-Ford algorithm, are able to detect negative weight cycles and then indicate that the shortestpaths problem does not have a solution. Other algorithms, like Dijkstra’s algorithm, assume that the edge weights are nonnegative. We will consider only graphs with nonnegative weights. We can represent the shortest-path weights from a given source by storing this value as an attribute in each vertex. The distance of the source is defined to be zero, source.distance = 0, the distance of unreachable vertices is infinite. Some algorithms keep track of the status of the vertices. For the algorithms we will consider, a vertex is in one of three states: KNOWN if the distance is known to have the correct value, LABELED if the distance has been updated from a known vertex and UNLABELED otherwise. The shortest paths form a tree with root at the source. We can represent this tree by having each vertex store a predecessor attribute. The predecessor of a vertex is that vertex which comes directly before it in the shortest path from the source. The predecessor of the source and of unreachable vertices is defined to be the special value NONE. Note that while the shortest distance is uniquely defined, the predecessor is not. This is because there may be multiple shortest paths from the source to a given vertex. Below is the procedure for initializing a graph to solve the single-source shortest-paths problem for a specified source vertex.
initialize( graph, source ):
134 for vertex in graph.vertices: vertex.distance = ∞ vertex.predecessor = NONE vertex.status = UNLABELED source.distance = 0 source.status = KNOWN The algorithms that we will consider generate the shortest paths through a process of labeling. At each stage, the distance attribute of each vertex is an upper bound on the shortest-path weight. If the distance is not infinite, then it is the sum of the edge weights on some path from the source. This approximation of the shortest-path weight is improved by relaxing along an edge. For a known vertex, we see if the distance to its neighbors can be improved by going through its adjacent edges. For a known vertex with an adjacent edge leading to a vertex, if known vertex.distance + edge.weight < vertex.distance then we improve the approximation of vertex.distance by setting it to known vertex.distance + edge.weight. We also update the predecessor attribute. The algorithms proceed by labeling the adjacent neighbors of known vertices and freezing the value of labeled vertices when they are determined to be correct. At termination, the distance attributes are equal to the shortest-path weights. Below is the procedure for labeling a single vertex and the procedure for labeling the neighbors of a known vertex.
label( vertex, known vertex, edge weight ): if vertex.status == UNLABELED: vertex.status = LABELED if known vertex.distance + edge weight < vertex.distance: vertex.distance = known vertex.distance + edge weight vertex.predecessor = known vertex return
135
label adjacent( known vertex ): for each edge of known vertex leading to vertex: if vertex.status 6= KNOWN: label( vertex, known vertex, edge.weight ) return
4.1.1
Test Problems
For the purpose of evaluating the performance of the shortest path algorithms we introduce a few simple test problems for weighted, directed graphs. The first problem is the grid graph. The vertices are arranged in a 2-D rectangular array. Each vertex has four adjacent edges to its neighboring vertices. Vertices along the boundary are periodically connected. Next we consider a complete graph in which each vertex has adjacent edges to every other vertex. Finally, we introduce the random graph. Each vertex has a specified number of adjacent and incident edges. These edges are selected through random shuffles. Figure 4.1 shows examples of the three test problems.
Grid Graph
Complete Graph
Random Graph
Figure 4.1: Examples of the three test problems: A 3 × 3 grid graph, a complete graph with 5 vertices and a random graph with 5 vertices and 2 adjacent edges per vertex are shown. The edge weights are uniformly, randomly distributed on a given interval. We characterize the distributions by the ratio of the upper to lower bound of the interval. For example, edge weights on the interval [1/2..1] have a ratio of R = 2 and edge
136 weights on the interval [0..1] have an infinite ratio, R = ∞.
4.2
Dijkstra’s Greedy Algorithm
Dijkstra’s algorithm [9] [8] solves the single-source shortest-paths problem for the case that the edge weights are nonnegative. It is a labeling algorithm. Whenever the distance of a vertex becomes known, this known vertex labels its adjacent neighbors. The algorithm begins by labeling the adjacent neighbors of the source. The vertices with LABELED status are stored in the labeled set. The algorithm iterates until the labeled set is empty. This occurs when all vertices reachable from the source become KNOWN. At each step of the iteration, the labeled vertex with minimum distance is guaranteed to have the correct distance and a correct predecessor. The status of this vertex is set to KNOWN, it is removed from the labeled set and its adjacent neighbors are labeled. Below is Dijkstra’s algorithm. The extract minimum() function removes and returns the vertex with minimum distance from the labeled set. We postpone the discussion of why the label adjacent() function takes the labeled set as an argument.
Dijkstra( graph, source ): initialize( graph, source ) labeled = ∅ label adjacent( labeled, source ) while labeled 6= ∅: minimum vertex = extract minimum( labeled ) minimum vertex.status = KNOWN label adjacent( labeled, minimum vertex ) return Dijkstra’s algorithm is a greedy algorithm because at each step, the best alternative is chosen. That is, the labeled vertex with the smallest distance becomes known. Now we show how this greedy strategy produces a correct shortest-paths tree. Sup-
137 pose that some of the vertices are known to have the correct distance and that all adjacent neighbors of these known vertices have been labeled. We assert that the labeled vertex v with minimum distance has the correct distance. Suppose that this distance to v is computed through the path source
x → v. (Here
indicates a
(possibly empty) path and → indicates a single edge.) Each of the vertices in the path source u
x is known. We assume that there exists a shorter path, source
y→
v, where y is known and u is labeled, and obtain a contradiction. First note that
all paths from source to v have this form. At some point the path progresses from a known vertex y to a labeled vertex u. Since u is labeled, u.distance ≥ v.distance. Since the edge weights are nonnegative, source
y→u
v is not a shorter path.
We conclude that v has the correct distance. Dijkstra’s algorithm produces a correct shortest-paths tree. After initialization, only the source vertex is known. At each step of the iteration, one labeled vertex becomes known. The algorithm proceeds until all vertices reachable from the source have the correct distance. Figure 4.2 shows an example of using Dijkstra’s algorithm to compute the shortest paths tree. First we show the graph, which is a 3 × 3 grid graph except that the boundary vertices are not periodically connected. In the initialization step, the lower left vertex is set to be the source and its two neighbors are labeled. We show known vertices in black and labeled vertices in red. The current labeling edges are green. Edges of the shortest-paths tree are shown in black, while the predecessor edges for labeled vertices are red. After initialization, there is one known vertex (namely the source) and two labeled vertices. In the first step, the minimum vertex has a distance of 2. This vertex becomes known and the edge from its predecessor is added to the shortest paths tree. Then this vertex labels its adjacent neighbors. In the second step, the three labeled vertices have the same distance. One of them becomes known and labels its neighbors. Choosing the minimum labeled vertex and labeling its neighbors continues until all the vertices are known.
138 2
5
2 5
4
5 5
3
2
5
5
5 4
1 2
4
4
4
3 2
2
3
4
1
4
4
3 0
2
2 3
2
1
0
2
2
The graph
3
2
Initialization
1
Step 1
8
8 4
7 4
3 2
4
4
4
4
4
4
4
4
4
1 4
2
1
2
3
4
2
1
4
2
2
1
3 0
2
3
2
0
2
1
3
2
Step 2
0
2
1
3
2
Step 3
1
Step 4
2 8
7
9
8
7
9
8
7
5 4
3
5
4
5
9
2
3
5
5
4
3
5
5 4
4 4
4 2
0
4
2
4 1
3
2
4 4
4 2
0
1
2
1
3
2
Step 5
4
4 4
2
0
1
Step 6
7 4
9 3
4
5
4 4
5 4
2
0
8
3 1
Step 8
9 3
4 1
2 2
4
5
4 4
4 2
0
1
2 2
3 1
Step 7
7
1
2 2
5 8
4
3 1
The shortest paths tree
Figure 4.2: Dijkstra’s algorithm for a graph with 9 vertices.
139 Now that we have demonstrated the correctness of Dijkstra’s algorithm, we determine the computational complexity. Suppose that we store the labeled vertices in an array or a list. If there are N labeled vertices, the computational complexity of adding a vertex or decreasing the distance of a vertex is O(1). To extract the minimum vertex we examine each labeled vertex for a cost of O(N ). There are V − 1 calls to push() and extract minimum(). At any point in the shortest-paths computation, there are at most V labeled vertices. Hence the push() and extract minimum() operations add a computational cost of O(V 2 ). There are E labeling operations and less than E calls to decrease() which together add a cost of O(E). Thus the computational complexity of Dijkstra’s algorithm using an array or list to store the labeled vertices is O(V 2 + E) = O(V 2 ) Now we turn our attention to how we can store the labeled vertices so that we can more efficiently extract one with the minimum distance. The labeled set is a priority queue [9] that supports three operations: push(): Vertices are added to the set when they become labeled. extract minimum(): The vertex with minimum distance can be removed. decrease(): The distance of a vertex in the labeled set may be decreased through labeling. For many problems, a binary heap [9] is an efficient way to implement the priority queue. Below are new functions for labeling vertices which now take the labeled set as an argument and use the push() and decrease() operations on it.
label adjacent( heap, known vertex ): for each edge of known vertex leading to vertex: if vertex.status 6= KNOWN: label( heap, vertex, known vertex, edge.weight ) return
140
label( heap, vertex, known vertex, edge weight ): if vertex.status == UNLABELED: vertex.status = LABELED vertex.distance = known vertex.distance + edge weight vertex.predecessor = known vertex heap.push( vertex ) else if known vertex.distance + edge weight < vertex.distance: vertex.distance = known vertex.distance + edge weight vertex.predecessor = known vertex heap.decrease( vertex.heap ptr ) return If there are N labeled vertices in the binary heap, the computational complexity of adding a vertex is O(1). The cost of extracting the minimum vertex or decreasing the distance of a vertex is O(log N ). The V − 1 calls to push() and extract minimum() add a computational cost of O(V log V ). There are E labeling operations, O(E), and less than E calls to decrease(), O(E log V ). Thus the computational complexity of Dijkstra’s algorithm using a binary heap is O((V + E) log V ).
4.3
A Greedier Algorithm: Marching with a Correctness Criterion
If one were to solve by hand the single-source shortest-paths problem using Dijkstra’s algorithm, one would probably note that at any given step, most of the labeled vertices have the correct distance and predecessor. Yet at each step only one vertex is moved from the labeled set to the known set. Let us quantify this observation. At each step of Dijkstra’s algorithm (there are always V − 1 steps) we count the number of correct vertices and the total number of vertices in the labeled set. At termination we compute the fraction of vertices that had correct values. The fraction
141 of correct vertices in the labeled set depends on the connectivity of the vertices and the distribution of edge weights. As introduced in Section 4.1.1, we consider grid, random and complete graphs. We consider edges whose weights have a uniform distribution in a given interval. The interval is characterized by the ratio of its upper limit to its lower limit. We consider the ratios: 2, 10, 100 and ∞. The fraction of correctly determined labeled vertices is plotted in Figure 4.3. We see that this fraction depends on the edge weight ratio. This is intuitive. If the edge weights were all unity (or another constant) then we could solve the shortest-paths problem with a breadth first search. At each iteration of Dijkstra’s algorithm, all the labeled vertices would have the correct value. We see that as the edge weight ratio increases, fewer of the labeled vertices are correct, but even when the ratio is infinite a significant fraction of the labeled vertices are correct. These observations motivate us to seek a new algorithm for the single-source shortest-paths problem. Dijkstra’s algorithm is an example of a greedy algorithm. At each iteration the single best choice is taken. The labeled vertex with minimum distance is added to the known set. We seek a greedier algorithm. At each iteration we take as many correct choices as possible. Each labeled vertex that can be determined to have the correct distance is added to the known set. Below is this greedier algorithm.
marching with correctness criterion( graph, source ): graph.initialize( source ) labeled = new labeled = ∅ label adjacent( labeled, source ) // Loop until all vertices have a known distance. while labeled 6= ∅: for vertex in labeled: if vertex.distance is determined to be correct vertex.status = KNOWN
142 Complete Graph Correctly Determined Ratio
Correctly Determined Ratio
Grid Graph 1 0.75 0.5 2 10 100 infinity
0.25 0 100
1600 Number of Vertices
1 0.75 0.5 2 10 100 infinity
0.25 0
25600
10
1 0.75 0.5 2 10 100 infinity
0.25 0 100
400 Number of Vertices
640
Random Graph, 32 Edges Correctly Determined Ratio
Correctly Determined Ratio
Random Graph, 4 Edges
80 Number of Vertices
1600
1 0.75 0.5 2 10 100 infinity
0.25 0 100
400 Number of Vertices
1600
Figure 4.3: Log-linear plots of the ratio of correctly determined vertices to labeled vertices versus the number of vertices in the graph. We show plots for a grid graph where each vertex has an edge to its four adjacent neighbors, a dense graph where each vertex has an edge to every other vertex, a graph where each vertex has edges to 4 randomly chosen vertices and finally a graph where each vertex has edges to 32 randomly chosen vertices. The tests are done for maximum-to-minimum edge weight ratios of 2, 10, 100 and ∞. label adjacent( new labeled, vertex ) // Get the labeled lists ready for the next step. remove known( labeled ) labeled + = new labeled new labeled = ∅ return It is easy to verify that the algorithm is correct. It gives the correct result because only vertices with correct distances are added to the known set. It terminates because at each iteration at least one vertex in the labeled set has the correct distance. We
143 call this algorithm marching with a correctness criterion (MCC). All we lack now is a good method for determining if a labeled vertex is correct. The rest of the algorithm is trivial. We do have one correctness criterion, namely that used in Dijkstra’s algorithm: The labeled vertex with minimum distance is correct. Using this criterion would give us Dijkstra’s algorithm with a list as a priority queue, which has computational complexity O(V 2 ). We turn our attention to finding a better correctness criterion. Assume that some of the vertices are known to have the correct distance and that all adjacent neighbors of known vertices have been labeled. To determine if a labeled vertex is correct, we look at the labeling operations that have not yet occurred. If future labeling operations will not decrease the distance, then the distance must be correct. We formulate this notion by defining a lower bound on the distance of a labeled vertex. The distance stored in a labeled vertex is an upper bound on the actual distance. We seek to define a lower bound on the distance by using the current distance and considering future labeling operations. If the current distance is less than or equal to the lower bound, then the labeled vertex must be correct. We will start with a simple lower bound and then develop more sophisticated ones. Let min unknown be the minimum distance among the labeled vertices. By the correctness criterion of Dijkstra’s algorithm, any labeled vertex with distance equal to min unknown is correct. The simplest lower bound for a labeled vertex is the value of min unknown. We call this the level 0 lower bound. To get a more accurate lower bound, we use information about the incident edges. Let each vertex have the attribute min incident edge weight, the minimum weight over all incident edges. The smaller of vertex.distance and (min unknown + vertex.min incident edge weight) is a lower bound on the distance. We consider why this is so. If the predecessor of this vertex in the shortest-paths tree is known, then it has been labeled from its correct predecessor and has the correct distance. Otherwise, the distance at its correct predecessor is currently not known, but is no less than min unknown. The edge weight from the predecessor is no less than vertex.min incident edge weight. Thus (min unknown + vertex.min incident edge weight)
144 is no greater than the correct distance. We call the minimum of vertex.distance and min unknown + vertex.min incident edge weight) the level 1 lower bound.
lower bound 1( vertex, min unknown ) return min( vertex.distance, min unknown + vertex.min incident edge weight ) If the distance at a labeled vertex is less than or equal to the lower bound on the distance, then the vertex must have the correct distance. This observation allows us to define the level 1 correctness criterion. We define the is correct 1() method for a vertex. For a labeled vertex, it returns true if the current distance is less than or equal to the level 1 lower bound on the distance and false otherwise.
is correct 1( vertex, min unknown, level ) return ( vertex.distance ≤ vertex.lower bound 1( min unknown ) ) Figure 4.4 shows an example of using the MCC algorithm with the level 1 correctness criterion to compute the shortest-paths tree. First we show the graph, which is a 4 × 4 grid graph except that the boundary vertices are not periodically connected. In the initialization step, the lower, left vertex is set to be the source and its two neighbors are labeled. We show known vertices in black and labeled vertices in red. The labeling operations are shown in green. Edges of the shortest paths tree are shown in black, while the predecessor edges for labeled vertices are red. After initialization, there is one known vertex (namely the source) and two labeled vertices. Depictions of applying the correctness criterion are shown in blue. (Recall that the level 1 correctness criterion uses the minimum incident edge weight and the minimum labeled vertex distance to determine if a labeled vertex is correct.) Since future labeling operations will not decrease their distance, both labeled vertices become known in the first step. After labeling their neighbors, there are three labeled vertices in step 1. The correctness criterion shows that the vertices with distances 3 and 4 will not
145 be decreased by future labeling operations, thus they are correct. However, the correctness criterion does not indicate that the labeled vertex with distance 8 is correct. The correctness criterion indicates that a vertex with a distance as small as 3 might label the vertex with an edge weight as small as 2. This gives a lower bound on the distance of 5. Thus in step 2, two of the three labeled vertices become known. We continue checking labeled vertices using the correctness criterion until all the vertices are known. Finally, we show the shortest-paths tree. We can get a more accurate lower bound on the distance of a labeled vertex if we use more information about the incident edges. For the level 1 formula, we used only the minimum incident edge weight. For the level 2 formula below we use all of the unknown incident edges.
min vertex.distance, min (edge.weight + min unknown) unknown edges
The lower bound is the smaller of the current distance and the minimum over unknown incident edges of (edge.weight + min unknown). Let the method lower bound( min unknown, level ) return the lower bound for a vertex. Since the level 0 lower bound is min unknown, we can write the level 2 formula in terms of the level 0 formula. �
vertex.lower bound( min unknown, 2 ) = min vertex.distance, � min (edge.weight + edge.source.lower bound( min unknown, 0 ))
unknown edges
More generally, for n ≥ 2 we can define the level n lower bound in terms of the level n − 2 lower bound. This gives us a recursive definition of the method. �
vertex.lower bound( min unknown, n ) = min vertex.distance, � min (edge.weight + edge.source.lower bound( min unknown, n - 2 ))
unknown edges
146
5
4
5 4
3
4
5 3
4
2
2 2
5
5
4
5
3
2
3 8
2 5
4
5 5
3
2
4 5
5
5
1
5
2
2
4
2
4
3 2
2
3
4
2 4
1
3
5
4
4
4 1
2
2
2
4
3
1
2
2
4
0
2
2
The graph
Initialization
1
Step 1
9
4
11 2
4
2
2
3
2
3
4
3
1
3 0
2
3
5 4
1
1
6
6
2
6
2
9
11 3
4
9
2
4
9
2 8
7 4
8 3
4
1
7 4
9 3
2
5
4
4
4
3 2
0
2
1
4
5
3
5
4
4
4
6
3
7
1
4
2
0
4
2
4
1
4 7
1
4
4 2
0
6 1
2
4
5
14
2
14
16
3
2
7
1
4
Step 4
16 4
11
11
4
11
14
16
5 3
4
Step 3
4
5
5
2
3
2
5 11
4
2
4
Step 2
11
11
14
16
2
4
5 5
8
5
11
3
2 2
3
9 5 5
3
4
1
7 2
5
4 4
8 6
5
3
4
2
5
4
5
3
4
5
5
3
7
9
11
8
7
9
11
8
7
9
11
4 4
3
4
5
4
5
1
4
5 6
4
3
4
5
4
4
6
2 4
2
0
4
3 1
Step 5
7 4
4
3
4
5
4
2
0
6 2
1
2 2
4
3 1
Step 6
7 4
5
4
2
1
2 2
5
2
0
1
2 2
3 1
7 4
The shortest paths tree
Figure 4.4: Marching with a correctness criterion algorithm for a graph with 16 vertices.
147 We consider why this is a correct lower bound. If the correct predecessor of this vertex is known, then it has been labeled from its predecessor and thus has the correct distance. Otherwise, the distance at its predecessor is currently not known. The correct distance is the correct distance of the predecessor plus the weight of the connecting, incident edge. The minimum over unknown edges of the sum of edge weight and a lower bound on the distance of the incident vertex is no greater than the correct distance. Thus the lower bound formula is valid. Below is the lower bound method which implements the lower bound formulae.
lower bound( vertex, min unknown, level ) if level == 0: return min unknown if level == 1: return min( vertex.distance, min unknown + vertex.min incident edge weight ) min distance = vertex.distance for edge in vertex.incident edges: if edge.source.status 6= KNOWN: d = edge.weight + edge.source.lower bound( min unknown, level - 2 ) if d < min distance: min distance = d return min distance Now we define the is correct() method for a vertex. For a labeled vertex, it returns true if the current distance is less than or equal to the lower bound on the distance and false otherwise. This completes the marching with correctness criterion() function. We give the refined version of this function below.
is correct( vertex, min unknown, level ) return ( vertex.distance ≤ vertex.lower bound( min unknown, level ) )
148
marching with correctness criterion( graph, source, level ) graph.initialize( source ) labeled = new labeled = ∅ label adjacent( labeled, source ) // Loop until all vertices have a known distance. while labeled 6= ∅: min unknown = minimum distance in labeled for vertex in labeled: if vertex.is correct( min unknown, level ): vertex.status = KNOWN label adjacent( new labeled, vertex ) // Get the labeled lists ready for the next step. remove known( labeled ) labeled + = new labeled new labeled = ∅ return Figure 4.5 depicts the incident edges used for the first few levels of correctness criteria. For each level, the correctness criterion is applied to the center vertex. We show the surrounding vertices and incident edges. The level 0 criterion does not use any information about the incident edges. The level 1 criterion uses only the minimum incident edge. The level 2 criterion uses all the incident edges from unknown vertices. The level 3 criterion uses the incident edges from unknown vertices and the minimum incident edge at each of these unknown vertices. The figure depicts subsequent levels up to level 6. If each vertex had I incident edges then the computational complexity of the level n correctness criterion would be O(I bn/2c ). We examine the performance of these correctness criteria. From our analysis of correctly determined vertices in Dijkstra’s algorithm (Figure 4.3) we expect that the ratio of vertices which can be determined to be correct will depend on the connectivity
149
Level 0
Level 4
Level 1
Level 2
Level 5
Level 3
Level 6
Figure 4.5: A depiction of the incident edges used in the level n correctness criterion for n = 0, . . . , 6.
150
0.75 0 1 2 3 4 5 Ideal
0.5 0.25 0 100
400 1600 6400 Number of Vertices
Complete Graph, Edge Weight Ratio = 2 Correctly Determined Ratio
Correctly Determined Ratio
Grid Graph, Edge Weight Ratio = 2 1
1 0.75 0.5 0.25 0
25600
10
0.75 0 1 2 3 4 5 Ideal
0.5 0.25 0 100
200 400 800 Number of Vertices
1600
40 160 Number of Vertices
640
Random, 32 Edges, Edge Weight Ratio = 2 Correctly Determined Ratio
Correctly Determined Ratio
Random, 4 Edges, Edge Weight Ratio = 2 1
0 1 2 3 4 5 Ideal
1 0.75 0 1 2 3 4 5 Ideal
0.5 0.25 0 100
200 400 800 Number of Vertices
1600
Figure 4.6: Log-linear plots of the ratio of correctly determined vertices to labeled vertices versus the number of vertices in the graph. The maximum-to-minimum edge weight ratio is 2. The key shows the correctness criterion. We show levels 0 through 5. The ideal correctness criterion is shown for comparison. of the edges and the distribution of edge weights. We also expect that for a given graph, the ratio of vertices which are determined to be correct will increase with the level of the correctness criterion. Again we consider grid, random and complete graphs with maximum-to-minimum edge weight ratios of 2, 10, 100 and ∞. Figure 4.6 shows the performance of the correctness criteria for each kind of graph with an edge weight ratio of 2. We run the tests for level 0 through level 5 criteria. We show the ideal algorithm for comparison. (The ideal correctness criterion would return true for all labeled vertices whose current distance is correct.) The level 0 correctness criterion (which is the criterion used in Dijkstra’s algorithm) yields a very low ratio of correctly determined vertices. If the minimum weight of labeled vertices is unique, then only a single labeled vertex will become determined. The level 1 and level 2 criteria perform quite well. For the grid graphs and random graphs, about
151
1
0 1 2 3 4 5 Ideal
0.75 0.5 0.25 0 100
Complete Graph, Edge Weight Ratio = 10 Correctly Determined Ratio
Correctly Determined Ratio
Grid Graph, Edge Weight Ratio = 10
0.5 0.25 0 10
0 1 2 3 4 5 Ideal
0.75 0.5 0.25 0 200 400 800 1600 Number of Vertices
40 160 Number of Vertices
640
Random, 32 Edges, Edge Weight Ratio = 10 Correctly Determined Ratio
Correctly Determined Ratio
1
0 1 2 3 4 5 Ideal
0.75
400 1600 6400 25600 Number of Vertices
Random, 4 Edges, Edge Weight Ratio = 10
100
1
1
0 1 2 3 4 5 Ideal
0.75 0.5 0.25 0 100
200 400 800 1600 Number of Vertices
Figure 4.7: Log-linear plots of the ratio of correctly determined vertices to labeled vertices versus the number of vertices in the graph. The maximum-to-minimum edge weight ratio is 10. The key shows the correctness criterion. We show levels 0 through 5. The ideal correctness criterion is shown for comparison. 3/4 of the labeled vertices are determined at each step. For the complete graph, all of the labeled vertices are determined at each step. For the ideal criterion, the ratio of determined vertices is close to or equal to 1 and does not depend on the number of vertices. The correctness criteria with level 3 and higher come very close to the ideal criterion. We see that the level 1 and level 3 criteria are the most promising for graphs with low edge weight ratios. The level 1 criterion yields a high ratio of determined vertices. The level 2 criterion yields only marginally better results at the cost of greater algorithmic complexity and higher storage requirements. Recall that the level 1 criterion only uses the minimum incident edge weight, while the level 2 criterion requires storing the incident edges at each vertex. The level 3 criterion comes very close to the ideal. Higher levels only add complexity to the algorithm. Figure 4.7 shows the performance of the correctness criteria for each kind of graph
152
0 1 2 3 4 5 Ideal
0.75 0.5 0.25 0 100
Correctly Determined Ratio
1
1
0 1 2 3 4 5 Ideal
0.75 0.5 0.25 0 200 400 800 1600 Number of Vertices
0 1 2 3 4 5 Ideal
0.75 0.5 0.25 0
400 1600 6400 25600 Number of Vertices
Random, 4 Edges, Edge Weight Ratio = 100
100
Complete Graph, Edge Weight Ratio = 100 Correctly Determined Ratio
1
10
40 160 Number of Vertices
640
Random, 32 Edges, Edge Weight Ratio = 100 Correctly Determined Ratio
Correctly Determined Ratio
Grid Graph, Edge Weight Ratio = 100
1
0 1 2 3 4 5 Ideal
0.75 0.5 0.25 0 100
200 400 800 1600 Number of Vertices
Figure 4.8: Log-linear plots of the ratio of correctly determined vertices to labeled vertices versus the number of vertices in the graph. The maximum-to-minimum edge weight ratio is 100. The key shows the correctness criterion. We show levels 0 through 5. The ideal correctness criterion is shown for comparison. with an edge weight ratio of 10. Compared to the results for an edge weight ratio of 2, the determined ratio is lower for the ideal criterion and the determined ratios for levels 0 through 5 are more spread out. Around 3/4 of the vertices are determined at each time step with the ideal criterion; there is a slight dependence on the number of vertices. The level 1 criterion performs fairly well; it determines from about 1/4 to 1/2 of the vertices. The level 2 criterion determines only slightly more vertices than the level 1. Going to level 3 takes a significant step toward the ideal. Level 4 determines few more vertices than level 3. There is a diminishing return in going to higher levels. Figure 4.8 shows the performance of the correctness criteria when the edge weight ratio is 100. The determined ratio is lower still for the ideal criterion and the determined ratios for levels 0 through 5 are even more spread out. The determined ratios
153
0 1 2 3 4 5 Ideal
0.75 0.5 0.25 0 100
Correctly Determined Ratio
1
1
0 1 2 3 4 5 Ideal
0.75 0.5 0.25 0
0 1 2 3 4 5 Ideal
0.75 0.5 0.25 0
400 1600 6400 25600 Number of Vertices
Random, 4 Edges, Edge Weight Ratio = Infinity
100
Complete Graph, Edge Weight Ratio = Infinity Correctly Determined Ratio
1
10
40 160 Number of Vertices
640
Random, 32 Edges, Edge Weight Ratio = Infinity Correctly Determined Ratio
Correctly Determined Ratio
Grid Graph, Edge Weight Ratio = Infinity
1
0 1 2 3 4 5 Ideal
0.75 0.5 0.25 0
200 400 800 1600 Number of Vertices
100
200 400 800 1600 Number of Vertices
Figure 4.9: Log-linear plots of the ratio of correctly determined vertices to labeled vertices versus the number of vertices in the graph. The maximum-to-minimum edge weight ratio is infinite. The key shows the correctness criterion. We show levels 0 through 5. The ideal correctness criterion is shown for comparison. now have a noticeable dependence on the number of vertices. Finally, Figure 4.9 shows the performance of the correctness criteria with an infinite edge weight ratio. Compared to the results for lower edge weight ratios, the determined ratio is lower for the ideal criterion and the determined ratios for levels 0 through 5 are more spread out. For the infinite edge weight ratio, the correctness criteria yield fewer correctly determined vertices. Note that if the correctly determined ratio is D, then on average a labeled vertex will be tested 1/D times before it is determined to be correct. For each of the correctness criteria, we see that the ratio of determined vertices is primarily a function of the edge weight ratio and the number of edges per vertex. The determined ratio decreases with both increasing edge weight ratio and increasing edges per vertex. Thus graphs with a low edge weight ratio and/or few edges per vertex seem well
154 suited to the marching with a correctness criterion approach. For graphs with high edge weight ratios and/or many edges per vertex, the correctness criteria yield fewer determined vertices, so the method will be less efficient. Before analyzing execution times in the next section, we develop a more efficient implementation of the correctness criteria for levels 2 and higher. It is not necessary to examine all of the edges of a vertex each time is correct() is called. Instead, we amortize this cost over all the calls. The incident edges of each vertex are in sorted order by edge weight. Additionally, each vertex has a forward edge iterator, unknown incident edge, which keeps track of the incident edge currently being considered. To see if a labeled vertex is determined, the incident edges are traversed in order. If we encounter an edge from an unknown vertex such that the sum of the edge weight and the lower bound on the distance of that unknown vertex is less than the current distance, then the vertex is not determined to be correct. The next time is correct() is called for the vertex, we start at the incident edge where the previous call stopped. This approach works because the lower bound on the distance of each vertex is non-increasing as the algorithm progresses. That is, as more vertices become known and more vertices are labeled, the lower bound on a given vertex may decrease but will never increase. Below is the more efficient implementation of is correct().
is correct( vertex, min unknown, level ): if level ≤ 1: if vertex.distance > vertex.lower bound( min unknown, level ): return false else: vertex.get unknown incident edge() while vertex.unknown incident edge 6= vertex.incident edges.end(): if ( vertex.distance > vertex.unknown incident edge.weight + vertex.unknown incident edge.source.lower bound( min unknown, level - 2 ) ):
155 return false ++vertex.unknown incident edge vertex.get unknown incident edge() return true
get unknown incident edge( vertex ): while ( vertex.unknown incident edge 6= vertex.incident edges.end() and vertex.unknown incident edge.source.status == KNOWN ): ++vertex.unknown incident edge return
4.4
Computational Complexity
Now we determine the computational complexity of the MCC algorithm. We will get a worst-case bound for using the level 1 correctness criterion. Let the edge weights be in the interval [A . . . B]. As introduced before, let R = B/A be the ratio of the largest edge weight to the smallest. We will assume that the ratio is finite. Consider the MCC algorithm in progress. Let µ be the minimum distance of the labeled vertices. The distances of the labeled vertices are in the range [µ . . . µ + B). When one applies the correctness criterion, at least all of the labeled vertices with distances less than or equal to µ + A will become known. Thus at the next step, the minimum labeled distance will be at least µ + A. At each step of the algorithm, the minimum labeled distance increases by at least A. This means that a vertex may be in the labeled set for at most B/A steps. The cost of applying the correctness criteria is O(RV ). The cost of labeling is O(E). Since a vertex is simply added to the end of a list or array when it becomes labeled, the cost of adding and removing labeled vertices is O(V ). Thus the computation complexity of the MCC algorithm is O(E + RV ).
156
4.5
Performance Comparison
We compare the performance of Dijkstra’s algorithm and the Marching with a Correctness Criterion algorithm. For the MCC algorithm, we consider level 1 and level 3 correctness criteria, which have better performance than other levels. Again we consider grid, random and complete graphs with maximum-to-minimum edge weight ratios of 2, 10, 100 and ∞. Figure 4.10 shows the execution times over a range of graph sizes for each kind of graph with an edge weight ratio of 2. The level 1 MCC algorithm has relatively low execution times. It performs best for sparse graphs. (The grid graph and the first random graph each have four adjacent and four incident edges per vertex.) For the random graph with 32 edges, it is still the fastest method, but the margin is smaller. For medium to large complete graphs, the execution times are nearly the same as for Dijkstra’s algorithm. For small complete graphs, Dijkstra’s algorithm is faster. The level 3 MCC algorithm performs pretty well for the sparser graphs, but is slower than the other two methods for the denser graphs. Figure 4.11 shows the execution times for graphs with an edge weight ratio of 10. Again the level 1 MCC algorithm has the best overall performance, however the margin is a little smaller than in the previous tests. Figure 4.12 shows the execution times for graphs with an edge weight ratio of 100. The level 1 MCC algorithm is no longer the best overall performer. It has about the same execution times as Dijkstra’s algorithm for the complete graph and the random graph with 32 edges, but is slower than Dijkstra’s algorithm for the grid graph and the random graph with 4 edges. Figure 4.13 shows the execution times for graphs with an infinite edge weight ratio. Except for complete graphs, the level 1 MCC algorithm does not scale well as the number of vertices is increased. This makes sense upon examining the correctly determined ratio plots for an infinite edge weight in Figure 4.9. As the size of the graph increases, the determined ratio decreases. The level 3 MCC algorithm scales better, but is slower than Dijkstra’s algorithm for each size and kind of graph. Note that the four plots for complete graphs (with edge weight ratios of 2, 10, 100
157
0.8
Complete Graph, Edge Weight Ratio = 2 Time per Edge (microsec)
Time per Edge (microsec)
Grid Graph, Edge Weight Ratio = 2 Dijkstra MCC 1 MCC 3
0.6 0.4 0.2 0 100
1600 25600 Number of Vertices
1.2 1 0.8 0.6 0.4 0.2 0
409600
10
1.5
Dijkstra MCC 1 MCC 3
1 0.5 0 100
1600 25600 Number of Vertices
409600
40 160 Number of Vertices
640
Random, 32 Edges, Edge Weight Ratio = 2 Time per Edge (microsec)
Time per Edge (microsec)
Random, 4 Edges, Edge Weight Ratio = 2 2
Dijkstra MCC 1 MCC 3
Dijkstra MCC 1 MCC 3
0.5 0.4 0.3 0.2 0.1 0 100
400
1600 6400 25600 102400 Number of Vertices
Figure 4.10: Log-log plots of the execution time per vertex versus the number of vertices in the graph. The maximum-to-minimum edge weight ratio is 2. The key shows the method: Dijkstra, MCC level 1 or MCC level 3.
158
Dijkstra MCC 1 MCC 3
0.8 0.6 0.4 0.2 0 100
Complete Graph, Edge Weight Ratio = 10 Time per Edge (microsec)
Time per Edge (microsec)
Grid Graph, Edge Weight Ratio = 10
1600 25600 Number of Vertices
1 0.8 0.6 0.4 0.2 0
409600
10
Dijkstra MCC 1 MCC 3
1.5 1 0.5 0 100
1600 25600 Number of Vertices
409600
40 160 Number of Vertices
640
Random, 32 Edges, Edge Weight Ratio = 10 Time per Edge (microsec)
Time per Edge (microsec)
Random, 4 Edges, Edge Weight Ratio = 10 2
Dijkstra MCC 1 MCC 3
1.2
0.6
Dijkstra MCC 1 MCC 3
0.5 0.4 0.3 0.2 0.1 0 100
400
1600 6400 25600 102400 Number of Vertices
Figure 4.11: Log-log plots of the execution time per vertex versus the number of vertices in the graph. The maximum-to-minimum edge weight ratio is 10. The key shows the method: Dijkstra, MCC level 1 or MCC level 3.
159
1.4
Dijkstra MCC 1 MCC 3
1.2 1 0.8 0.6 0.4 0.2 0 100
Complete Graph, Edge Weight Ratio = 100 Time per Edge (microsec)
Time per Edge (microsec)
Grid Graph, Edge Weight Ratio = 100
1600 25600 Number of Vertices
1 0.8 0.6 0.4 0.2 0
409600
10
Dijkstra MCC 1 MCC 3
3 2 1 0 100
1600 25600 Number of Vertices
409600
40 160 Number of Vertices
640
Random, 32 Edges, Edge Weight Ratio = 100 Time per Edge (microsec)
Time per Edge (microsec)
Random, 4 Edges, Edge Weight Ratio = 100
4
Dijkstra MCC 1 MCC 3
1.2
Dijkstra MCC 1 MCC 3
0.7 0.6 0.5 0.4 0.3 0.2 0.1 0 100
400
1600 6400 25600 102400 Number of Vertices
Figure 4.12: Log-log plots of the execution time per vertex versus the number of vertices in the graph. The maximum-to-minimum edge weight ratio is 100. The key shows the method: Dijkstra, MCC level 1 or MCC level 3.
160
2.5 2
Dijkstra MCC 1 MCC 3
1.5 1 0.5 0 100
Complete Graph, Edge Weight Ratio = Infinity Time per Edge (microsec)
Time per Edge (microsec)
Grid Graph, Edge Weight Ratio = Infinity
1600 25600 Number of Vertices
1 0.8 0.6 0.4 0.2 0
409600
10
40
Dijkstra MCC 1 MCC 3
30 20 10 0 100
1600 25600 Number of Vertices
409600
40 160 Number of Vertices
640
Random, 32 Edges, Edge Weight Ratio = Infinity Time per Edge (microsec)
Time per Edge (microsec)
Random, 4 Edges, Edge Weight Ratio = Infinity 50
Dijkstra MCC 1 MCC 3
1.2
Dijkstra MCC 1 MCC 3
4 3 2 1 0 100
400
1600 6400 25600 102400 Number of Vertices
Figure 4.13: Log-log plots of the execution time per vertex versus the number of vertices in the graph. The maximum-to-minimum edge weight ratio is infinite. The key shows the method: Dijkstra, MCC level 1 or MCC level 3.
161 and ∞) are virtually identical. Dijkstra’s algorithm and the level 1 MCC algorithm both perform relatively well. For medium to large graphs, their execution times are very close. This is because there are many more edges than vertices, so labeling adjacent vertices dominates the computation. The costs of heap operations for Dijkstra’s algorithm or correctness tests for the level 1 MCC algorithm are negligible. This is the case even for an infinite edge weight ratio where on average, each labeled vertex is checked many times before it is determined to be correct. For complete graphs, the level 3 MCC algorithm is slower than the other two. This is because all incident edges of a labeled vertex may be examined during a correctness check. Thus the level 3 correctness criterion is expensive enough to affect the execution time. Clearly the distribution of edge weights affects the performance of the MCC algorithm. One might try to use topological information to predict the performance. Consider planar graphs for example, i.e. graphs that can be drawn in a plane without intersecting edges. During the execution of the MCC algorithm (or Dijkstra’s algorithm) one would expect the labeled vertices to roughly form a band that moves outward from the source. In this case, the number of labeled vertices would be much smaller than the total number of vertices. One might expect that the MCC algorithm would be well suited to planar graphs. However, this is not necessarily the case. Figure 4.14 shows two shortest-paths trees for a grid graph (a graph in which each vertex is connected to its four adjacent neighbors). The first diagram shows a typical tree. The second diagram shows a pathological case in which the shortest-paths tree is a single path that winds through the graph. For this case, the average number of labeled vertices is of the order of the number of vertices. Also, at each step of the MCC algorithm only a single labeled vertex can become known. For this pathological case, the complexity of the MCC algorithm is O(N 2 ). Unfortunately, one cannot guarantee reasonable performance of the MCC algorithm based on topological information.
162
Figure 4.14: Two shortest-paths trees for a grid graph.
4.6
Concurrency
Because of its simple data structures, the MCC method is easily adapted to a concurrent algorithm. The outer loop of the algorithm, while labeled 6= ∅, contains two loops over the labeled vertices. The first loop computes the minimum labeled distance and assigns this value to min unknown. Though the time required to determine this minimum unknown distance is small compared to correctness checking and labeling, it may be done concurrently. The complexity of finding the minimum of N elements with P processors is O(N/P + log2 P ) [11]. The more costly operations are contained in the second loop. Each labeled vertex is tested to see if its distance can be determined to be correct. If so, it becomes known and labels its adjacent neighbors. These correctness checks and labeling may be done concurrently. Thus the complexity for both is then O(N/P ). We conclude that the computational complexity of the MCC algorithm scales well with the number of processors. By contrast, most other shortest-paths algorithms, including Dijkstra’s algorithm, are not so easily adapted to a concurrent framework. Consider Dijkstra’s algorithm: The only operation that easily lends itself to concurrency is labeling vertices when a labeled vertex becomes known. That is, labeling each adjacent vertex is an independent operation. These may be done concurrently. However, this fine scale concurrency
163 is limited by the number of edges per vertex. Because only one vertex may become known at a time, Dijkstra’s algorithm is ill suited to take advantage of concurrency.
4.7 4.7.1
Future Work A More Sophisticated Data Structure for the Labeled Set
There are many ways that one could adapt the MCC algorithm. The MCC algorithm has a sophisticated correctness criterion and stores the labeled set in a simple container (namely, an array or a list). At each step the correctness criterion is applied to all the labeled vertices. By contrast, Dijkstra’s algorithm has a simple correctness criterion and stores the labeled set in a sophisticated container. At each step the correctness criterion is applied to a single labeled vertex. An approach that lies somewhere between these two extremes may work well for some problems. That approach would be to employ both a sophisticated correctness criterion and a sophisticated vertex container. This more sophisticated container would need to be able to efficiently identify the labeled vertices on which the correctness test is likely to succeed. At each step, the correctness criterion would be applied to this subset of the labeled vertices. For example, the labeled set could be stored in a cell array, cell sorted by distance. The correctness criterion would be applied to vertices whose current distance is less than a certain threshold, as vertices with small distances are more likely to be correct than vertices with large distances. Alternatively, the labeled vertices could be cell sorted by some other quantity, perhaps the difference of the current distance and the minimum incident edge weight from an unknown vertex. Again, vertices with lower values are more likely to be correct. Yet another possibility would be to factor in whether the distance at a vertex decreased during the previous step. In summary, there are many possibilities for partially ordering the labeled vertices to select a subset to be tested for correctness. A more sophisticated data structure for storing the labeled set may
164 improve performance, particularly for harder problems. One can use a cell array data structure to reduce the computational complexity of the MCC algorithm for the case that the edge weight ratio R is finite. As introduced before, let the edge weights be in the interval [A..B]. Each cell in the cell array holds the labeled vertices with distances in the interval [nA..(n + 1)A) for some integer n. Consider the MCC algorithm in progress. Let µ be the minimum labeled distance. The labeled distances are in the range [µ..µ + B). We define m = bµ/Ac. The first cell in the cell array holds labeled vertices in the interval [mA..(m + 1)A). By the level 1 correctness criterion, all the labeled vertices in this cell are correct. We intend to apply the correctness criterion only to the labeled vertices in the first cell. If they labeled their neighbors, the neighbors would have distances in the interval [µ + A..µ + A + B). Thus we need a cell array with dRe + 1 cells in order to span the interval [µ..µ + A + B). (This interval contains all the currently labeled distances and the labeled distances resulting from labeling neighbors of vertices in the first cell.) At each step of the algorithm, the vertices in the first cell become known and label their neighbors. If an unlabeled vertex becomes labeled, it is added to the appropriate cell. If a labeled vertex decreases its distance, it is moved to a lower cell. After the labeling, the first cell is removed and an empty cell is added at the end. As Dijkstra’s algorithm requires that each labeled vertex stores a pointer into the heap of labeled vertices, this modification of the MCC algorithm would require storing a pointer into the cell array. Now consider the computational complexity of the MCC algorithm that uses a cell array to store the labeled vertices. The complexity of adding or removing a vertex from the labeled set is unchanged, because the complexity of adding to or removing from the cell array is O(1). The cost of decreasing the distance of a labeled vertex is unchanged because moving a vertex in the cell array has cost O(1). We reduce the cost of applying the correctness criterion from O(RV ) to O(V ) because each vertex is “tested” only once. We must add the cost of examining cells in the cell array. Let D be the maximum distance in the shortest path tree. Then in the course of the computation, D/A cells will be examined. The total computational complexity of
165 the MCC algorithm with a cell array for the labeled vertices is O(E + V + D/A). Note that D could be as large as (V − 2)B + A. In this case D/A ≈ RV and the computational complexity is the same as that for the plain MCC algorithm.
4.7.2
Re-weighting the Edges
Let w(u, v) be the weight of the edge from vertex u to vertex v. Consider a function f : V → R defined on the vertices and a modified weight function w: ˆ w(u, ˆ v) = w(u, v) + f (u) − f (v) It is straightforward to show that any shortest path with weight function w is also a shortest path with weight function wˆ [9]. This is because any path from vertex a to vertex b is changed by f (a) − f (b). The rest of the f terms telescope in the sum. It may be possible to re-weight the edges of a graph to improve the performance of the MCC algorithm. The number of correctness tests performed depends on the ratio of the highest to lowest edge weight. By choosing f to decrease this ratio, one could decrease the execution time. One might determine the function f as a preprocessing step or perhaps compute it on the fly as the shortest-paths computation progresses. Consider the situation at a single vertex. Assume that f is zero at all other vertices. Let min incident, min adjacent, max incident and max adjacent denote the minimum and maximum incident and adjacent edge weights. If min adjacent < min incident and max adjacent < max incident, then choosing f=
min incident − min adjacent 2
will reduce the ratio of the highest to lowest edge weight at the given vertex. Likewise for the case: min adjacent > min incident and max adjacent > max incident.
166
4.8
Conclusions
Marching with a Correctness Criterion is a promising new approach for solving shortest path problems. MCC works well on easy problems. That is, if most of the labeled vertices are correct, then the algorithm is efficient. It requires few correctness tests before a vertex is determined to be correct. For such cases, the MCC algorithm outperforms Dijkstra’s algorithm. For hard problems, perhaps in which the edge weight ratio is high and/or there are many edges per vertex, fewer labeled vertices have the correct distance. This means that the MCC algorithm requires more correctness tests. For such cases, Dijkstra’s algorithm has lower execution times.
167
Chapter 5 Static Hamilton-Jacobi Equations 5.1
Introduction
In this chapter we will first describe upwind difference schemes and the Fast Marching Method (FMM) for solving static Hamilton-Jacobi equations. Then we will develop a Marching with a Correctness Criterion (MCC) algorithm for solving this problem. We will find that the MCC algorithm requires nonstandard upwind finite difference schemes. We will show that the MCC algorithm produces the same solution as the FMM, but can have computational complexity O(N ), the optimal complexity for this problem. We will perform tests to demonstrate the linear complexity of the MCC algorithm and to compare its performance to that of the FMM.
5.2
Upwind Finite Difference Schemes
In this section we will present a first-order and a second-order scheme for solving the eikonal equation. Here we provide a short summary of material in [29]. We consider solving the eikonal equation, |∇u|f = 1 in 2-D. Let ui,j be the approximate solution on a regular grid with spacing ∆x. We define one-sided difference operators which
168 provide first-order approximations of ∂u/∂x and ∂u/∂y. ui+1,j − ui,j , ∆x ui,j+1 − ui,j +y Di,j u= , ∆x
+x Di,j u=
ui,j − ui−1,j ∆x ui,j − ui,j−1 −y Di,j u = ∆x −x Di,j u=
Suppose ui,j is the approximate solution. To compute ∂u/∂x at the grid point (i, j), we will use differencing in the upwind direction. If ui−1,j < ui,j < ui+1,j then the −x left is an upwind direction and ∂u/∂x ≈ Di,j . If ui−1,j > ui,j > ui+1,j then the right +x is an upwind direction and ∂u/∂x ≈ Di,j . If both ui−1,j and ui+1,j are less than
ui,j then we determine the upwind direction by choosing the smaller of the two. If both ui−1,j and ui+1,j are greater than ui,j then there is no upwind direction. The derivative in the x direction vanishes. We can concisely encode this information into the first-order, adjacent difference scheme: �
��2 ��2 �1/2 1 −y +y −x +x = max Di,j u, −Di,j ,0 + max Di,j u, −Di,j ,0 fi,j
(5.1)
If the four adjacent neighbors of the grid point ui,j are known, then the difference scheme gives a quadratic equation for ui,j . Now we seek a second-order accurate scheme. If ui−2,j < ui−1,j < ui,j then the left is an upwind direction. We use the two adjacent grid points to the left to get a second-order accurate approximation of ∂u/∂x. ∂u 3ui,j − 4ui−1,j + ui−2,j ≈ ∂x 2∆x If ui−2,j > ui−1,j < ui,j then the left is still an upwind direction at (i, j), however we only use the closest adjacent grid point in the difference scheme. Thus we are limited to a first-order difference scheme in the left direction. We can write the second-order accurate formula in terms of the one-sided differences. ∂u ∆x −x −x −x ≈ Di,j u+ D D u ∂x 2 i,j i,j
169 By defining the switch function s−x i,j we can write a formula that is second-order accurate when ui−2,j < ui−1,j < ui,j and reverts to the first-order formula when ui−2,j > ui−1,j < ui,j .
s−x i,j =
1 if ui−2,j < ui−1,j 0 otherwise
∂u ∆x −x −x −x ≈ Di,j u + s−x D D u i,j ∂x 2 i,j i,j We use this to make a second-order accurate finite difference scheme: �
max
�
−x Di,j u
+
∆x −x −x s−x Di,j Di,j u, − i,j 2
�
+x Di,j
−
∆x +x +x s+x Di,j Di,j u i,j 2
�
��2 ,0
� � ��2 !1/2 ∆x ∆x 1 −y −y −y +y +y +y + max Di,j u + s−y Di,j Di,j u, − Di,j − s+y Di,j Di,j u , 0 = i,j i,j 2 2 fi,j �
�
If the adjacent neighbors of the grid point ui,j are known, then this gives a quadratic equation for ui,j .
5.3
The Fast Marching Method
Tsitsiklis was the first to publish a single-pass algorithm for solving static HamiltonJacobi equations. Addressing a trajectory optimization problem, he presented a firstorder accurate Dijkstra-like algorithm in [32]. Sethian discovered the method independently and published his Fast Marching Method in [27]. He presented higher-order accurate methods and applications in [28]. The Fast Marching Method is similar to Dijkstra’s algorithm [9] for computing the single-source shortest paths in a weighted, directed graph. In solving this problem, each vertex is assigned a distance, which is the sum of the edge weights along the minimum-weight path from the source vertex. As Dijkstra’s algorithm progresses, the status of each vertex is either known, labeled or unknown. Initially, the source vertex in the graph has known status and zero distance. All other vertices have
170 unknown status and infinite distance. The source vertex labels each of its adjacent neighbors. A known vertex labels an adjacent vertex by setting its status to labeled if it is unknown and setting its distance to be the minimum of its current distance and the sum of the known vertices’ weight and the connecting edge weight. It can be shown that the labeled vertex with minimum distance has the correct value. Thus the status of this vertex is set to known, and it labels its neighbors. This process of freezing the value of the minimum labeled vertex and labeling its adjacent neighbors is repeated until no labeled vertices remain. At this point all the vertices that are reachable from the source have the correct shortest path distance. The performance of Dijkstra’s algorithm depends on being able to quickly determine the labeled vertex with minimum distance. One can efficiently implement the algorithm by storing the labeled vertices in a binary heap. Then the minimum labeled vertex can be determined in O(log n) time where n is the number of labeled vertices. Sethian’s Fast Marching Method differs from Dijkstra’s algorithm in that the finite difference scheme is used to label the adjacent neighbors when a grid point becomes known. If there are N grid points, the labeling operations have a computational cost of O(N ). Since there may be at most N labeled grid points, maintaining the binary heap and choosing the minimum labeled grid points adds a cost of O(N log N ). Thus the total complexity is O(N log N ). We consider how a grid point that has become known labels its adjacent neighbors using the first-order, adjacent, upwind difference scheme. For each adjacent neighbor, there are potentially three ways to compute a new solution there. In Figure 5.1, the center grid point has just become known. Suppose the adjacent neighbor to the right is not known. We show three ways the center grid point can be used to compute the value of this neighbor. First, only the single known grid point is used. This corresponds to the case that there is no vertical upwind direction. If the grid points that are diagonal to the known grid point and adjacent to the grid point being labeled are known, they can be used in the difference scheme as well. This accounts for the second two cases. Below we give the functions that implement the first-order, adjacent difference
171
adjacent
adjacent−adjacent
adjacent−adjacent
Figure 5.1: The three ways of labeling an adjacent neighbor using the first-order, adjacent difference scheme. scheme for the eikonal equation, |∇u|f = 1. The difference scheme can use a single adjacent grid point (difference adj()) or two adjacent grid points (difference adj adj()). The second of these solves a quadratic equation to determine the solution. After we compute the solution in difference adj adj(), we check that the solution is not less than its two known neighbors. If the solution is less than one of its neighbors, then the scheme would not be upwind. In this case, we return infinity.
difference adj( a ): return a + ∆x / f
difference adj adj( a, b ): discriminant = 2∆x2 /f 2 − (a − b)2 if discriminant ≥ 0: � � √ solution = a + b + discriminant /2 if solution ≥ a and solution ≥ b: return solution return ∞ We give a more efficient method of implementing difference adj adj() below. If the condition in difference adj adj() is not satisfied, then the characteristic line comes from outside the wedge defined by the two adjacent neighbors. In this case, the computed
172 value will be higher than one of a or b and thus the difference scheme will not be upwind. For this case, we return infinity.
difference adj adj( a, b ): if |a − b| ≤ ∆x/f: � � p return a + b + 2∆x2 /f 2 − (a − b)2 /2 return ∞ Below is the Fast Marching Method for a 2-D grid. As input it takes a grid with a solution array and a status array. The initial condition has been specified by setting the status at some grid points to KNOWN and setting the solution there. At all other grid points the status is UNLABELED and the solution is ∞. The binary heap which stores the labeled grid points supports three operations: push(): Grid points are added to the heap when they become labeled. extract minimum(): The grid point with minimum solution can be removed. This function returns the indices of that grid point. decrease(): The solution at a grid point in the labeled set may be decreased through labeling. This function adjusts the position of the grid point in the heap. The binary heap takes the solution array as an argument in its constructor because it stores pointers into this array.
fast marching( grid ): // Make the binary heap. BinaryHeap labeled( grid.solution ) // Label the neighbors of known grid points. for each (i, j): if grid.status( i, j ) == KNOWN: grid.label neighbors( labeled, i, j )
173 // Loop until there are no labeled grid points. while labeled 6= ∅: (i, j) = labeled.extract minimum() grid.label neighbors( labeled, i, j ) return Below is the label neighbors() function which uses the finite difference scheme to label the neighbors. This function uses the first-order, adjacent scheme in Equation 5.1. Thus it labels the four adjacent neighbors. The label() function updates the value of a grid point and manages the heap of labeled grid points.
label neighbors( grid, labeled, i, j ): grid.status( i, j ) = KNOWN soln = grid.solution( i, j ) for the four adjacent indices (p, q): adj soln = difference adj( soln ) (m, n) = indices diagonal to (i, j) and adjacent to (p, q) if grid.status( m, n ) == KNOWN: adj soln = min( adj soln, difference adj adj( soln, grid.solution( m, n ) ) ) (m, n) = other indices diagonal to (i, j) and adjacent to (p, q) if grid.status( m, n ) == KNOWN: adj soln = min( adj soln, difference adj adj( soln, grid.solution( m, n ) ) ) label( grid, p, q, adj soln ) return
label( grid, labeled, i, j, value ): if grid.status( i, j ) == UNLABELED: grid.status( i, j ) = LABELED grid.solution( i, j ) = value
174 labeled.push( i, j ) else if grid.status( i, j ) == LABELED and value < grid.solution( i, j ): grid.solution( i, j ) = value labeled.decrease( i, j ) return
5.3.1
The Status Array
One can implement the Fast Marching Method without the use of the status array. In this case one does not check that a grid point is known when using it to label neighbors. A solution value of ∞ signifies that a grid point has not been labeled. Below is this variation of the Fast Marching Method.
fast marching no status( grid ): // Make the binary heap. BinaryHeap labeled( grid.solution ) // Label the neighbors of known grid points. for each (i, j): if grid.solution( i, j ) 6= ∞: grid.label neighbors( labeled, i, j ) // Loop until there are no labeled grid points. while labeled 6= ∅: i, j = labeled.top() labeled.pop() grid.label neighbors( labeled, i, j ) return
label neighbors( grid, labeled, i, j ) soln = grid.solution( i, j )
175 for the four adjacent indices (p, q): adj soln = difference adj( soln ) (m, n) = indices diagonal to (i, j) and adjacent to (p, q) if grid.solution( m, n ) 6= ∞: adj soln = min( adj soln, difference adj adj( soln, grid.solution( m, n ) ) ) (m, n) = other indices diagonal to (i, j) and adjacent to (p, q) if grid.solution( m, n ) 6= ∞: adj soln = min( adj soln, difference adj adj( soln, grid.solution( m, n ) ) ) label( grid, p, q, adj soln ) return
label( grid, labeled, i, j, value ) if grid.solution( i, j ) == ∞: grid.solution( i, j ) = value labeled.push( i, j ) else if value < grid.solution( i, j ): grid.solution( i, j ) = value labeled.decrease( i, j ) return Forgoing the use of the status array decreases the memory requirement but increases the execution time. This is because the finite difference scheme is called more often. In Figure 5.2 we show the execution times for solving the eikonal equation |∇u| = 1 on a 2-D grid with a first-order, adjacent difference scheme. For this test, not using a status array increased the execution time by about 50%. All further implementations of the Fast Marching Method presented in this chapter use a status array.
176
Time per Grid Point (microsec)
Fast Marching Methods in 2-D Status No Status 10
5
0 100
1000 10000 100000 1e+06 1e+07 Number of Grid Points
Figure 5.2: Log-log plots of the execution time per grid point versus the number of grid points for the fast marching method with and without a status array.
5.4
Applying the Marching with a Correctness Criterion Method
In analogy with with the single-source shortest paths problem (Chapter 4), we try to apply the Marching with a Correctness Criterion method to obtain an ordered upwind method of solving static Hamilton-Jacobi equations. Below we adapt the MCC algorithm in Section 4.3. Only minor changes are required.
marching with correctness criterion( grid ): labeled = new labeled = ∅ // Label the neighbors of known grid points. for each (i, j): if grid.status( i, j ) == KNOWN: grid.label neighbors( labeled, i, j ) // Loop until there are no labeled grid points. while labeled 6= ∅: for (i,j) in labeled: if grid.solution(i, j) is determined to be correct
177 grid.label neighbors( new labeled, i, j ) // Get the labeled lists ready for the next step. remove known( labeled ) labeled + = new labeled new labeled = ∅ return The algorithm is very similar to Sethian’s Fast Marching Method. However, the labeled grid points are stored in an array or list instead of a binary heap. When a labeled grid point is determined to have the correct solution, it uses the difference scheme to label its neighbors and it is removed from the labeled set. The label neighbors() function depends on the difference scheme used. The label() function is the same as before, except that there is no need to adjust the position of a labeled grid point when the solution decreases.
label( grid, labeled, i, j, value ) if grid.status( i, j ) == UNLABELED: grid.status( i, j ) = LABELED grid.solution( i, j ) = value labeled += (i, j) else if grid.status( i, j ) == LABELED and value < grid.solution( i, j ): grid.solution( i, j ) = value return We consider two test problems to probe the possible usefulness of a Marching with a Correctness Criterion algorithm. We solve the eikonal equation |∇u| = 1 on a 5 × 5 grid. For the first problem, we compute distance from a point that coincides with the lower left grid point. For the second problem, we compute distance from a line segment that makes an angle of −5◦ with the x axis. See Figure 5.3 for a diagram of the grids and initial conditions. The diagram also shows the directions from which the characteristic lines come. For the initial condition of the first problem, the solution
178
Figure 5.3: The two test problems for exploring the Marching with a Correctness Criterion algorithm. In the left diagram, distance is computed from the (0, 0) grid point. In the right diagram, distance is computed from a line segment. at grid point (0, 0) is set to zero. For the second problem, the solution is set at grid points (0, 0) through (4, 0). We consider solving the test problems with a first-order, adjacent stencil. That is, a grid point uses its four adjacent neighbors in the difference scheme. Figure 5.4 shows a dependency diagram for the two test problems. That is, each grid point which is not set in the initial condition has arrows pointing to the grid points on which it depends (the grid points used in the difference scheme which produce the correct solution). Note that the arrows identify the quadrant from which the characteristic line comes. (Except for the degenerate cases where a single adjacent grid point is used in the difference scheme.) Now we need to develop a correctness criterion and see if it leads to an efficient algorithm. We already have one correctness criterion, namely the one used in the Fast Marching Method: The labeled grid point with minimum solution is correct. Now we develop a more sophisticated one in analogy with the level 1 correctness criterion developed for graphs in Section 4.3. That is, we will determine a lower bound on the solution at a labeled grid point using the assumption that it has at least one unknown neighbor. If the predicted solution there is no larger than this lower bound, then it
179
4
5
6
7
8
4
5
6
7
8
3
4
5
6
7
3
4
5
6
7
2
3
4
5
6
2
3
4
5
6
1
2
3
4
5
1
2
3
4
5
0
1
2
3
4
0
0
0
0
0
Figure 5.4: Dependency diagrams for a 5-point, adjacent stencil. must be correct. Let µ be the minimum solution among the labeled grid points. Each labeled grid point has at least one known adjacent neighbor. The correct solution at any unknown adjacent neighbors may be as low as µ. We determine the smallest predicted solution using an unknown neighbor. The solution at the known neighbor may be as small as µ − ∆x. (If it were smaller, the solution at the labeled grid point would be less than µ.) If the known adjacent neighbor has a value of µ − ∆x and the unknown adjacent neighbor has a value of µ, then the first-order, adjacent scheme computes a value of µ for the labeled grid point. Thus µ is our lower bound; any labeled grid point with solution less than or equal to µ is correct. This is disappointing. Our more sophisticated correctness criterion is the same as the one used in the Fast Marching Method: the labeled grid point with smallest solution is correct. Figure 5.5 shows an order diagram for the two test problems when using the above correctness criterion with the adjacent stencil. That is, the grid points are labeled with the order in which they can be computed. The results are disconcerting in that the order does not reflect the direction of the characteristic lines. The flow of information in the difference scheme is very different than the flow of information in the analytical solution. Firstly, the difference scheme itself is troubling. Consider the second test problem in which distance is computed from a line segment. The
180
9
10
12
13
14
16
17
18
19
20
6
7
8
11
13
11
12
13
14
15
3
4
5
8
12
6
7
8
9
10
1
2
4
7
10
1
2
3
4
5
0
1
3
6
9
0
0
0
0
0
Figure 5.5: Order diagrams for the 5-point, adjacent stencil. solution at the grid point (4, 1) depends on all of the grid points set in the initial condition: (0, 0) through (4, 0). Yet, the direction of the characteristic line is nearly vertical implying that the flow of information should be roughly vertical. Secondly, the correctness criterion would not lead to an efficient algorithm. In the second test problem, only a single labeled grid point is determined to be correct at each step. (The symmetry in the first problem leads to either one or two labeled grid points being determined at each step.) To ameliorate the problems presented above, we introduce a different stencil. Instead of differencing only in the coordinate directions, we consider differencing in the diagonal directions as well. Figure 5.6 shows a stencil that uses the four adjacent grid points and a stencil that uses the eight adjacent and diagonal grid points. First consider the adjacent stencil. If the characteristic comes from the first quadrant, grid point a would be used to compute ∂u/∂x and grid point b would be used to determine ∂u/∂y. Next consider the adjacent-diagonal stencil. If the characteristic came from the first sector, grid point a would be used to compute ∂u/∂x and grid point b would be used to determine ∂u/∂x + ∂u/∂y from which ∂u/∂y can be determined. The adjacent-diagonal stencil increases the number of directions in which information can flow from four to eight. Now we consider solving the test problems with the 9-point, adjacent-diagonal
181
b 2
d 1
c
a
1
e
4
a 5
8 6
f
d
b
2
4
c 3
3
g
7
h
Figure 5.6: The 5-point, adjacent stencil and the 9-point, adjacent-diagonal stencil.
4
4
4
4
4
4
4
4
4
4
3
3
3
3
4
3
3
3
3
3
2
2
2
3
4
2
2
2
2
2
1
1
2
3
4
1
1
1
1
1
0
1
2
3
4
0
0
0
0
0
Figure 5.7: Dependency diagrams for the 9-point, adjacent-diagonal stencil. stencil. Figure 5.7 shows the dependency diagrams. The arrows identify the π/4 sector from which the characteristic line comes. (Except for the degenerate cases where a single grid point is used in the difference scheme.) Saying that the characteristic direction comes from a sector of angle π/4 is not an accurate description, however, it is more accurate that saying it comes from one of the four quadrants. The adjacent-diagonal stencil reduces the domain of dependence for the grid points. We turn our attention to developing a correctness criterion for the adjacentdiagonal stencil. Let µ be the minimum solution among the labeled grid points. Each labeled grid point has at least one known adjacent or diagonal neighbor. The correct solution at the other neighbors may be as low as µ. We determine the smallest predicted solution using an unknown neighbor.
182
4
4
5
5
6
4
4
4
4
4
3
3
4
4
5
3
3
3
3
3
2
2
3
4
5
2
2
2
2
2
1
1
2
3
4
1
1
1
1
1
0
1
2
3
4
0
0
0
0
0
Figure 5.8: Order diagrams for the 9-point, adjacent-diagonal stencil. First consider the case that an adjacent neighbor is known and a diagonal neighbor is unknown. We assign a value of µ to the unknown diagonal neighbor. If the characteristic line comes from the sector defined by these two neighbors, the smallest predicted solution is µ + ∆x. Next consider the case that the diagonal neighbor is known and an adjacent neighbor is unknown. We assign a value of µ to the unknown √ adjacent neighbor. The smallest possible predicted solution in this case is µ+∆x/ 2. √ Thus all labeled grid points with solutions less than or equal to µ + ∆x/ 2 have the correct value. This turns out to be a useful correctness criterion. Figure 5.8 shows the order diagram for the first-order, adjacent-diagonal scheme. We see that at each step, most of the labeled grid points are determined to be correct. For the second test problem, all the labeled vertices are determined to be correct. The adjacent-diagonal stencil with this correctness criterion looks promising.
5.5
Adjacent-Diagonal Difference Schemes
Tsitsiklis presented a first-order accurate Dial-like algorithm [32] for solving static Hamilton-Jacobi equations that uses the diagonal as well as the adjacent neighbors in the finite differencing. (In K-dimensional space, a grid point has 2K adjacent neighbors and a total of 3K − 1 neighbors.) Although his algorithm, which uses all of
183 the neighbors, has the optimal computational complexity O(N ), he concluded that it would not be as efficient as his Dijkstra-like algorithm. Thus he did not present an implementation. In this section we will present schemes that use some or all of the diagonal neighbors in differencing. We will study both the accuracy and efficiency of these schemes. We have seen that the adjacent-diagonal scheme introduced in the previous section may enable the application of the Marching with a Correctness Criterion methodology. In this section we will develop first and second-order, adjacent-diagonal difference schemes. Again we consider solving the eikonal equation, |∇u|f = 1 in 2-D. We know how to difference in the coordinate directions with adjacent grid points to approximate ∂u/∂x and ∂u/∂y. We can also difference in diagonal directions to get first-order approximations of ±∂u/∂x ± ∂u/∂y. For example, � ui,j − ui−1,j−1 ∂u ∂u = + + O ∆x2 . ∆x ∂x ∂y We can also obtain a second-order accurate difference. � 3ui,j − 4ui−1,j−1 + ui−2,j−2 ∂u ∂u = + + O ∆x3 2∆x ∂x ∂y If we know ∂u/∂x + ∂u/∂y from differencing in a diagonal direction and ∂u/∂x from differencing in a horizontal direction, then we can determine ∂u/∂y from the difference of these two. Thus we can determine approximations of ∂u/∂x and ∂u/∂y from one adjacent difference and one diagonal difference. We consider how a grid point that has become known labels its neighbors using the adjacent-diagonal, first-order, upwind difference scheme. For each adjacent neighbor, there are potentially three ways to compute a new solution there. In Figure 5.9, the center grid point has just become known. The first row of diagrams show how to label an adjacent neighbor. Suppose the adjacent neighbor to the right is not known. We show three ways the center grid point can be used to compute the value of this neighbor. First, only the center grid point is used. If the grid points that are adjacent
184 to the center grid point and diagonal to the grid point being labeled are known, they can be used in the difference scheme as well. This accounts for the second two cases. The second row of diagrams show how to label a diagonal neighbor. Again, there are three ways the center grid point can be used to compute the value of this neighbor. First, only the center grid point is used. If the grid points that are adjacent to the center grid point and the grid point being labeled are known, they can be used in the difference scheme as well.
adjacent
adjacent−diagonal
adjacent−diagonal
diagonal
diagonal−adjacent
diagonal−adjacent
Figure 5.9: The three ways of labeling an adjacent neighbor and the three ways of labeling a diagonal neighbor using the adjacent-diagonal, first-order difference scheme. Using an adjacent-diagonal scheme requires us to more closely examine the upwind concept. In 1-D, the solution decreases in the upwind direction. The characteristic comes from the upwind direction. In 2-D, any direction in which the solution decreases is an upwind direction. If the dot product of a given direction with the characteristic direction is (positive/negative), then that direction is (downwind/upwind). For an adjacent difference scheme, the upwind information determines the quadrant from which the characteristic comes. The first diagram in Figure 5.10 shows a stencil for an adjacent difference scheme. A blue line shows the characteristic direc-
185 tion. The upwind coordinate directions are colored red while the downwind directions are green. That the characteristic comes from the third quadrant implies that directions c and d are upwind. Conversely, if c and d are upwind directions, then the characteristic comes from the third quadrant. For this case, grid points c and d would be used in the finite difference scheme to compute the solution at the center grid point. Choosing the upwind directions ensures that the CFL condition is satisfied. That is, the numerical domain of dependence contains the analytical domain of dependence. The situation is different for an adjacent-diagonal scheme. The second diagram in Figure 5.10 shows a stencil for an adjacent-diagonal difference scheme. The characteristic comes from sector 6, but there are four neighboring grid points which are upwind. We can use grid points f and g to determine the center grid point. If we used either grid points e and f or grid points g and h, then the scheme would be upwind, but would not satisfy the CFL condition. That is, the characteristic direction would be outside the numerical domain of dependence. Using sectors 5 or 7 to determine the grid point would lead to an incorrect result. We will show a simple example of this later in this section. Although “CFL satisfying” would be a more accurate adjective to describe these adjacent-diagonal schemes than “upwind,” we will continue to use the latter term.
b 2
d 1
c
b
2 1
e
4 d
c
4 a
3
3
a 5
f
8 6
g
7
h
Figure 5.10: The direction of the characteristic is shown in blue. Upwind directions are shown in red; downwind directions are shown in green. Below we give the functions that implement the adjacent-diagonal, first-order difference scheme for the eikonal equation, |∇u|f = 1. The difference scheme can use a
186 single adjacent grid point (difference adj()), a single diagonal grid point (difference diag()), or an adjacent and a diagonal grid point (difference adj diag()). The last of these solves a quadratic equation to determine the solution. If the condition in difference adj diag() is not satisfied, then the characteristic line comes from outside the wedge defined by the adjacent and diagonal neighbors. In this case the difference scheme will not satisfy the CFL condition so we return infinity.
difference adj( a ): return a + ∆x/f
difference diag( a ): √ return a + 2 ∆x/f
difference adj diag( a, b ): diff = a - b √ if 0 ≤ diff ≤ ∆x/( 2 f): q return adj + ∆x2 /f 2 − diff 2 return ∞ Now we consider a simple example which demonstrates that the finite difference scheme must satisfy the CFL condition and not just be upwind. We solve the eikonal equation |∇u| = 1 on a 3 × 3 grid. The grid spacing is unity and initially the lower left grid point is set to zero. The solution is the Euclidean distance from that grid point. Figure 5.11 shows the initial condition and the analytical solution on the grid. Figure 5.12 shows the result of using the Fast Marching Method with the firstorder, adjacent-diagonal scheme. The scheme is upwind, but we do not enforce the CFL condition to restrict which differences are applied. Each of the labeling operations are depicted. In step 1, grid point (0, 0) labels its adjacent and diagonal
187 ∞
∞
∞
2
∞
∞
∞
1
0
∞
∞
0
Initial Condition
√ √
1
5 2
√ 2 2 √
5
2
Analytical Solution
Figure 5.11: The initial condition and the analytic solution on the grid. ∞
∞
∞
√ 1+ 2 ∞
2 6 �
√
1
2
∞
6 �
0
∞
-1
1
-1 * � � �� 6 � ��( (� 0 1 -2
Step 1 2 1 0
-2 * � � ��
1 1
√ 1+ 2
2
2
2
2
1
1
0
1
�� 6 (� (
2
Steps 5 and 6
-2 * � � �� 6 ��( (�
√ 1+ 2
KA@ I �� 6 � Ah @ � ( ( h 1 1 -2 * � EE� @ ��HH @ R j
0
Steps 2 and 3 √ 1+ 2
2
1
2
Step 4 2
2
2
2
1
1
2
2
0
1
2
Steps 7 and 8
Solution
Figure 5.12: An adjacent-diagonal difference scheme that is upwind, but does not satisfy the CFL condition. neighbors. We see the first sign of trouble in steps 2 and 3. In these steps, grid points (0, 0) and (1, 0) are used to label (1, 1) with the value 1. The values at these two known grid points indicate that the characteristic is in the direction of the positive x axis. Thus the characteristic does not come from the sector described by the three grid points. As a result, the predicted solution is erroneous. This problem reoccurs in the subsequent steps. It is apparent that the solution will not converge as the grid is refined.
188 ∞
∞
∞
√ 1+ 2 ∞
2 6 �
√
1
2
∞
1
∞
-1
Step 1 √ p2+ √ 2 2 2−2 √
1
-
√ 1+ 2
2
6 �
6 �
0
√
2
√ 2 2 √ p2+ √ 2 2−2
0
1
-2
Steps 2 and 3 √ p2+ √ √ 2 2 2−2 -2 2 1
√
2
2
√ p2+ √ 2 2−2
√ 2 2
@ �� 6 � I √ � √ (@ ( p2+ √ 1 2 * 2 2−2 � � @ R �� @
0
2
6 √ p2+ √ 2 2−2
1
2
0
1
2
Step 4 √ p2+ √ 2 2−2 √
2
√ 2 2 √ p2+ √ 2 2−2
6
0
1
2
Steps 5 and 6
0
1
Steps 7 and 8
1
2
Solution
Figure 5.13: An adjacent-diagonal difference scheme that satisfies the CFL condition. By contrast, Figure 5.13 shows the result of using the first-order, adjacent-diagonal scheme that satisfies the CFL condition. Each of the labeling operations which satisfy the CFL condition are depicted. Note that fewer of these operations are permissible. This approach results in a convergent scheme.
5.6
Computational Complexity
Now we determine the computational complexity of the MCC algorithm for solving the eikonal equation |∇u|f = 1. Let the values of f be in the interval [A . . . B] and let R = B/A. Consider the MCC algorithm in progress. Let µ be the minimum solution of the labeled grid points. The predicted solutions at the labeled grid points √ are in the range [µ . . . µ + 2∆x/A). When one applies the correctness criterion, at least all of the labeled vertices with distances less than or equal to µ +
√∆x 2B
will
become known. Thus at the next step, the minimum labeled solution will be at least µ+
√∆x . 2B
at least
At each step of the algorithm, the minimum labeled solution increases by
√∆x . 2B
This means that a grid point may be in the labeled set for at most
189 √
2∆x √∆x / 2B A
= 2B/A = 2R steps. The computational cost of applying the correctness
criteria is thus O(RN ). The cost of labeling is O(N ). Since a grid point is simply added to the end of a list or array when it becomes labeled, the cost of adding and removing labeled grid points is O(N ). Thus the computation complexity of the MCC algorithm is O(RN ).
5.7
Performance Comparison of the Finite Difference Schemes with the FMM
5.7.1
Test Problems
We consider three test problems. In each problem, the distance is computed from a point or set of points. We consider cases in which the solution is smooth, the solution has high curvature and the solution has shocks, i.e., the solution is not everywhere differentiable. Figure 5.14 shows the test problem with a smooth solution. The grid spans the domain [−1/2..1/2] × [−1/2..1/2]. The distance is computed from a single point at (−3/4, −3/4). Figure 5.15 shows the test problem with high curvature. The distance is computed from a single point in the center of the grid. The solution has high curvature near the center. This is where the difference schemes will make the largest errors. Figure 5.16 shows the problem in which the solution has shocks. The grid spans the domain [−1/2..1/2] × [−1/2..1/2]. The distance is computed from 16 points on the circle of unit radius, centered at the origin. There are shocks along lines that are equidistant from two points. This test case produces shock lines at a variety of angles.
190
Smooth Solution
2
1
0 1
1 0.5
0.5 0 0
Figure 5.14: Test problem for a smooth solution. The top diagram depicts a 10 × 10 grid. The distance is computed from the point outside the grid depicted as a solid black disk. The red grid points show where the initial condition for first-order schemes is specified. The green grid points show the additional grid points where the initial condition is specified for second-order schemes. We show a plot of the smooth solution.
191
Solution with High Curvature
1
0.5
0 1
1 0.5
0.5 0 0
Figure 5.15: Test problem for a solution with high curvature. The diagram shows a 10 × 10 grid. The distance is computed from a point at the center of the grid. The red grid points show where the initial condition is specified for first-order and second-order schemes. Next we show a plot of the solution.
192
Solution with Shocks
1
0.5
0 1
1 0.5
0.5 0 0
Figure 5.16: Test problem for a solution with shocks. The diagram depicts a 10 × 10 grid. The distance is computed from the points on the unit circle. Lines show the locations of the shocks. The red grid points show where the initial condition for first-order schemes is specified. The green grid points show the additional grid points where the initial condition is specified for second-order schemes. Next we show a plot of the solution.
193
5.7.2
Convergence
5.7.2.1
Smooth Solution
First we examine the behavior of the finite difference schemes on the test problem with a smooth solution. We use the schemes to solve the problem on a 40 × 40 grid. Figure 5.17 shows plots of the error for the four difference schemes. For the adjacent stencils, the largest errors are in the diagonal direction. This reflects that the differencing is done in the coordinate directions. The first-order, adjacent scheme has a large error. For the second-order scheme, the error is much smaller. For the adjacent-diagonal stencils, the largest errors are in the directions which lie between the coordinate and diagonal directions. This is expected as the schemes difference in the coordinate and diagonal directions. The first-order, adjacent-diagonal scheme has significantly smaller errors than the first-order, adjacent scheme. The second-order, adjacent-diagonal scheme has the smallest errors. Now we examine the convergence of the solution using the difference schemes. The first graph in Figure 5.18 shows the L1 error versus the grid spacing for grids ranging in size from 10 × 10 to 5120 × 5120. We see that going from an adjacent stencil to an adjacent-diagonal stencil reduces the error by about a factor of 10. The second-order schemes have a higher rate of convergence than the first-order schemes. The L∞ error shows the same behavior. Table 5.1 shows the numerical rate of convergence for the difference schemes. (If the the error is proportional to ∆xα , where ∆x is the grid spacing, then α is the rate of convergence.) We see that for the smooth solution, the first-order schemes have first-order convergence and the second-order schemes have second-order convergence. Scheme First-Order, Adjacent Second-Order, Adjacent First-Order, Adjacent-Diagonal Second-Order, Adjacent-Diagonal
L1 0.998 1.995 0.995 1.995
L∞ 0.992 1.995 0.997 1.997
Table 5.1: Convergence to a smooth solution.
194
Smooth, 2nd Order, Adjacent
Smooth, 1st Order, Adjacent −4
x 10 0.02
5
0.01
0
0
−5
−0.01 1
−10 1
1
1 0.5
0.5
0.5
0.5 0 0
0 0
Smooth, 1st Order, Adj−Diag
Smooth, 2nd Order, Adj−Diag
−3
−4
x 10
x 10
2
1
1
0
0
−1
−1 1
−2 1
1 0.5
0.5 0 0
1 0.5
0.5 0 0
Figure 5.17: Plots of the error for a smooth solution on a 40 × 40 grid.
195
L1 Error in Smooth Solution 0.01
1st Order, Adjacent 2nd Order, Adjacent 1st Order, Adj-Diag 2nd Order, Adj-Diag 1st Order Convergence 2nd Order Convergence
L1 Error
0.001 0.0001 1e-05 1e-06 1e-07 0.1
0.01
0.001
Grid Spacing Maximum Error in Smooth Solution 1st Order, Adjacent 2nd Order, Adjacent 1st Order, Adj-Diag 2nd Order, Adj-Diag 1st Order Convergence 2nd Order Convergence
Maximum Error
0.01 0.001 0.0001 1e-05 1e-06 1e-07 0.1
0.01 0.001 Grid Spacing
Figure 5.18: L1 and L∞ error for a smooth solution. Log-log plot of the error versus the grid spacing.
196 5.7.2.2
Solution with High Curvature
Next we examine the behavior of the finite difference schemes on the test problem with high curvature. Again we use the schemes to solve the problem on a 40×40 grid. Figure 5.19 shows plots of the error for the four difference schemes. The first-order, adjacent scheme has significant errors in the region of high curvature, but accumulates larger errors in the low curvature region (especially in diagonal directions). Going to a second-order scheme introduces larger errors in the high curvature region. However the second-order, adjacent scheme is more accurate where the solution has low curvature. The first-order, adjacent-diagonal scheme is better at handling the high curvature region. Like the first-order, adjacent scheme, the error noticeably accumulates in the low curvature region, but to a lesser extent. The second-order, adjacent-diagonal scheme has relatively large errors in the high curvature region, but is very accurate elsewhere. We examine the convergence of the solution with high curvature using the difference schemes. The first graph in Figure 5.20 shows the L1 error versus the grid spacing for grids ranging in size from 10 × 10 to 5120 × 5120. First we note that the second order schemes have only a slightly higher rate of convergence than the first-order methods. Using an adjacent-diagonal stencil still significantly reduces the error. The L∞ error shows the same behavior. Table 5.2 shows the numerical rate of convergence for the difference schemes. For the solution with high curvature, the first-order schemes have less than first-order convergence. For both the adjacent and the adjacent-diagonal schemes it is about 0.85. The second-order schemes have first-order convergence. This is because they make first-order errors in the region of high curvature and then propagate this error through the region of low curvature where they are second-order accurate. 5.7.2.3
Solution with Shocks
Finally, we examine the behavior of the finite difference schemes on the test problem with shocks. The problem is solved on a 40 × 40 grid. Figure 5.21 shows plots of
197
High curvature, 1st Order, Adjacent
High curvature, 2nd Order, Adjacent
0.03
0.01
0.02 0.005
0.01 0 1
0 1
1 0.5
1 0.5
0.5 0 0
0.5 0 0
High curvature, 1st Order, Adj−Diag
High curvature, 2nd Order, Adj−Diag
−3
−3
x 10
x 10
10
5
5 0 0 −5 1
1 0.5
0.5 0 0
−5 1
1 0.5
0.5 0 0
Figure 5.19: Plots of the error for a solution with high curvature on a 40 × 40 grid.
198
L1 Error in Solution with High Curvature 1st Order, Adjacent 2nd Order, Adjacent 1st Order, Adj-Diag 2nd Order, Adj-Diag 1st Order Convergence 2nd Order Convergence
L1 Error
0.01
0.001
0.0001 0.1
0.01
0.001
Grid Spacing
Maximum Error
Maximum Error in Solution with High Curvature 1st Order, Adjacent 2nd Order, Adjacent 1st Order, Adj-Diag 2nd Order, Adj-Diag 1st Order Convergence 2nd Order Convergence
0.01
0.001
0.0001 0.1
0.01 0.001 Grid Spacing
Figure 5.20: L1 and L∞ error for a solution with high curvature. Log-log plot of the error versus the grid spacing.
199 Scheme First-Order, Adjacent Second-Order, Adjacent First-Order, Adjacent-Diagonal Second-Order, Adjacent-Diagonal
L1 0.840 1.002 0.853 0.998
L∞ 0.848 1.000 0.855 0.999
Table 5.2: Convergence to a solution with high curvature. the error for the four difference schemes. For the first-order, adjacent scheme, the errors in the smooth regions and along the shocks have approximately the same magnitude. Away from the shocks, the second order, adjacent scheme has low errors, but there are relatively large errors in a wide band around the shocks. The first-order, adjacent-diagonal scheme has significantly smaller errors than the corresponding adjacent scheme. Like the adjacent scheme, the errors in the smooth regions and near the shocks have approximately the same magnitude. The second-order, adjacentdiagonal scheme is very accurate in the smooth regions. Like the second-order, adjacent scheme, it has relatively large errors near the shocks, but these large errors are confined to narrow bands around the shocks. We examine the convergence of the solution with shocks using the four difference schemes. The first graph in Figure 5.22 shows the L1 error versus the grid spacing for grids ranging in size from 10 × 10 to 5120 × 5120. As before, using an adjacentdiagonal stencil significantly reduces the error. For small grids, the first-order and second-order schemes have about the same rate of convergence. For larger grids, the second-order schemes have a higher rate of convergence. Unlike the other tests, each of the schemes has about the same rate of convergence for the L∞ error. Table 5.3 shows the numerical rate of convergence for the solution with shocks using the four difference schemes. For the L1 error, the schemes have about the same rate of convergence as they do on the smooth solution. This is because most of the grid points are in the smooth region of the solution. Next we consider the L∞ error. The first-order, adjacent scheme and both of the adjacent-diagonal schemes have first-order convergence. The second-order, adjacent scheme has less than first-order convergence. This is because the wide stencil introduces first-order errors from the
200
Shocks, 2nd Order, Adjacent Shocks, 1st Order, Adjacent −3
x 10 2
0.01
0
0 −0.01
−2
−0.02 1
−4 1
1
1 0.5
0.5
0.5
0.5 0 0
0 0
Shocks, 1st Order, Adj−Diag
Shocks, 2nd Order, Adj−Diag
−3
−3
x 10
x 10
2
1 0
0 −1 −2 1
1 0.5
0.5 0 0
−2 1
1 0.5
0.5 0 0
Figure 5.21: Plots of the error for a solution with shocks on a 40 × 40 grid.
201
L1 Error in Solution with Shocks 0.01
1st Order, Adjacent 2nd Order, Adjacent 1st Order, Adj-Diag 2nd Order, Adj-Diag 1st Order Convergence 2nd Order Convergence
L1 Error
0.001 0.0001 1e-05 1e-06 1e-07 0.1
0.01
0.001
Grid Spacing
Maximum Error
Maximum Error in Solution with Shocks 1st Order, Adjacent 2nd Order, Adjacent 1st Order, Adj-Diag 2nd Order, Adj-Diag 1st Order Convergence 2nd Order Convergence
0.01 0.001 0.0001
0.1
0.01 0.001 Grid Spacing
Figure 5.22: Log-log plot of the L1 and L∞ error versus the grid spacing for the solution with shocks.
202 shock region into the smooth solution region in a band around the shock. This causes errors which are larger than first order to accumulate in a band around the shock. The second-order, adjacent-diagonal scheme did not have this problem for this test. It confined the first-order errors to narrow bands around the shocks. Scheme First-Order, Adjacent Second-Order, Adjacent First-Order, Adjacent-Diagonal Second-Order, Adjacent-Diagonal
L1 0.977 1.984 0.990 1.992
L∞ 1.001 0.915 0.986 0.994
Table 5.3: Convergence to a solution with shocks.
5.7.3
Execution Time
Figure 5.23 shows the execution times for the four difference schemes using the Fast Marching Method. The distance from a center point is computed on grids ranging in size from 10 × 10 to 5120 × 5120. Using the adjacent-diagonal stencils is more computationally expensive than using the adjacent stencils. For a small grid, using the first order, adjacent-diagonal scheme increases the execution time by about 25% over using the adjacent scheme. Using the second-order, adjacent-diagonal scheme increases the execution time by about 50% over the adjacent scheme. This margin decreases as the grid size increases. The execution time per grid point increases as the grid grows. However, the performance difference between each of the methods remains roughly constant. This reflects the fact that the cost per grid point of labeling does not depend on the grid size, but the cost per grid point of maintaining the binary heap increases with the increasing grid size.
203
Time per Grid Point (microsec)
Fast Marching Methods in 2-D 10
1st Order, Adjacent 2nd Order, Adjacent 1st Order, Adj-Diag 2nd Order, Adj-Diag
8 6 4 2 0 100
1000 10000 100000 1e+06 1e+07 Number of Grid Points
Figure 5.23: Log-log plot of the execution time per grid point versus the number of grid points for the fast marching method with different stencils.
5.8
Performance Comparison of the FMM and the MCC Algorithm
5.8.1
Memory Usage
Because the Marching with a Correctness Criterion algorithm has a simpler data structure for storing labeled grid points, it requires a little less memory than the Fast Marching Method. First consider the MCC algorithm. It has two arrays of size N where N is the number of grid points. There is an array of floating point numbers for the solution and an an array to store the status of the grid points. It also has a variable sized array of pointers to store the labeled grid points. Since the number of labeled grid points is typically much smaller than the total number of grid points, the memory required for the labeled array is negligible compared to the solution array and status array. The FMM has these three arrays as well. It uses the labeled array as a binary heap. In addition, the FMM requires a size N array of pointers into the heap. This is used to adjust the position of a labeled grid point in the heap when the solution decreases. Thus the MCC algorithm has two size N arrays while
204 the FMM has three. Suppose that one uses single precision floating point numbers for the solution and integers for the status. Single precision floating point numbers, integers and pointers typically each have a size of 4 words. Thus the FMM requires about 1/2 more memory than the MCC algorithm. For double precision floating point numbers (8 words) the FMM requires a third more memory.
5.8.2
Execution Time
Now we compare the execution times of the MCC algorithm and the FMM using the first-order and second-order, adjacent-diagonal schemes. We also implement a method that measures the execution time of an ideal algorithm for solving static Hamilton-Jacobi equations with an ordered, upwind scheme. For this ideal algorithm, the labeled grid points are stored in a first-in-first-out queue. (This was implemented with the deque data structure in the C++ standard template library [2].) At each step the labeled grid point at the front of the queue becomes known and it labels its neighbors. The algorithm performs a breadth-first traversal of the grid points as the solution is marched out. This approach does not produce the correct solution. It represents the ideal execution time because it determines which labeled grid point is “correct” in small constant time. In Figure 5.24 we show the execution times for the first-order, adjacent-diagonal scheme. The graph shows the linear computational complexity of the MCC algorithm. Its performance comes close to that of the ideal algorithm. We can see the N log N complexity of the FMM, but it still performs well. For the largest grid size, its execution time is about twice that of the MCC algorithm. In Figure 5.25 we show the execution times for the second-order, adjacent-diagonal scheme. The graph has the same features as that for the first-order scheme. However, the finite difference operations are more expensive so the relative differences in performance are smaller. Recall that the computational complexity of the MCC algorithm for solving the eikonal equation |∇u|f = 1 is O(RN ) where R is the ratio of the maximum to
205
Time per Grid Point (microsec)
Ordered Upwind Methods - 1st Order, Adj-Diag 8
FMM MCC Ideal
6 4 2 0 100
1000
10000 100000 1e+06 1e+07 Number of Grid Points
Figure 5.24: Log-linear plot of the execution time per grid point versus the number of grid points for the Fast Marching Method, the Marching with a Correctness Criterion algorithm and the ideal algorithm using a first-order, adjacent-diagonal scheme.
Time per Grid Point (microsec)
Ordered Upwind Methods - 2nd Order, Adj-Diag 10
FMM MCC Ideal
8 6 4 2 0 100
1000 10000 100000 1e+06 1e+07 Number of Grid Points
Figure 5.25: Log-linear plot of the execution time per grid point versus the number of grid points for the Fast Marching Method, the Marching with a Correctness Criterion algorithm and the ideal algorithm using a second-order, adjacent-diagonal scheme.
206 FMM and MCC - 1st-Order, Adj-Diag Execution Time (sec)
4 3 2 1 FMM MCC 0 1
10 100 Maximum to Minimum Speed Ratio
1000
Figure 5.26: Log-log plot of the execution time versus the ratio of the maximum to minimum propagation speed in the eikonal equation. We compare the Fast Marching Method and the Marching with a Correctness Criterion algorithm using a first-order, adjacent-diagonal scheme. minumum propagation speed f . We consider the effect of R on the execution times of the marching methods. We choose a speed function f that varies between 1 and R on the domain [0..1]2 : f (x, y) = 1 +
R−1 (1 + sin(6π(x + y))). 2
We solve the eikonal equation on a 1000 × 1000 grid with the boundary condition u(1/2, 1/2) = 0 as we vary R from 1 to 1024. Figure 5.26 shows the execution times for the first-order, adjacent-diagonal scheme. Figure 5.27 shows results for the second-order, adjacent-diagonal scheme. We see that varying R has little effect on the performance of the FMM. It has a moderate effect on the performance of the MCC algorithm. As expected, the execution time increases with increasing R. However, the increase is modest because a correctness test is an inexpensive operation compared to a labeling operation using the finite difference scheme. The MCC algorithm outperforms the FMM for all tested values of R.
207 FMM and MCC - 2nd-Order, Adj-Diag Execution Time (sec)
7 6 5 4 3 2 FMM MCC
1 0 1
10 100 Maximum to Minimum Speed Ratio
1000
Figure 5.27: Log-log plot of the execution time versus the ratio of the maximum to minimum propagation speed in the eikonal equation. We compare the Fast Marching Method and the Marching with a Correctness Criterion algorithm using a secondorder, adjacent-diagonal scheme.
5.9
Extension to 3-D
In this section we extend the previous results in this chapter and consider the eikonal equation |∇u|f = 1 in 3-D. As before, finite difference schemes that use three adjacent grid points are not suitable for the MCC algorithm. We will devise a scheme that uses adjacent and diagonal neighbors to do the differencing. We will examine the performance of the adjacent-diagonal difference scheme and then compare the execution time of the FMM to that of the MCC algorithm.
5.9.1
Adjacent-Diagonal Difference Schemes
We first consider the first-order, adjacent difference scheme. The adjacent difference scheme in 3-D differences in the three coordinate directions. When a grid point becomes known, it uses three formulas for updating the values of its adjacent neighbors. First, only the solution at that known grid point is used. Thus difference adj() computes the solution using a single known adjacent neighbor.
208 difference adj( a ): return a + ∆x/f Second, in difference adj adj() the solution at the labeled grid point is computed using pairs of known adjacent solutions. One of these is the grid point that was just determined to be known, the other is a known grid point in an orthogonal direction. In this function we test whether the characteristic comes from the region between the two grid points before we compute the solution.
difference adj adj( a, b ): if |a − b| ≤ ∆x/f: � � p return a + b + 2∆x2 /f 2 − (a − b)2 /2 return ∞ Finally, in difference adj adj adj() the solution at the labeled grid point is computed using triples of known adjacent solutions. One of these is the grid point that was just determined to be known, the other two are known grid points in orthogonal directions. Here it is easiest to test that the characteristic comes from the correct octant after we compute the solution.
difference adj adj adj( a, b, c ): s=a+b+c discriminant = s2 − 3 (a2 + b2 + c2 − ∆x2 /f 2 ) if disc ≥ 0:
� � √ soln = s + discriminant /3 if soln ≥ a and soln ≥ b and soln ≥ c: return soln
return ∞ We develop a correctness criterion for the above first-order, adjacent scheme. We follow the same approach as for the correctness criteria in 2-D. We will determine a
209 lower bound on the solution at a labeled grid point using the assumption that it has at least one unknown neighbor. If the predicted solution there is no larger than this lower bound, then it must be correct. Let µ be the minimum solution among the labeled grid points. The correct solution at any unknown adjacent neighbors may be as low as µ. We determine the smallest predicted solution using an unknown neighbor. The solution at the known neighbor may be as small as µ − ∆x. (If it were smaller, the solution at the labeled grid point would be less than µ.) We obtain a lower bound by using one unknown neighbor with a value of µ and two known neighbors with values of µ − ∆x in the difference scheme. This yields a predicted solution of µ for the labeled grid point. Thus µ is our lower bound; any labeled grid point with solution less than or equal to µ is correct. This is the same correctness criterion used in the Fast Marching Method. As in 2-D, we see that the 3-D adjacent difference scheme is not suitable for the MCC algorithm. We introduce a new stencil in analogy with the 2-D adjacent-diagonal difference scheme. Again, instead of differencing only in the coordinate directions, we consider differencing in the diagonal directions as well. In 3-D, we adopt the terminology that diagonal directions lie between two coordinate directions and corner directions lie between three coordinate directions. Thus an interior grid point has 6 adjacent, 12 diagonal and 8 corner neighbors. Figure 5.28 first shows the adjacent stencil that uses the 6 adjacent grid points. On the left we show the points alone. On the right we connect triples of points that are used in the adjacent finite difference scheme. If the characteristic passes through a triangle face, then those three points are used to predict a solution. The characteristic may approach through any of the 8 faces. There are a total of 26 ways in which the solution may be predicted: 6 ways from a single adjacent point (the corner of a triangle face), 12 ways from a pair of adjacent points (the side of a triangle face) and 8 ways from a triple of adjacent points that form a triangle face. Figure 5.28 next shows a stencil that uses the 6 adjacent and 12 diagonal grid points to increase the number of directions in which information can flow. On the left we show the points alone. On the right we connect triples of points that are used
210
Figure 5.28: The 7-point, adjacent stencil and the 19-point, adjacent-diagonal stencil. in the finite difference scheme. Again, if the characteristic passes through a triangle face, then those three points are used to predict a solution. The characteristic may approach through any of the 32 faces. By differencing in an adjacent direction, we can approximate ∂u/∂x, ∂u/∂y or ∂u/∂z. By differencing in a diagonal direction we can determine the sum or difference of two of these. There are a total of 98 ways in which the solution may be predicted: 6 ways from a single adjacent point, 12 ways from a single diagonal point, 24 ways from an adjacent-diagonal pair, 24 ways from a pair of diagonal points, 24 ways from an adjacent-diagonal-diagonal triple and 8 ways from a triple of diagonal points. Below we give the six functions for computing the predicted solution using known neighbors of a labeled grid point. difference adj() uses a single adjacent neighbor. difference diag() uses a single diagonal neighbor. difference adj diag() uses an adjacent and a diagonal neighbor and difference diag diag() uses two diagonal neighbors. These two functions check that the characteristic passes between the grid points before computing the predicted solution. difference adj diag diag() uses one adjacent and two diagonal neighbors. When testing that the characteristic passes through the
211 triangle face, it tests the two adjacent-diagonal sides before computing the predicted solution and tests the diagonal-diagonal side after. difference diag diag diag() uses three diagonal neighbors. It tests that the characteristic passes through the triangle face after computing the predicted solution.
difference adj( a ): return a + ∆x/f
difference diag( a ): √ return a + 2 ∆x/f
difference adj diag( a, b ): √ if 0 ≤ a − b ≤ ∆x/( 2 f): p return a + ∆x2 /f 2 − (a − b)2 return ∞
difference diag diag( a, b ): √ if |a − b| ≤ ∆x/( 2 f): p return a + b + 6∆x2 /f 2 − 3(a − b)2 return ∞
difference adj diag diag( a, b, c ): if a ≥ b and a ≥ c: discriminant = ∆x2 /f 2 − (a − b)2 − (a − c)2 if discriminant ≥ 0: √ soln = a + discriminant
212 if soln ≥ 3a − b − c: return soln return ∞
difference diag diag diag( a, b, c ): discriminant = 3∆x2 /f 2 − (a − b)2 − (b − c)2 − (c − a)2 if discriminant ≥ 0: � � √ soln = a + b + c + 2 discriminant /3 if soln ≥ 3a − b − c and soln ≥ 3b − c − a and soln ≥ 3c − a − b: return soln return ∞
5.9.2
Performance Comparison of the Finite Difference Schemes
5.9.2.1
Test Problems
We consider three test problems which are analogous to the 2-D test problems. In each problem the distance is computed from a point or set of points. We consider cases in which the solution is smooth, the solution has high curvature and the solution has shocks, i.e., the solution is not everywhere differentiable. Each grid spans the domain [−1/2..1/2]3 . For the smooth solution, the distance is computed from a single point at (−3/4, −3/4, −3/4). Next the distance is computed from a single point in the center of the grid. The difference schemes will make the largest errors near the center where the solution has high curvature. For the third test problem, the distance is computed from 26 points on the sphere of unit radius, centered at the origin. There are shocks along planes that are equidistant from two points. This test case produces shock planes at a variety of angles.
213 L1 Error in Smooth Solution 1st Order, Adjacent 1st Order, Adj-Diag
0.016
L1 Error
0.008 0.004 0.002 0.001 0.0005 0.08
0.04
0.02 0.01 Grid Spacing
0.005 0.0025
Maximum Error in Smooth Solution 1st Order, Adjacent 1st Order, Adj-Diag
Maximum Error
0.04 0.02 0.01 0.005 0.0025 0.00125 0.08
0.04
0.02 0.01 Grid Spacing
0.005 0.0025
Figure 5.29: L1 and L∞ error for a smooth solution. Log-log plot of the error versus the grid spacing. 5.9.2.2
Convergence
Smooth Solution. We examine the convergence of the solution using the two difference schemes. The first graph in Figure 5.29 shows the L1 error versus the grid spacing for grids ranging in size from 103 to 4003 . We see that going from an adjacent stencil to an adjacent-diagonal stencil reduces the error by about a factor of 2. The L∞ error shows the same behavior. Table 5.4 shows the numerical rate of convergence for the difference schemes. We see that for the smooth solution, both of these first-order schemes have first-order
214 convergence. Scheme L1 L∞ First-Order, Adjacent 0.982 0.969 First-Order, Adjacent-Diagonal 0.989 0.979
Table 5.4: Convergence to a smooth solution.
Solution with High Curvature. Next we examine the convergence of the solution with high curvature using the two difference schemes. The first graph in Figure 5.30 shows the L1 error versus the grid spacing for grids ranging in size from 103 to 4003 . Using an adjacent-diagonal stencil still reduces the error by about a factor of 2. The L∞ error shows the same behavior. Table 5.5 shows the numerical rate of convergence for the two difference schemes. For the solution with high curvature, these first-order schemes have less than firstorder convergence. For both the adjacent and the adjacent-diagonal schemes it is about 0.8. Scheme L1 L∞ First-Order, Adjacent 0.799 0.809 First-Order, Adjacent-Diagonal 0.807 0.816
Table 5.5: Convergence to a solution with high curvature.
Solution with Shocks. Finally we examine the convergence of the solution with shocks using the two difference schemes. The first graph in Figure 5.31 shows the L1 error versus the grid spacing for grids ranging in size from 103 to 4003 . Yet again, using an adjacent-diagonal stencil reduces the error by about a factor of 2. The L∞ error shows the same behavior. Table 5.6 shows the numerical rate of convergence for the solution with shocks using the two difference schemes. The convergence for both schemes is a little less than first-order. The adjacent-diagonal scheme has a slightly higher rate of convergence.
215
L1 Error in Solution with High Curvature 1st Order, Adjacent 1st Order, Adj-Diag
L1 Error
0.04 0.02 0.01 0.005 0.0025 0.08
0.04
0.02 0.01 Grid Spacing
0.005 0.0025
Maximum Error in Solution with High Curvature 1st Order, Adjacent 1st Order, Adj-Diag
Maximum Error
0.08 0.04 0.02 0.01 0.005 0.08
0.04
0.02 0.01 Grid Spacing
0.005 0.0025
Figure 5.30: L1 and L∞ error for a solution with high curvature. Log-log plot of the error versus the grid spacing.
216
L1 Error in Solution with Shocks 1st Order, Adjacent 1st Order, Adj-Diag
L1 Error
0.004 0.002 0.001 0.0005 0.00025 0.08
0.04
0.02 0.01 Grid Spacing
0.005 0.0025
Maximum Error
Maximum Error in Solution with Shocks 1st Order, Adjacent 1st Order, Adj-Diag
0.02 0.01 0.005 0.0025 0.00125 0.08
0.04
0.02 0.01 Grid Spacing
0.005 0.0025
Figure 5.31: L1 and L∞ error for a solution with shocks. Log-log plot of the error versus the grid spacing.
217 Scheme L1 L∞ First-Order, Adjacent 0.943 0.924 First-Order, Adjacent-Diagonal 0.961 0.948
Table 5.6: Convergence to a solution with shocks.
Time per Grid Point (microsec)
Fast Marching Methods in 3-D 1st Order, Adjacent 1st Order, Adj-Diag 30 20 10 0 1000
10000 100000 1e+06 1e+07 Number of Grid Points
Figure 5.32: Log-log plot of the execution time per grid point versus the number of grid points for the fast marching method with different stencils. We show the algorithm with a first-order, adjacent scheme and a first-order, adjacent-diagonal scheme. 5.9.2.3
Execution Time
Figure 5.32 shows the execution times for the two difference schemes using the Fast Marching Method. The distance from a center point is computed on grids ranging in size from 103 to 4003 . Using the adjacent-diagonal stencil is more computationally expensive than using the adjacent stencil. The execution time per grid point increases as the grid grows. However, the performance difference between each of the methods remains roughly constant. This reflects the fact that the cost per grid point of labeling does not depend on the grid size, but the cost per grid point of maintaining the binary heap increases with the increasing grid size.
218
Time per Grid Point (microsec)
Ordered Upwind Methods - 1st Order, Adj-Diag FMM MCC Ideal
30 20 10 0 1000
10000 100000 1e+06
1e+07
Number of Grid Points
Figure 5.33: Log-log plot of the execution time per grid point versus the number of grid points for the fast marching algorithm, the marching with a correctness criterion algorithm and the ideal algorithm using the first-order, adjacent-diagonal scheme.
5.9.3
The FMM versus the MCC Algorithm
We compare the execution times of the MCC algorithm and the FMM using the firstorder, adjacent-diagonal scheme. Again we implement a method that measures the execution time of an ideal algorithm for solving static Hamilton-Jacobi equations with an ordered, upwind scheme. Figure 5.33 shows the execution times. The performance of the MCC algorithm comes close to that of the ideal algorithm. None of these show exactly linear scalability. The execution time per grid point increases by 13% and 32% and the grid size varies from 103 to 4003 for the ideal algorithm and the MCC algorithm, respectively. We believe this effect is due to the increased cost of accessing memory as the memory usage increases. That is, with larger grids there will be more cache misses so the cost of accessing a single grid value increases. This phenomenon has less of an effect on the ideal algorithm because it does not access the solution or status arrays in determining which grid points should become known. We can see the N log N complexity of the FMM, but it still performs well. For the largest grid size, its execution time is 88% higher than that of the MCC algorithm.
219
5.10
Concurrent Algorithm
Consider solving a static Hamilton-Jacobi equation on a shared-memory architecture with P processors. It is easy to adapt the sequential MCC algorithm to a concurrent one. At each step in the algorithm the minimum labeled solution is determined, the correctness criterion is applied to the labeled set and then the correct grid points label their neighbors. Each of these operations may be done concurrently. Each processor is responsible for 1/P of the labeled grid points. The minimum labeled solution is found by having each processor examine its share of the labeled grid points and then taking the minimum of the the P values. Then each processor applies the correctness criterion and labels neighbors of known grid points exactly as in the sequential algorithm. The computational complexity of the concurrent algorithm is O(N/P + P ). (The O(P ) term comes from taking the minimum of the P values to determine the minimum labeled solution and from equitably dividing the labeled grid points.) The Fast Marching Method is not amenable to this kind of concurrency since only a single labeled grid point is determined to be correct at a time. Next consider solving a static Hamilton-Jacobi equation on a distributed-memory architecture with P processors with the MCC algorithm. We distribute the solution grid over the processors. Figure 5.10 show a 2-D grid distributed over 16 processors. In addition to its portion of the grid, each processor needs to store a ghost boundary that is as thick as the radius of the finite difference stencil. That is, it needs to store one extra row/column in each direction for a first order difference scheme and 2 extra rows/columns for a second-order difference scheme. In updating the boundary grid points, each processor communicates with up to four neighboring processors. In each step of the concurrent algorithm: 1) The processors communicate to determine the global value of the minimum labeled solution. 2) Each processor communicates the grid points along the edge of its grid that became known during the previous step. 3) Each processor performs one step of the sequential MCC algorithm. Consider a square 2-D grid with a first-order difference scheme. The MCC al√ gorithm will take O(R N ) steps. Where R is the ratio of the highest to lowest
220 0
1
2
3
4
5
6
7
8
9
10
11
12
13
14
15
0 1 2 3 0 1 2 3 0 1 2 3 4 5 6 7 4 5 6 7 4 5 6 7 8 9 10 11 8 9 10 11 8 9 10 11 12 13 14 15 12 13 14 15 12 13 14 15 0 1 2 3 0 1 2 3 0 1 2 3 4 5 6 7 4 5 6 7 4 5 6 7 8 9 10 11 8 9 10 11 8 9 10 11 12 13 14 15 12 13 14 15 12 13 14 15 0 1 2 3 0 1 2 3 0 1 2 3 4 5 6 7 4 5 6 7 4 5 6 7 8 9 10 11 8 9 10 11 8 9 10 11 12 13 14 15 12 13 14 15 12 13 14 15
Figure 5.34: Left: A distribution of a 2-D grid over 16 processors. Each processor has one array. Right: A distribution that would better balance the load. Each processor has 9 arrays. propagation speed. At each step, computing the global minimum labeled solution will take O(log P ) communications. During the course of the algorithm, a total of √ √ 4( P − 1) N grid points are communicated to neighboring ghost boundary regions. In addition, at each time step processors communicate the number of grid points they will send to their neighbors. Thus in each step, each processor sends and receives 4 integers to determine how many ghost grid points it will receive. Then on average √ √ each processor sends/receives O( P /(R N )) = O(1) grid points and computes cor√ rect values for O( N /(RP )) grid points using the sequential MCC algorithm. This is a rosy picture except for the “on average” qualification. With the data distribution shown on the left in Figure 5.10 we would expect a poor load balance. That is, we would expect that at any given point in the computation some processors would have many labeled grid points while others would have few or none. Thus some processors would do many finite difference computations while others would do none. If the computation were balanced, then the computational complexity would √ be O(R N log P + N/P ). We could help balance the computational load by choosing a different data distribution. For the one shown on the right in Figure 5.10 we first divide the grid into 9
221 sub-arrays. Then we distribute the sub-arrays as before. Each processor still communicates with the same 4 neighbors, but the total number of grid points communicated √ √ √ is increased to 4( P M − 1) N , where M is the number of sub-arrays. Each processor performs the sequential MCC algorithm on M grids. Let L be the average load imbalance, where the load imbalance is defined as the ratio of the maximum processor load to the average processor load. If P M � N then the computational complexity √ of the concurrent MCC algorithm is O(R N log P + LN/P ). Note that any algorithm based on an adjacent difference scheme is ill suited to a distributed-memory concurrent algorithm. This is due to the large numerical domain of dependence of these schemes. A grid point (i, j, . . .) with solution s may depend on a grid point whose solution is arbitrarily close to s and whose location is arbitrarily far away from (i, j, . . .). (See Figure 5.4 for an example.) This phenomenon would prevent concurrent algorithms from having an acceptable ratio of computation to communication.
5.11
Future Work
As introduced in Section 4.7, one could use a cell array data structure to reduce the computational complexity of the MCC algorithm. This is the approach presented by Tsitsiklis. (See Section 5.5.) Tsitsiklis predicted that this method would not be as efficient as his Dijkstra-like algorithm. However, based on our experience with the MCC algorithm, we believe that this approach would outperform the FMM as well. We consider the eikonal equation |∇u|f = 1 in K-dimensional space, solved on the unit domain, [0..1]K . Let the values of f be in the interval [A..B] and let R = B/A. Each cell in the cell array holds the labeled grid points with predicted solutions in the interval [n √∆x ..(n + 1) √∆x ) for some integer n. Consider the MCC algorithm 2B 2B in progress. Let µ be the minimum labeled solution. The labeled distances are in √ √ 2B c. The first cell in the cell array the range [µ..µ + 2∆x/A). We define m = bµ ∆x ..(m + 1) √∆x ). By the correctness holds labeled grid points in the interval [m √∆x 2B 2B criterion, all the labeled grid points in this cell are correct. We intend to apply
222 the correctness criterion only to the labeled grid points in the first cell. If they labeled their neighbors, the neighbors would have predicted solutions in the interval [µ +
√∆x ..µ 2B
+
√∆x 2B
√
+
2∆x ). A
to span the interval [µ..µ +
Thus we need a cell array with d2R + 1e cells in order √∆x 2B
√
+
2∆x ), A
which contains all the currently labeled
solutions and the labeled solutions resulting from labeling neighbors of grid points in the first cell. At each step of the algorithm, the grid points in the first cell become known and label their neighbors. If an unlabeled grid point becomes labeled, it is added to the appropriate cell. If a labeled grid point decreases its predicted solution, it is moved to a lower cell. After the labeling, the first cell is removed and an empty cell is added at the end. Just as the FMM requires storing an array of pointers into the heap of labeled grid points, this modification of the MCC algorithm would require storing an array of pointers into the cell array. Now consider the computational complexity of the MCC algorithm that uses a cell array to store the labeled grid points. The complexity of adding or removing a grid point from the labeled set is unchanged, because the complexity of adding to or removing from the cell array is O(1). The cost of decreasing the predicted solution of a labeled grid point is unchanged because moving a grid point in the cell array has cost O(1). We reduce the cost of applying the correctness criterion from O(RN ) to O(N ) because each grid point is “tested”‘ only once. We must add the cost of examining cells in the cell array. Let D be the difference between the maximum and minimum values of the solution. Then in the course of the computation, D/ √∆x cells will be examined. 2B The total computational complexity of the MCC algorithm with a cell array for the labeled grid points is O(N + BD/∆x). Note that for pathological cases in which a characteristic weaves through most of the grid points, D could be on the order of ∆xN/A. (See Figure 5.35 for an illustration of such a pathological case.) In this case BD/∆x ≈ RN and the computational complexity is the same as that for the plain MCC algorithm. However, for reasonable problems we expect that D = O(1/A). In this case the computational complexity is O(N + R/∆x) = O(N + RN 1/K ) = O(N ).
223
Figure 5.35: A pathological case in which a characteristic weaves through most of the grid points. We show a 9 × 9 grid. Green grid points have a high value of f while red grid points have a low value. If the initial condition were specified at the lower, left corner then there would be a characteristic roughly following the path of green grid points from the lower left corner to the upper right corner.
5.12
Conclusions
Sethian’s Fast Marching Method is an efficient method for solving static HamiltonJacobi equations. It orders the finite difference operations using a binary heap. The computational complexity is O(N log N ) where N is the number of grid points. For grid sizes of 106 , the cost of the finite difference operations (O(N )) is of the same order as the cost of the heap operations (O(N log N )). Applying the Marching with a Correctness Criterion methodology to solving static Hamilton-Jacobi equations requires the use of adjacent-diagonal finite difference schemes. Typical upwind schemes difference in adjacent (coordinate) directions. Adjacentdiagonal schemes difference in both adjacent and diagonal directions. They reduce the numerical domain of dependence and enable efficient correctness criteria to be applied. In addition, they offer greater accuracy, but are computationally more expensive. The Marching with a Correctness Criterion algorithm produces the same solution as the Fast Marching Method, but with computational complexity O(RN ) where R is the ratio of the highest to lowest propagation speed. Its execution times come close to those of an ideal ordered, upwind, finite difference method. (For an ideal method, the cost of ordering the grid points would be negligible.) In practice, the
224 MCC algorithm has modestly lower execution times than the FMM and typically uses 1/4 less memory. For a grid size of 106 , the MCC algorithm executes in about half the time of the FMM. The computational complexity of the MCC Algorithm can be reduced to O(N ) by using a cell array to store the labeled grid points.
225
Chapter 6 Future Work We have presented conclusions and areas for future work in each of the previous chapters. Here we present a few ideas for future work that do not directly fall under topics covered thus far.
6.1
Greedier Algorithms
Dijkstra’s algorithm and Sethian’s Fast Marching Method are examples of greedy algorithms. At each step of a greedy algorithm there are a certain number of alternatives from which to choose. In Dijkstra’s algorithm there is a set of labeled vertices on which the distance has been predicted. In a greedy algorithm the single best alternative is always chosen. For Dijkstra’s algorithm the labeled vertex with smallest distance is chosen. The greedy method can be used to solve many problems, including Huffman code trees, task scheduling and minimum spanning trees. The Marching with a Correctness Criterion algorithm presented for the singlesource shortest-paths problem and for solving static Hamilton-Jacobi equations can be termed greedier algorithms. Again at each step of the algorithm there are a certain number of alternatives from which to choose. The greedier method is to choose as many of these alternatives as possible. In the Marching with a Correctness Criterion algorithm for computing the single-source shortest paths there is again a set of labeled vertices on which the distance has been predicted. However, we choose all of the vertices which can be determined to have correct values for the distance.
226 The greedier method may be applicable to other problems. In particular, it can be applied to the minimum spanning tree problem, which we explain in the next section.
6.2
Minimum Spanning Trees
Consider a weighted, undirected graph with V vertices and E edges. A set of V − 1 edges that connect all of the vertices is called a spanning tree. Let w be the weight function, which maps edges to real numbers. The weight of a tree in the graph is the sum of the weights of the edges in the tree. A minimum spanning tree is a tree of minimum weight that spans the graph. Such a tree need not be unique. The most common algorithms for solving the minimum spanning tree problem are Kruskal’s algorithm and Prim’s algorithm. Both are greedy algorithms and have computational complexity O(E log V ) when implemented with binary heaps. Both algorithms use the following property of minimum spanning trees: Let S be a subset of some minimum spanning tree. The set of edges S divides the graph into connected components. For any minimum weight edge e connecting two components, S + e is a subset of some minimum spanning tree.
6.2.1
Kruskal’s Algorithm
Kruskal’s algorithm [9] grows the minimum spanning tree by repeatedly adding the minimum weight edge that connects two components. It does this by first sorting all the edges and by keeping track of the connected components as sets with a disjoint-set data structure [9]. This data structure has three member functions: make set(u) creates a new set whose only member is u. find set(u) returns an identifier for the set containing u. union(u,v) merges the sets containing u and v.
227 Kruskal( graph ): MST = ∅ ds = disjoint-set data structure for vertex in graph.vertices: ds.make set( vertex ) Sort graph.edges by weight. for (u,v) in graph.edges: if ds.find set(u) 6= ds.find set(v): MST += (u,v) ds.union(u,v) return MST Sorting the edges takes O(E log E) time. The V make set() operations add O(V ). The disjoint-set data structure can be implemented so that the O(E) find set() and union() operations cost O(Eα(V )) where α(V ) = O(log V ). The total complexity for the algorithm is O(E log E). Since E ≤ V (V − 1)/2, log E = O(log V ). Thus we can rewrite the complexity as O(E log V ).
6.2.2
Prim’s Algorithm
Prim’s algorithm is very similar to Dijkstra’s algorithm. Prim’s algorithm maintains a tree that is a subset of the minimum spanning tree. At each step it adds the smallest edge connecting a vertex which is not in the tree. Initially, the tree is an arbitrarily chosen vertex. The vertices that are not connected to the tree are stored in a priority queue. The key for each vertex is the weight of the smallest edge connecting the vertex to the tree. As the algorithm progresses, vertices are removed from the queue with extract minimum() and the keys of vertices are decreased with decrease key(). Below is Prim’s algorithm.
Prim( graph ): for vertex in graph.vertices:
228 vertex.key = ∞ vertex.predecessor = None root = any vertex in graph.vertices root.key = 0 queue = graph.vertices while queue 6= ∅: vertex = queue.extract minimum() for edge in vertex.edges: neighbor = edge.target if neighbor ∈ queue and edge.weight < neighbor.key: neighbor.key = edge.weight neighbor.predecessor = vertex queue.decrease key( neighbor ) MST = ∅ for vertex in graph.vertices: if vertex.predecessor 6= None: MST += vertex.predecessor return MST If the priority queue is implemented with a binary heap, the computational complexity of Prim’s algorithm is O(E log V ).
This is because there are O(V ) ex-
tract minimum() operations and O(E) decrease key() operations, each of which cost O(log V ).
6.2.3
A Greedier Algorithm
The first algorithm for solving the minimum spanning tree problem was published in 1926. Boruvka’s ˙ algorithm [30] maintains a forest of trees that form a subset of the minimum spanning tree. It takes a concurrent approach to adding edges. At each step, for each tree we find the smallest edge which connects the tree to the rest of the graph. Then all of these edges are added. Initially each vertex is a tree in
229 the forest. At each step, the number of trees decreases by at least a factor of 2. Thus the algorithm takes at most log V steps. Since O(E) edges are examined each step, the computational complexity of the algorithm is O(E log V ). Below we outline Boruvka’s ˙ algorithm.
Boruvka( ˙ graph ): MST = ∅ forest = graph.vertices while forest has more than one tree: For each tree, find the smallest edge connecting it to the rest of the graph. Add all of these smallest edges to MST. Merge the trees that have become connected. return MST Boruvka’s ˙ algorithm has a greedier approach to adding edges to the minimum spanning tree. We add a greedier approach to deleting edges which are not in the minimum spanning tree. After the trees have been merged, a given tree may have multiple edges connecting it to another tree. Only one of these edges, namely the one with lowest weight, could possibly be in the minimum spanning tree. We may delete the rest so that we do not have to examine them in subsequent steps. We outline this greedier algorithm below.
greedier( graph ): MST = ∅ forest = graph.vertices while forest has more than one tree: For each tree, find the smallest edge connecting it to the rest of the graph. Add all of these smallest edges to MST. Merge the trees that have become connected. Where multiple edges connect trees, remove all but the smallest edge.
230 return MST At each step of the algorithm, both the number of trees and the number of edges decreases. We number the steps starting with k = 0. At the k th step there are no more than V 2−k trees. By only counting the edges that are removed from consideration by adding them to the minimum spanning tree, we see that there can be no more than E −V (1−2−k ) edges. A graph with n vertices can have no more than n(n−1)/2 edges. Thus we see that at the k th step there can also be no more than V 2−k (V 2−k − 1)/2 edges. We use these two bounds to obtain the computational complexity for the greedier algorithm. log V
O
X �V k=0
2k
�
+ min E − V (1 − 2−k ),
V 2k+1
�
���! V −1 2k
We can simplify this expression by bounding the latter term in the minimum function. log V
O V +
X
�
min E − V (1 − 2−k ),
k=0
V2 22k+1
�!
Of the two terms in the minimum function, the former decreases slowly while the latter decreases geometrically. We bound the step at which the latter expression is the smaller. V2 E − V = 2k+1 2 � � 1 V2 k= log −1 2 E−V Once the problem size starts decreasing geometrically, all of the subsequent steps cost no more than the current step. It takes at most O(log V 2 /(E − V )) steps for the number of edges to decrease geometrically. During these steps, there are O(E) edges. Thus the computational complexity of the greedier algorithm is V2 O E log E−V �
�
.
231
6.3
Adjacent-Diagonal Difference Schemes
The adjacent-diagonal difference schemes we developed for static Hamilton-Jacobi equations in Section 5.5 may be applicable to other classes of equations. Certainly they should suitable for time dependent Hamilton-Jacobi equations: ut + H(x, t, u, Du) = 0. For these, one uses the same upwind, difference schemes for the spatial derivatives as for static Hamilton-Jacobi equations. Based on our analysis of the static problem, we expect that using adjacent-diagonal schemes for the time dependent problem would also yield modest reductions in the error.
232
Bibliography [1] S. W. Attaway, B. A. Hendrickson, S. J. Plimpton, D. R. Gardner, C. T. Vaughan, K. H. Brown, and M. W. Heinstein. A parallel contact detection algorithm for transient solid dynamics simulations using PRONTO3D. Computational Mechanics, 22(2):143–159, 8 1998. [2] M. H. Austern. Generic programming and the STL: using and extending the C++ Standard Template Library. Addison Wesley Longman, Inc., Reading, Massachusetts, 1999. [3] Martino Bardi and Italo Capuzzo-Dolcetta. Optimal Control and Viscosity solutions of Hamilton-Jacobi Equations. Birkh¨auser, Boston, 1997. [4] J. L. Bentley and J. H. Friedman. Data Structures for Range Searching. Computing Surveys, 11(4):397–409, 12 1979. [5] D. E. Breen and S. P. Mauch. Generating Shaded Offset Surfaces with Distance, Closest-Point and Color Volumes. In Proceedings of the International Workshop on Volume Graphics, pages 307–320, 3 1999. [6] D. E. Breen, S. P. Mauch, and R. T. Whitaker. 3D Scan Conversion of CSG Models Into Distance Volumes. In Proceedings of the 1998 Symposium on Volume Visualization, ACM SIGGRAPH, pages 7–14, 10 1998. [7] D. E. Breen, S. P. Mauch, and R. T. Whitaker. 3D Scan Conversion of CSG Models into Distance, Closest-Point and Colour Volumes, pages 135–158. Springer, London, 2000.
233 [8] Boris V. Cherkassky, Andrew V. Goldberg, and Tomasz Radzik. Shortest Paths Algorithms: Theory and Experimental Evaluation. Mathematical Programming, 73(2):129–174, 5 1996. [9] Thomas H. Cormen, Charles E. Leiserson, Ronald L. Rivest, and Clifford Stein. Introduction to Algorithms, Second Edition. The MIT Press, Cambridge, Massachusetts, 2001. [10] J. L. Davis. Wave Propagation in Solids and Fluids. Springer-Verlag, New York, 1988. [11] Eric F. Van de Velde. Concurrent Scientific Computing. Springer-Verlag, New York, 1994. [12] L. C. Evans. Partial Differential Equations. American Mathematical Society, Providence, Rhode Island, 1998. [13] R. P. Fedkiw. Coupling an Eulerian fluid calculation to a Lagrangian solid calculation with the ghost fluid method. Journal of Computational Physics, 175:200–224, 1 2002. [14] J. D. Foley, A. van Dam, S. K. Feiner, and J. F. Hughes. Computer Graphics: Principles and Practice. Addison-Wesley, Reading, Massachusetts, 1996. [15] S. Fortune. A sweepline algorithm for Voronoi diagrams. Algorithmica, 2:153– 174, 1987. [16] Paul R. Garabedian. Partial Differential Equations. American Mathematical Society, Providence, Rhode Island, 1998. [17] M. W. Heinstein, S. W. Attaway, F. J. Mello, and J. W. Swegle. A generalpurpose contact detection algorithm for nonlinear structural analysis codes. Technical report, Sandia National Laboratories, Albuquerque, NM, 1993.
234 [18] D. E. Johnson and E. Cohen. A Framework for Efficient Minimum Distance Computations. In Proc. IEEE Intl. Conf. Robotics & Automation, Leuven, Belgium, pages 3678–3684, May 1998. [19] C. Y. Kao, S. Osher, and Y. R. Tsai. Fast Sweeping Methods for Static HamiltonJacobi Equations. Technical report, Department of Mathematics, University of California, Los Angeles, 2002. [20] T. A. Laursen and J. C. Simo. On the formulation and numerical treatment of finite deformation frictional contact problems., pages 716–736. Springer-Verlag, Berlin, 1987. [21] P. L. Lions. Generalized Solutions of Hamilton-Jacobi Equations. Pitman Publishing Inc., 1020 Plain Street, Marshfield, Massachusetts, 1982. [22] W. E. Lorensen and H. E. Cline. Marching Cubes: A High Resolution 3D Surface Construction Algorithm. Computer Graphics, 21(4), 1987. [23] E. Morano M. Arienti, P. Hung and J. Shepherd. A Level Set Approach to Eulerian-Lagrangian Coupling. In preparation. [24] A. Okabe, B. Boots, K. Sugihara, and S. N. Chiu. Spatial Tessellations: Concepts and Applications of Voronoi Diagrams. Wiley & Sons, New York, 2000. [25] S. Osher and J. A. Sethian. Fronts Propagating with Curvature-Dependent Speed: Algorithms Based on Hamilton-Jacobi Formulations. Journal of Computational Physics, 79:12–49, 1988. [26] Stanley Osher and Ronald Fedkiw. Level Set Methods and Dynamic Implicit Surfaces. Springer-Verlag, New York, 2003. [27] J. A. Sethian. A Fast Marching Level Set Method for Monotonically Advancing Fronts. In Proc. Nat. Acad. Sci., volume 94, pages 1591–1595, 4 1996. [28] J. A. Sethian. Fast Marching Methods. SIAM Review, 41:199–235, 1999.
235 [29] J. A. Sethian. Level Set Methods and Fast Marching Methods. Cambridge University Press, Cambridge, United Kingdom, 1999. [30] Robert E. Tarjan. Data Structures and Network Algorithms. Society for Industrial and Applied Mathematics, Philadelphia, Pennsylvania 19103, 1983. [31] Y. R. Tsai. Rapid and Accurate Computation of the Distance Function Using Grids. Technical report, Department of Mathematics, University of California, Los Angeles, 2000. [32] John N. Tsitsiklis. Efficient Algorithms for Globally Optimal Trajectories. IEEE Transactions on Automatic Control, 40(9):1528–1538, 9 1995. [33] Alan Watt. 3D Computer Graphics. Addison-Wesley, Reading, Massachusetts, 1993. [34] Daniel Zwillinger. Handbook of Differential Equations, Second Edition. Academic Press, Inc., 1250 Sixth Avenue, San Diego, CA 92101, 1992.
236
Index adjacent-diagonal difference scheme, 182, 207, 231 binary search, 50, 80 bucket array, 71 buckets, 56
forward searching, 111, 113 greedier algorithms, 225 Hamilton-Jacobi equation, 1 Cauchy problem, 1 Dirichlet problem, 1
cell array, 71
static, 1
cells, 56
time dependent, 1
characteristic projected, 2
kd-tree, 64 Kruskal’s algorithm, 226
characteristic strip equations, 2 characteristics, 2 closest point transform, 19 on a mesh, 46 computational geometry, 13 contact detection, 47 difference scheme adjacent-diagonal, 182, 207
labeling, 134 marching with a correctness criterion, 140, 176 MCC, 140 cell array, 164 concurrent, 162 method of characteristics, 2
Dijkstra’s algorithm, 136
minimum spanning tree, 226
distance, 18
multiple orthogonal range queries, 113
distance transform, 19 eikonal equation, 2, 11, 15
octree, 70 optimal paths, 15 orthogonal range queries, 58
fast marching method, 169 orthogonal range query, 45 status array, 174
237 multiple, 113 point-in-box, 62 Prim’s algorithm, 227 projection, 60, 86 quadtree, 70
viscosity solutions, 4 Voronoi cell, 26 Voronoi diagram, 26 wave, 11 wave equation, 11 wave front, 11
range queries multiple, 108 range query, 49 range searching, 45 rasterization, 25 re-weighting edges, 165 relaxing, 134 scan conversion, 25 search tree, 52 sequential scan, 50, 60, 85 shortest path, 132 shortest-path single-pair, 132 shortest-paths all-pairs, 132 single-destination, 132 single-source, 132 sparse cell array, 76 status array, 174 storing keys, 118 surface offsetting, 15 upwind direction, 10 upwind finite difference scheme, 167