Efficient Energy Performance Indicators for Different Level of Production Organizations in Manufacturing Companies Hendro Wicaksono, Tim Belzner, Jivka Ovtcharova Institute for Information Management in Engineering, Karlsruhe Institute of Technology, Karlsruhe, Germany {
[email protected],
[email protected],
[email protected]}
Abstract. Demands for lower CO2 emissions due to the climate change and the rising of energy prices force manufacturing companies to deal with the energy issue. Energy management, where one of the tasks is energy efficiency evaluation, can help the companies to overcome the issue. This paper presents holistic metric to evaluate the energy efficiency in manufacturing companies, which considers the different organization level of production, such as machine or equipment level, production line level, and factory level. As the size of the scope and the number of observed factors vary, the metric provide flexible criteria to select relevant variables. The developed metric could be used to simulate and to compare energy efficiency of different production facilities, lines, and factories in a single company. The metric is an instrument to recognize how energy (in) efficient is a production system, so that adjustments may be made in the planning and management to achieve the energy savings.
1
Introduction
The global climate change, which is caused by the increase of CO2-emmisions, is a crucial issue in 21st century. Every sector including manufacturing is demanded to reduce the CO2-emissions. One of the important measures to achieve this is to use the energy more efficiently. However this is not an easy task. Demands on various and customized products have made the manufacturing processes more complex. The processes are often very energy intensive and therefore expensive. In order to minimize expenses in production, energy consumption has to be regulated. The corporate energy management is designed to support companies in this task. Energy management defines the sum of all processes and measures which are developed and implemented to ensure minimal energy consumption by given demand [1]. An energy management system (EnMS) is a systematic way to define the energy flows and as a basis for decision for investments to improve energy efficiency. Through an EnMS, the energy policy, planning, implementation and operation, monitoring and measurement, control and correction, internal audits, as well as a regular management review are designed and executed [2]. The standard ISO 50001 describes
the requirements for EnMS for industrial companies. Energy management systems that are built according to this standard can either be integrated into existing systems or implemented independently. The standard is based on the PDCA cycle (Plan-DoCheck-Act), where continuous improvement is possible [3]. This paper presents the development of energy performance indicators (EPI) to help the manufacturing companies in “Check” phase of the cycle. The indicators are used to measure energy efficiency degree of different levels of production organization in a single manufacturing company, namely machine or production facility, production line, and factory. The indicators provide a flexibility that allows the selection of relevant variables and definition of the observation system. In section 2 we present our analysis result on the existing energy efficiency measurement concepts and identify their advantages and deficiencies. Section 3 describes the first necessary step to calculate the energy efficiency metric namely the modeling the system boundaries and components. In section 4 we list the factor influencing the figure calculations. And then, we demonstrate the calculation of the figures for different levels of production organization in section 5.
2
Related Work
Figures to measure energy efficiency can be classified into absolute and relative figures. Absolute figures consider only the output values, whereas relative figures take into account the dependency of the output value with the given input. Further categories of energy efficiency figures are classification and relational figures. Classification figures represent the energy consumption portion of smaller part to the bigger part of a system. Relational figures describe the energy consumption based on cause-effect relation, for instance, energy consumption per produced product piece [4]. German Engineer Association (VDI) introduced technical figures related to energy evaluation namely energetic efficiency degree, utilization ratio, and specific energy demand [5]. The energy requirements relative to the amount of product depends very much on the type and quality of the product. For example production of a car requires more energy than a lamp. An approach that solves this problem is energy efficiency figure presented with the equation (1) [6]. [
]
(1)
This energy-efficiency measure also allows a comparison of systems that produce completely different products and can be applied in the machine level as well as in the factory level, even if different products with different quantities or qualities are produced. Some metric systems have been developed to evaluate the energy efficiency for entire industry sectors. The Energy Performance Indicator (EPI) from Energy Star considers the energy efficiency at the factory level. The data are reported by the participating companies each year and then can be compared in a tool. It is not possible to evaluate energy efficiency in operation level, since production process and equipment
change very quickly. To ensure comparability between different factories, separated benchmarking for different industrial sectors is created, for instance, for automotive industry [7], glass manufacturing [8], and cement industry [9-10]. The Energy Star EPI is a good tool to evaluate the energy efficiency to compare different factories in the same industry sector. However, in order to determine cause-effect relation, the concept is not suitable. The Odyssee Energy Efficiency Index (ODEX) is an index that determines energy efficiency progress in the main sectors (industry, transport, households) and the overall economy (all consumers) [11]. ODEX is designed to track developments of energy efficiency over time in the industry. It is not able to compare individual companies or factories. The International Energy Agency (IEA) developed MEEP (Measure(s) of Energy Efficiency Performance) consisting four types of figures that differ in their potential applications [12]. The fourth MEEP figure is interesting, since it can be estimated, how energy efficient is a factory or an entire industry sector. However, this figure cannot be applied at the machine level.
3
System Modeling
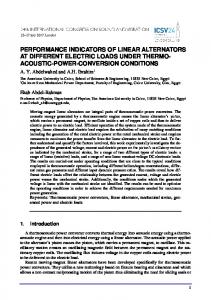
To develop energy efficiency metric for a single manufacturing company, first it is important to define the system boundaries and a model that covers the different organization levels of production. In our work we extend the UPN model [13] to UPNT model and consider the machine, production line and factory level. The basic elements of the UPNT model are energy conversion (U), production (P), ancillary (N), and transport (T) facilities. Only through the interaction of these facilities the production processes are conducted. Energy conversion facilities convert energy and deliver it in a processed form to the other systems (N, T, P). Examples of energy conversion facilities include tranformators, air compressors, steam generators, power plants etc. If an energy conversion facility is connected to internal energy network, where other sources including the ones from utility companies are connected, mix-costs from different sources is resulted in the network. Fig. 1 illustrates the method to calculate the mix-costs in the company’s internal energy network. Ancillary facilities provide the necessary conditions to achieve an unobstructed production. They serve the production directly or operating condition generally. Ancillary facilities include lighting, HVAC systems, coolant pumps, exhaust systems, etc. Facilities that are not located directly in production, such as kitchen appliances in the canteen are also considered as ancillary facilities. In principle, the transport facilities are included as ancillary facilities. However, they differ, because instead of being directly used by production facilities, they transport products to the next process step. It is very important, in particular, if the manufacturing company has different sites. Production facilities are the most important entities in the production, because they are used to manufacture the product. Based on the efforts in production process that executed by production facilities, the customers pay the production costs and the manufacturers earn the money. However, the production facilities depend on functioning conversion, ancillary and transport facilities to work.
Fig. 1. Method for calculating energy costs in company’s internal energy network
4
Influencing factors on the figures
As the basic in calculating energy efficiency degree, we use the ratio of output-input (effort) that is expressed with equation (2): (2) There are many factors that are considered influencing the input and output in our energy flow model. We consider the following factors influencing the production outputs that are used as the numerator in calculating the efficiency. Product quantity and characteristics. The influencing factors are not only product quantity, but also the qualitative characteristics of the products. Both of the influencing factors should be integrated as a unified parameter. Generated added value. The generated added value may not be known for each stage of production directly. It can be calculated by considering the values of incoming to outgoing products. Output Energy. The output of conversion facility is directly the amount of generated energy that is delivered in the production. Distance traveled between production facilities. Transport facilities are needed to carry the products or materials between production facilities. It is not an adding value, since it does not change the product value. The following list presents the factors that are taken into account in our work affecting the energy effort to manufacture products and determine the denominator in calculating the energy efficiency. Energy demand or consumption. The energy demand corresponds to the energy effort in executing a production process. It also can be easily measured. It is calculated through a certain time as integral of power over time. Energy form. Various energy forms have different characteristics, application areas, and costs. Energy price. The energy price takes into account all costs incurred in the generation of every form of energy.
Energy peak load. The energy peak load plays role in the costs incurred in providing the energy to the company. It corresponds to which amount of power should be provided to the company in a certain time, in order to ensure that the production activities are still running properly. Emission certificate efforts. Companies are demanded to get emission certificate because of the pollution and climate change issue. The costs to achieve emission certificate is considered in the calculation.
5
Calculation Model and Results
In the section we describe the developed methods to calculate the energy efficiency figures or Energy Performance Indicators (EPI) on machine, production line, and factory level. The calculations are based on the main principal as described by the equation (2). The main function of production facilities or machines is to create a new product or product part from source materials. As mentioned before, it is not appropriate to consider only product for evaluating energy efficiency. The solution is through considering also values generated by the production facilities. For example, if particleboard manufactured from waste wood, the value is greater than when they are produced from fresh wood. Fig. 2 depicts the energy flow model for machine level. From it can be seen, that the inputs of a production facility is made up from direct and an indirect ones. The direct inputs are from the energy and load supplied by utility companies or conversion facilities. The indirect inputs are generated due to the fact that the production facility receives the outputs of ancillary and transportation facility. The energy cost of a production facility is also ascribed from the output of the connected ancillary and transport facilities. The inputs of a production facility include proportion of used energy and load cost from ancillary and transport facilities, energy provided by conversion facilities, and energy form. Equation (3) calculates the energy performance index on machine/production facility level. The ratio i can be defined by the energy modeler or estimated for some kinds of facilities such as lighting and heating. On the production line level, the efficiency calculation is in principle the same as at the machine level, but with extended system boundary. It includes other ancillary and conversion facilities, which are not considered at machine level. Fig. 3 illustrates this relationship. Other facilities that are taken into account cannot be defined in general way. They must be decided individually. A question that leads to the decision, for example: Which facilities should be shut down if the entire production line is shut down? Such as facilities are for instance lighting systems or IT facilities for production line monitoring. Analogue to the equation (3), equation (4) computes the energy performance index for production line level. Similar to machine and production line level, the energy performance indicator on factory level is calculated with expanded system boundary. Only ancillary facilities that are used by production processes are considered in the calculation. The energy efforts of facilities belonging to other business departments such as sales, logistics is not taken into account. But social rooms, canteen etc. are taken in to consideration,
since they are used by the production personnel. Similar to line level, for the factory level the system boundary is widened again including those considered conversion and ancillary facilities.
Fig. 2. Energy flow model for machine level ∑
where
Vk Pk i Ai Tj
= = = = =
∑
(3)
output value generated by production facility k [€] input of production facility k [€] ratio of use inputted ancillary facility = [0,1]. inputted ancillary facility I [€] used transport facility j [€]
Fig. 3. Energy flow model for production line level
∑
∑
∑
∑
(4)
The EPI is applied in a stainless steel manufacturer. Table 1 shows examples of the calculation results in machine and production line levels. The entities having EPI less than one means that energy costs exceed the supply and therefore should not occur. Otherwise, it would be an alarm signal, because the process is extremely inefficient. Higher values are conceivable when a process generates a lot of values and /or require very little energy. A value greater than one does not automatically make a positive contribution margin, as there are other costs in addition to the energy costs. However, this is not the objective of the EPIs. Rather, they should provide a comparison of different alternatives in the choice of equipment to be used. As shown in table 1, the EPI can benchmark the energy efficiency of different machines, e.g. ovens, pressers, turning machines. It also shows the comparison of three production lines L1, L2, L3, which L3 is the most energy efficient production line. Table 1. EPI calculation results in stainless steel production
Description M: Oven M: Presser (1x) and Drop hammer (2x) M: Turning machine (3x) M: Boring Machine, CNC machine (1x) M: Ring roller(2x) L1: Oven (EPI = 21,0), Drop hammer (EPI = 21,9), Ringrolling (EPI = 15,5) L2: Oven (EPI = 49,6), Presser (EPI = 11,4), Ring-roller (EPI = 18,9), Rolling- machine (EPI = 21,7) L3: Oven (EPI = 30, 3), Drop hammer (EPI = 21,0), Rolling machine (EPI = 20,9),
6
EPI 21,0 –– 30,3 – 49,6 11,4 - 21,0 – 21,9 10,5 – 20,9 – 32,6 15,7- 17,7 15,5 – 18,9 19,5 19,3 21,3
Conclusions
So far, institutions and researchers has been developing energy performance indicators (EPI), which are used to measure and benchmark energy performance of different companies belonging to particular branch. This paper presents an approach to calculate EPI in a single manufacturing company. The EPI represents the ratio of total energy usage to the generated production value in different organization levels in production system, such as machine, production line, and factory level. The energy flow involving the production, ancillary, transport, and conversion facilities in the company should be defined first to perform EPI calculation. The energy flow is modeled based on extended UPN-Model. It considers also the external energy sources from utility companies. The energy flow model is mainly used to calculate the costs of input and output energy. We demonstrated the energy flow model for different levels of production organization. In this paper, we list the factors influencing the energy inputs and outputs. The formulas to calculate the EPI for different levels are
also illustrated. Furthermore we present some results of the EPI application in a stainless steel manufacturer. By using the developed EPI, production planners or facility managers are able to simulate and compare different production and facility configurations, in order to find the most energy efficient ones. However, the developed EPI is exclusively used for evaluating energy efficiencies within the companies. The EPI itself cannot be used directly for measuring the economic performance. Nevertheless, there is a strong relation of the EPI to other conventional metrics. The EPI may use the conventional metrics, such as total cost and cycle time to calculate the net production value and energy effort.
7
References
1. Deutsche Energie-Agentur: Energiemanagement. http://www.industrieenergieeffizienz.de/energiemanagement.html, accessed on April 2, 2012, (2012) 2. Kahlenborn, W., Kabisch, S., Klein, J., Richter, I., Schürmann, S.: DIN EN 16001: Energy Management Systems in Practice - A Guide for Companies and Organisations. Bundesministerium für Umwelt, Naturschutz und Reaktorsicherheit, Berlin, Germany (2010) 3. Milgram, L., Spector, A., Treger, M.: Plan, Do, Check, Act: The Deming or Shewhart Cycle. In: Managing Smart, Gulf Professional Publishing, 25 (1999) 4. Kals, J. Betriebliches Energiemanagement - Eine Einführung. Verlag W. Kohlhammer, Stuttgart (2010) 5. Verein Deutscher Ingenieure (VDI): Energetic characteristics: definitions – terms – methodology. Beuth Verlag GmbH, Düsseldorf (2003) 6. Müller, E., Engelmann, J., Löffler, T., Strauch. J.: Energieeffiziente Fabriken planen und betreiben. Springer-Verlag (2009) 7. Boyd, G.: Development of a Performance-Based Industrial Energy Efficiency Indicator for Automobile Assembly Plants.” Technical Report, Argonne National Laboratory, Decision and Information Sciences Division, Chicago (2005) 8. Boyd, G.: Development of a Performance-based Industrial Energy Efficiency Indicator for Glass Manufacturing Plants. Technical Report, Duke University, Department of Economics, Durham, North Carolina (2009) 9. Boyd, G.: Development of a Performance-based Industrial Energy Efficiency Indicator for Cement Manufacturing Plants. Technical Report, Argonne National Laboratory, Decision and Information Sciences Division, Chicago (2006) 10. Boyd, G., and Zhang, G.: Measuring Improvement in the Energy Performance of the U.S. Cement Industry. Technical Report, Duke University, Department of Economics, Durham, North Carolina (2011) 11. European Energy Efficiency: Analysis of ODYSSEE indicators. Technical Report. Department of Energy & Climate Change, London (2012) 12. Tanaka, K.: Assessing Measures of Energy Efficiency Performance and their Application in Industry. Technical Report, International Energy Agency (IEA), Paris, France (2008) 13. Fünfgeld, C.: Energiekosten im Betrieb. Solar Promotion GmbH-Verlag, Munich (2000)