1Biomechanics Research Unit, University of Limerick, Ireland. 2Health Research Institute, University of Limerick, Ireland. 3Lero, The Irish Software Research ...
DRIVE PERFORMANCE INDICATORS FOR ABLE-BODIED AND DISABLED GOLFERS Ian C Kenny1,2, Mark J Campbell1,3, Sean Surmon4 & Liz Bressan4 1Biomechanics
Research Unit, University of Limerick, Ireland 2Health Research Institute, University of Limerick, Ireland 3Lero, The Irish Software Research Centre, University of Limerick, Ireland 4Centre for Human Performance Sciences, Stellenbosch University, S.A.
INTRODUCTION Golf is a popular leisure and competitive activity for individuals with disabilities (Bragaru et al, 2011) and disability golf is becoming increasingly popular in Ireland, evident by the amount of disability golf societies and unions currently available to golfers with special needs. One of the most attractive aspects of golf is that there is no gender, age or skill limit to participation (McHardy et al, 2006). This is in part due to the 1926 golf handicap system that allows for people of all ages, abilities and skill levels to compete against each other. However, the golf handicap system does not take into consideration either the possible unique challenges of playing golf with any form of disability, or the potential effects of a disability on performance.
RESULTS Table 1. Shot performance means (± s.d.) for drive shots for all golfers Club Head* Velocity (m/s)
Ball Velocity* (m/s)
Carry* (m)
46.9 ± 3.4
67.1 ± 5.3
208.1 ± 30.7
Able-bodied
Disabled
39.3 ± 5.6
55.4 ± 8.6
157.6 ± 44.3
Dispersion σ/ (m) √n
-4.6 ± 22.8 -6.0 ± 17.00
4.4
4.4
- = left of target *significant difference between participant groups (p≤0.001; d=1.33; CI)
Table 2. Launch angles and spin rate means (± s.d.) for drive shots for all golfers Launch Angle* (˚)
Sidespin* (RPM)
Backspin (RPM)
Able-bodied
10.2 ± 3.1
-128.0 ± 500.1
3078.1 ± 944.2
Disabled
11.8 ± 3.7
109.1 ± 433.5
3000.3 ± 908.4
- = left of target *significant difference between participant groups (p≤0.05; d=0.51)
The aim of this study was to examine golf driving performance measures, comparing golfers with various types of physical disabilities to able-bodied golfers.
METHODS With institutional approval, twenty-seven able-bodied participants (handicap category 3, 12.4 ± 7.0) and fifteen disabled participants (handicap category 3, 18.2 ± 9.2) hit ten drives each. Testing took place in a purpose-built indoor golf facility. Driver shots were recorded using a radar ball tracking system (EDH FlightscopeTM X2). Participants with disabilities were recruited through SAGDA, the South African Disabled Golf Association. Physical disabilities included: single leg amputations (four below knee and two above knee), two deaf golfers, one visually impaired golfer, one golfer with post-polio syndrome, three with permanent movement disruptions and two with arthrogryposis. Able-bodied golfers were recruited from local and national teams and clubs, after the participants with disabilities were enlisted to ensure that the able-bodied participants’ golf-handicap corresponded to those of the disabled participants. Inclusion criteria were specified as right- or lefthanded male golfers with a golf-handicap of +3 to 28 who were between 15 and 70 years of age.
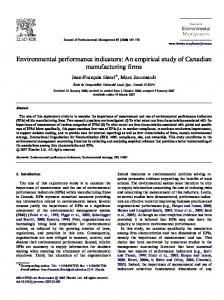
Figure 2. Scatterplots for carry and accuracy (top), and carry - launch angle relationship
DISCUSSION
CONCLUSIONS
Able-bodied golfers presented longer but less accurate drives (208.1 m carry, 22.8 m lateral deviation) than golfers with a disability (157.6 m carry [P < 0.001, d = 1.33, CI = 185.9-194.2], 17.0 m lateral deviation [P < 0.01, d = 0.07, CI = -7.1-3.1]). Shorter drive length indicates that the golfers with a disability might not be able to generate the body angular speeds equivalent to those of able-bodied golfers with the same golf handicap. Consequently golfers with a disability have to possess more accuracy in order to be competitive.
•Lower sidespin and side angle component for disabled golfers demonstrated that their more accurate drive performance was not as a result of shorter drives. •Able-bodied golfers presented longer but less accurate drives. •Golfers with a disability appear to be penalised/ disadvantaged by current golf handicap classification rules.
•A golf handicap calculated based on scores earned on one type of course (e.g. relatively flat course, few bunkers) might not Golfers with a disability hit more shots in accurately reflect potential for a golfer with a regulation (on the fairway) (80.3%) compared disability on a different type of course (e.g. very hilly course). to their able-bodied counterparts (59.9%).
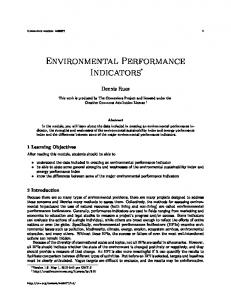
REFERENCES Figure 1. Radar ball tracking sample projection
Bragaru et al, 2011, Sports Medicine, 41, 721-740. McHardy et al, 2006, Sports Medicine, 36, 171-187.
BASES-FEPSAC Conference 2017 – Nottingham, UK // November 2017