schemes by comparing them with k-fold cross validation and hold-out estimation in the setting of large scale classification. 1 Introduction. Model selection is an ...
Efficient Model Selection for Regularized Classification by Exploiting Unlabeled Data Georgios Balikas1 , Ioannis Partalas2 , Eric Gaussier1 , Rohit Babbar3? , and Massih-Reza Amini1 1
3
University of Grenoble, Alpes 2 Viseo R&D Max-Planck Institute for Intelligent Systems
Abstract. Hyper-parameter tuning is a resource-intensive task when optimizing classification models. The commonly used k-fold cross validation can become intractable in large scale settings when a classifier has to learn billions of parameters. At the same time, in real-world, one often encounters multi-class classification scenarios with only a few labeled examples; model selection approaches often offer little improvement in such cases and the default values of learners are used. We propose bounds for classification on accuracy and macro measures (precision, recall, F1) that motivate efficient schemes for model selection and can benefit from the existence of unlabeled data. We demonstrate the advantages of those schemes by comparing them with k-fold cross validation and hold-out estimation in the setting of large scale classification.
1
Introduction
Model selection is an essential step in the pipeline of data analysis tasks. Having decided on the algorithm to be used, one should proceed to parameter selection that is the process of selecting a value for the model’s hyper-parameter(s) expected to obtain the optimal performance on unseen examples. For instance, when using Support Vector Machines (SVM) or Logistic Regression (LR) in a classification task, one has to tune the regularization parameter λ which controls the complexity of the model. The fundamental idea of parameter estimation methods is to validate the model’s performance in fractions of the training data. In several learning scenarios however, except few labeled data, a larger set of unlabeled data may be available (for example in text classification) as the cost of assigning labels is high. This is the case for example of the transductive learning framework [7], where the data to be classified are available beforehand and can be leveraged during the training or inference procedures. The situation we are investigating in this paper is when unlabeled data are available during the step of parameter selection in a classification problem. The challenge is to come up with a method that is able to leverage the information ?
This work was done when the author was at University of Grenoble, Alpes.
in the unlabeled data, instead of ignoring them as traditional model selection strategies such as k-fold cross validation (k-CV) do. To tackle this problem, we incorporate quantification techniques in order to infer the distribution of the examples on unlabeled data, which in turn is used to calculate upper bounds (Section 3) on the performance of a model that motivate an efficient model selection scheme (Section 4). We place ourselves in the supervised learning paradigm where the i.i.d. assumption holds. Note that unlike semi-supervised and transductive learning paradigms that make use of the unlabeled data in the training process to improve the performance, we use the unlabeled data for hyper-parameter selection and, hence, the obtained performance in the test set depends on the amount of the available labeled data. Our method, which is an alternative to k-CV, motivates the selection of the optimal value for the model’s hyper-parameter(s) from a finite set that in turn results in the optimal performance (again from a finite set of possible performances). In this work, we propose a hyper-parameter selection method that (i) benefits from unlabeled data, (ii) performs on par with k-CV but it is k times faster and (iii) has the same complexity as hold-out estimation but performs better due to the use of unlabeled data. We demonstrate the efficiency and the effectiveness of the proposed method in Section 5 where we present multi-class text classification results on several datasets with a large number of classes.
2
Related Work
Several approaches have been proposed for selecting the hyper-parameters of learning algorithms. The goal is always to select the hypothesis that minimizes the generalization error, which is approximated by the estimated error [13]. A popular method to calculate the estimated error is the hold-out procedure that splits the data in a training and a validation set; the estimated error is calculated on the latter. The k-CV technique repeats k times the hold-out procedure: in each round the available training data are partitioned into two complementary subsets, one for training and one for validation. To reduce variability, multiple rounds of crossvalidation are performed using different partitions and the validation results are averaged over the rounds. At the end, an hypothesis is selected e.g. by retraining the classifier on all data using the best values found for the hyper-parameters, or by averaging the hypotheses [5]. A variant of this method is proposed by Blum et al. [6] with a progressive cross-validation procedure that begins by splitting the data in training and test. At each step, it tests an example which in the next round is used for training, resulting in as many hypotheses as the available test examples. To label an example, a hypothesis is randomly selected. This method has the advantage of using more examples for training than the hold-out and was shown to select a better hypothesis. In addition, the study in [12] reviews accuracy estimation and model selection methods based on cross-validation and bootstrap. The former is shown to be better than the latter in different datasets,
especially in terms of accuracy estimation (for which a stratified approach may be preferred). The hold-out estimation and the k-CV when k is small are known to have large variance, a problem that can be partially compensated in k-CV by selecting high values for k (like 5 or 10) [2, 1]. However, k-CV and its variants are computationally expensive and may be intractable in practice if one wants to search for the appropriate values in large-scale scenarios. We propose here a different method that can select an appropriate model on unlabeled datasets. The advantages compared to the above-mentioned methods concern its efficiency and its ability to be applied when few labeled examples are available. It dispenses with the use of validation sets which can be cumbersome to produce in unbalanced or small datasets. It is, however, intended for model selection only, whereas cross-validation and hold-out estimation can be used for performance evaluation as well.
3
Accuracy and Macro-F1 Quantification Bounds
In this section, we propose an upper bound on several performance measures (accuracy and macro-F1) of a given classifier C on a dataset S which doesn’t need to be labeled. We then use this bound, which is based on the class distribution induced by C on S, to perform model selection. We consider mono-label multi-class classification problems, where observations x lie in an input space X ⊆ Rd . Each observation x is associated with a label y ∈ Y, where |Y| > 2. We suppose that examples consist of pairs of (x, y) identically and independently distributed (i.i.d) according to a fixed, but unknown probability distribution D over X × Y (DX will denote the marginal probability for x in X ). In the context of text classification, x(i) ∈ X denotes the vector representation of document i and its label y (i) ∈ Y represents the category associated with x(i) . We further assume to have access to a training set Strain = {(x(i) , y (i) )}N i=1 also generated i.i.d with respect to D. C(S) , the numQuantification. As explained below, our analysis makes use of My ber of documents in the unlabeled set S assigned by classifier C to class y. Many classifiers do not directly assign a category to documents, but rather produce scores (probabilistic or not) for each category, from which a categorization decision can be made. The task of determining the number of instances of each target category in a set S is called quantification and was first proposed by Forman et al. [10, 11]. Contrary to classification that identifies in which target categories an observation belongs, quantification is solely concerned with the estimation of the number of observations belonging to a target category (the positive examples). Note that a good quantifier is not necessarily a good classifier, and vice versa. For example, in a binary problem with 40 observations, a learner that outputs 20 False Positives and 20 False Negatives is a perfect quantifier but a really bad classifier. Given a set of instances in S, quantifiers output, for each target category y of S, a number denoting the prediction of the relative frequency of category y in
S. Quantification methods using general purpose learners are usually split ([8]) in aggregative and non aggregative methods based on whether the quantification step requires the classification of the individual instances as a basic step or not. Quantification has been mainly used to estimate distribution drifts. We make a different use of it here, in the context of model selection, and rely on two popular quantification methods, namely: a) Classify and Count (CC) and b) Probabilistic Classify and Count (PCC) [8]. In CC, given a classifier C trained C(S) on a set Strain , the relative frequency of a class y in a set S, denoted by py , is obtained by counting the instances of S that classifier C assigns the target C(S)
M C(S)
y category y, that is py = |S| , where |S| denotes the size of S. PCC extends CC using the posterior probabilities of an instance belonging to a category, P C(S) 1 leading to py = |S| x∈S p(y|x), where p(y|x) is the posterior probability that an instance x of S belongs to y. We do not consider the adjusted version of those two approaches proposed in [4] because they require the expensive k-fold cross-validation in the training set which is undesirable in large scale settings. Lastly, having a trained classifier, the computational complexity of quantification reduces to the prediction cost of a trained classifier. Quantification-based Bounds. We now present our main result which consists of quantification-based upper bounds on the accuracy (denoted AC(S) ), the macro-precision (denoted M aP C(S) ), the macro-recall (denoted M aRC(S) ) and the macro-F1 (denoted M aF C(S) ) of a classifier C on a dataset S which does not need to be labeled.
Theorem 1. Let S = {(x(j) )}M j=1 be a set generated i.i.d. with respect to DX , py N the true prior probability for category y ∈ Y and Ny , pˆy its empirical estimate obtained on Strain . We consider here a classifier C trained on Strain and we assume that the quantification method used is accurate in the sense that: C(S)
∃�, � � min{py , pˆy , pC(S) }, ∀y ∈ Y : |pC(S) − y y C(S)
Let BA
C(S)
My |≤� |S|
C(S)
, BM aP (�) and BM aR (�) be defined as: X min{ˆ py × |S|, pC(S) × |S|} y y∈Y
C(S)
|S|
, BA
C(S)
1 X min{ˆ py × |S|, py × |S|} + |S|� C(S) , BM aP (�) C(S) |Y| py × |S| + |S|� y∈Y
C(S)
1 X min{ˆ py × |S|, py × |S|} + |S|� C(S) , BM aR (�) C(S) |Y| pˆy × |S| + |S|� y∈Y
Then for any δ ∈]0, 1], with probability at least (1 − δ): s log |Y| + log 1δ C(S) AC(S) ≤ BA + |Y|( + �) 2N
(1)
s
M aP C(S) ≤
s log |Y| + log 1δ log |Y| + log C(S) , M aRC(S) ≤ BM aR (�)+ 2N 2N (2) s C(S) C(S) log |Y| + log 1δ 2BM aP (�)BM aR (�) ≤ C(S) (3) + C(S) 2N B (�) + B (�)
C(S) BM aP (�)+
M aF C(S)
M aP
M aR
Proof. (sketch) We first consider the case where S 6= Strain . Using Hoeffding’s inequality for random variables bounded in the interval [0, 1], we have the standard result that, for any δ ∈]0, 1], with probability at least (1 − δ): s log |Y| + log 1δ ∀y ∈ Y, py ≤ pˆy + 2N The log |Y| factor is a result of the fact that the bound should hold simultaneously for all categories. This implies, using the quantification assumption, that, for any δ ∈]0, 1], with probability at least (1 − δ), ∀y ∈ Y: | min{py × |S|, MyC(S) } − min{ˆ py × |S|, pC(S) × |S|}| y s log |Y| + log 1δ + �) < |S|( 2N
(4)
C(S)
} corresponds to an upper bound on the number of documin{py × |S|, My ments of S correctly classified by C in class y. Hence, the accuracy of C on S is upper bounded by: X min{py × |S|, MyC(S) } y∈Y
|S| which leads, using Inequality 4, to Inequality 1. The other bounds can be derived in the same way. � The above theorem is inspired by a previous result we have developed in the context of multi-class classification [3]. We have generalized and extended it here through the consideration of macro measures and quantification. Even though this extension renders the developments more complex, it is crucial for model selection using unlabeled datasets. When the Classify and Count (CC) quantification method is used, then, by C(S)
definition, py
=
MyC(S) |S| ,
and � can be set to 0. This leads to stricter bounds C(S)
for all the measures. Furthermore, the condition � � min{py , pˆy , py } in the quantification assumption implies that the term |S|� is negligible compared to C(S) C(S) C(S) C(S) |S| × pˆy or |S| × py , so that BM aP (�) and BM aR (�) are close to BM aP (0) and C(S) BM aR (0). Lastly, it can be noted that the quality of the bound is better for the macro measures than for the accuracy as the multiplying |Y| factor is dropped.
1 δ
Theorem 1 states that the accuracy, macro-precision, macro-recall and macroF1 of a classifier can be upper-bounded by quantities that are related to the behavior of the classifier on an unlabeled dataset, and that the quality of the bound depends on the number of classes, the size of the training set, the quality of the quantification method and the precision desired. These bounds represent necessary conditions for a classifier C to have high accuracy/macro-F14 . They can nevertheless be exploited, within a given family of classifiers obtained through e.g. different regularization parameters, to select good classifiers. Model Selection Using Quantification Bounds. We consider here a standard regularization setting in which one aims at minimizing a combination of the empirical error and the model complexity using the following template of the objective function: w ˆ = arg min Remp (w) + λReg(w) where Reg(w) is the regularization term to avoid overfitting and Remp (.) represents the empirical error. The parameter λ controls the trade-off between the empirical error and the regularization term. As mentioned before, λ is typically estimated through holdout estimation or k-fold cross-validation. We propose here to estimate it on the basis of the upper bounds presented in Theorem 1, as described in Algorithm 1. As one can note, for each value of λ, a classifier is trained and quantified on the unlabeled set S. If the quantification assumption of Theorem 1 is not valid, then one falls back on the Classification and Count method for quantification. The bounds, as computed by Inequalities 1 and 3 are used to select the ”best” classifier. Tuning the hyper-parameter is, therefore, reduced to the problem of finding a classifier which yields the highest value of the bounds on a given set. In contrast with other selection methods, the set used to select the classifier can be an unlabeled set from the same distribution (unlabeled data is usually readily available, contrary to labeled data) or the test set in a transductive-like scenario. In terms of complexity, the quantification cost is reduced to the prediction for the already trained classifier, which is linear in the cardinality of the set S on which quantification is performed. The computational cost for Algorithm 1 is thus the same as 1-fold cross-validation. Additionally, as only one hypothesis is generated for each parameter value by training to the whole set of labeled data one has just to select the hypothesis with the highest bound without the need of retraining the model in contrast to hold-out or k-fold cross-validation. More precisely, the complexity of our approach for m values of λ is O([Tr(N) + Pr(M)]×m), which is k times lower than the complexity of k-CV with re-training the learner for the selected λ value, given by 1 O([Tr(( k−1 k )×N)+Pr( k ×N)]×k×m+T(N)), where Tr(N), Pr(N) are the training and predicting costs for N examples. 4
They do not provide a sufficient condition since it is possible, in an adversarial setup, to achieve an upper bound of 1 on the accuracy by simply assigning instances to categories in the same proportion as in the training set.
Algorithm 1 Model selection using the proposed bounds (j) M Require: Training data Strain = {(x(i) , y (i) )}N )}j=1 and i=1 , unlabeled data S = {(x learning algorithm (SVM, Logistic Regression, ...) 1: for each value of λ (typically λ ∈ {10−4 , 10−3 , . . . , 102 , 103 } do) 2: Train a classifier Cλ using Strain 3: Perform quantification of Cλ on S using method Mq (typically CC or PCC) 4: If Mq = CC, set � = 0
5: 6: 7:
If Mq 6= CC, set � = maxy∈Y min{ˆ py , pC(S) } − |pC(S) − y y If � < 0, go back to step 4 with Mq = CC Compute the accuracy bound using Inequality 1
8:
Compute the macro-F1 bound (
C (S)
C(S)
My |S|
|
C (S)
2BMλaP (�)BMλaR (�) ) C (S) C (S) BMλaP (�)+BMλaR (�)
using Inequality 3
9: end for 10: Select Cλ with the highest accuracy/macro-F1 bound
4
Experimental Framework
To empirically evaluate the model selection method presented above we use the publicly available datasets of the LSHTC 2011 (Large Scale Hierarchical Text Classification) challenge [14]. Specifically, we make use of the Dmoz and Wikipedia datasets containing 27,875 and 36,504 categories respectively. The datasets are provided in a pre-processed format using stop-word removal and stemming while we transformed the term-frequency vectors to the tf*idf representation. For each of the datasets we randomly draw several datasets with increasing number of classes. Table 1 presents the important statistics of the different datasets. As one can note, the number of categories in our datasets ranges from 250 to 2, 500, and the number of features from 26, 000 to 212, 000. An interesting property of the instances of those datasets is the fit to the power law distribution. As a result, there are several under-represented classes having a few labelled examples. Thus, model selection approaches using only a fraction of the labeled instances, such as hold out, may lead to sub-optimal decisions. The classification problems defined from our datasets are multi-class, and we adopt a standard one-vs-rest approach to address them (the large datasets considered prevents one from using more complex multi-class approaches). The Dmoz dataset is single-labeled, i.e. each training/test instance is associated to a single target category. On the other hand, the Wikipedia dataset is multilabeled with the average labels per instance in the training set being 1.85. We transformed the multi-label problem to single label, both in the training and the test phase, by replicating the multi-labeled instances according to the number of their labels. In order to empirically measure the effectiveness of model selection, we compare the following three methods: (i) k -CV, using k = 5 folds, (ii) hold-out estimation with a split of 70% and 30% for the training and the validation sets, and (iii) our method using as quantification set i) an unlabeled set denoted
“quantification set” in Table 1, and ii) the test set which may be available during training in a transductive alike scenario. The corresponding methods are called BoundUN and BoundTest respectively.
Dataset #Training inst. #Quantification inst. #Test inst. #Features # Parameters dmoz250 dmoz500 dmoz1000 dmoz1500 dmoz2500 wiki250 wiki500 wiki1000 wiki1500 wiki2500
1,542 2,137 6,806 9,039 12,832 1,917 4,912 7,887 12,156 22,642
2,401 3,042 10,785 14,002 19,188 3,095 8,190 12,790 19,776 37,398
1,023 1,356 4,510 5,958 8,342 1,003 2,391 4,067 6,160 11,171
55,610 77,274 138,879 170,828 212,073 26,699 46,556 60,788 79,973 109,694
13,902,500 38,637,000 138,879,000 256,242,000 530,182,500 6,674,750 23,278,000 60,788,000 110,959,500 274,235,000
Table 1: The properties of the datasets we used. The dataset name denotes the collection we sampled it from; its subscript denotes the number of categories.
Evaluation of the quantification methods. We first discuss the performance of the quantification methods presented above (CC and PCC), prior to comparing the results obtained by the different model selection methods (k-fold cross-validation, hold-out estimation, BoundUN and BoundTest ). Recall that TheC(S) − orem 1 is based on the assumption that the quantity Max� = maxy∈Y |py MyC(S) |S| |
is small. As mentioned above, this quantity is null for the quantification method CC, which thus agrees with our theoretical developments. The other quantification method considered, PCC, is based on the probabilities that an instance belongs to a class. When using LR, those probabilities are directly produced by the model. For SVMs, however, one needs to transform the confidence scores into probabilities, which can be done in several ways, as using a logistic function, a multivariate logistic regression function or neural networks based on logistic activation functions and without hidden layers (the latter two settings can be seen as generalizations of Platt’s scaling for the multi-class problem). We obtained the best results with a simple logistic function defined as 1+e1−σt , varying σ from 1 to 10. Table 2 displays the values of Max� obtained for PCC for each of the dataset and for each classifier (the default hyper-parameter values of the classifiers are used), using the value of σ leading to the lowest value of Max� . As one can note, although the values obtained are small in most cases (except for Dmoz1000 and Dmoz1500 ), there are not negligible compared to the class prior probabilities, which are in the range of 1 divided by the number of classes. Thus, the quantification method PCC does not fully agree with our theoretical development. It turns out that it also performs worse than CC in practice. We thus rely on this latter method for the rest of our experiments.
dmz250 dmz500 dmz1000 dmz1500 dmz2500 wiki250 wiki500 wiki1000 wiki1500 wiki2500 SVM 0.0728 0.0967 LR 0.0942 0.0674
0.1067 0.0889
0.1125 0.1111
0.0345 0.0287 0.0754 0.0310 0.0425 0.0365 0.0530 0.0219 0.0517 0.0481 0.0310 0.0294
Table 2: Evaluation of the assumption of Theorem 1 concerning the quantification step. For each dataset, we present Max� for the PCC quantification method.
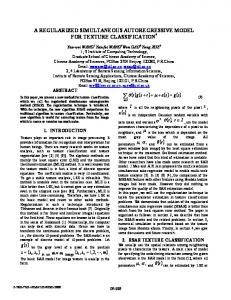
Model Selection Evaluation. We evaluate model selection methods for two families of classifiers: (i) SVMs, and (ii) LR which are among the best performing models in text classification. We explore for both classifiers the value for the regularization parameter λ ∈ {10−3 , 10−2 , . . . , 104 }. We used the implementations in Python’s scikit-learn [15] that are wrappers of the LibLinear package [9]. We report the scores obtained in Accuracy and Macro-F (MaF) measure when a classifier is applied on the test set. In particular, for each dataset of Table 1 the model selection methods are used only for selecting the regularization parameter λ when optimizing for the repsective measure. After the selection of λ, the classifier is retrained on the entire training set, and we report its performance in the test set. This last step of retraining is not required for our method since the classifier is trained in the overall labeled set from the beginning. Also, as hold-out estimation may be sensitive to the initial split, we perform 10 different random splits training/validation and report the mean and the standard deviation of the scores obtained for both evaluation measures. Figure 1 illustrates the model selection decisions for the different methods using an SVM on the Wikipedia dataset with 1, 500 classes for the MaF measure. The curve MaF corresponds to the actual MaF on the test set. Although each parameter estimation method selects the value for λ that seems to maximize the performance, the goal in this example, ultimately, is to select the value that maximizes the performance of MaF. For instance, hold-out, by selecting
0.8 0.7
Accuracy
0.6 0.5 0.4 0.3 0.2 5-CV H out
0.1 0.0 10−4
10−3
10−2
10−1
1
MaF CC 10
PCC
102
103
λ values
Fig. 1: Model selection process for SVM on the wiki1500 for MaF. The squares denote the best performance for each method.
λ = 10−1 , fails to select the optimal λ value, while all other the methods succeed. Here, the 5-CV approach requires 1310 sec., whereas the bound approach only requires 302 sec. (the computations are performed on a standard desktop machine, using parallelized implementations on 4-cores). The bound approach is thus 4.33 times faster, a result consistent over all experiments and in agreement with the complexity of each approach (Section 3). Lastly, we notice that the curve for BoundUN with the quantification method CC follows the MaF curve more strictly than the curve with the quantification method PCC. Table 3 presents the evaluation of the three model selection methods using as classifiers SVM and LR respectively. As one can note, the performance of the method proposed here is equivalent to the one of cross-validation, for all datasets, and for both classifiers and performance measures (accuracy and MaF). The performance of SVM is furthermore higher than the one of LR on all datasets, and for both evaluation measures, the difference being more important for the MaF. The performance of cross-validation however comes with the cost of extra processing time, as our method achieves a k speed-up compared to cross-validation. If both methods can easily be parallelized (at least on the basis of the number of values of the hyper-parameter to be tested), k-fold cross validation requires k times more computing resources than our method. Unlike cross-validation, hold-out estimation fails to provide a good model in many instances. This is particularly true for SVMs and the MaF measure, for which the model provided by hold-out estimation lies way behind the ones provided by BoundUN and BoundTest on several collections as Dmoz1500 and Dmoz2500 . The difference is less important for LR, but the final results in that case are not as good as in the SVM case.
5
Conclusions
We have presented in this work a new method for model selection that is able to exploit unlabeled data (this is in contrast with current model selection methods). To do so, we have introduced quantification-based bounds for accuracy and macro performance measures. We have then shown how to apply this bound in practice, in the case where unlabeled data is available in conjunction with labeled data, and in a transductive-like setting where the instances to be classified are known in advance. The experimental results, obtained on 10 datasets with different number of classes ranging from 250 to 2,500, show that the method proposed here is equivalent, in terms of the quality of the model selected, to k-fold cross-validation, while being k times faster. It furthermore consistently outperforms hold-out estimation for SVM classification, for both accuracy and macro-F1, the difference being more important for macro-F1. Furthermore, and contrary to hold-out estimation, our method needs neither a validation/train splitting procedure nor a retraining procedure. In our future work we plan to investigate the application of a generalized versino of the proposed model selection approach in cases where more than one hyper-parameters have to be tuned. In this framework, we also plan to
Hold-out
Dataset
Acc
MaF
Acc
MaF
SVM
BoundTest
wiki250 wiki500 wiki1000 wiki1500 wiki2500 dmoz250 dmoz500 dmoz1000 dmoz1500 dmoz2500
.7747 .7445 .7000 .6360 .5808 .8260 .7227 .7302 .7132 .6352
.5889 .5257 .4737 .4278 .3763 .6242 .5584 .4883 .4715 .4301
.7747 .7449 .6993 .6354 .5811 .8270 .7227 .7302 .7132 .6350
.5927 .5254 .4732 .4283 .3762 .6243 .5584 .4892 .4715 .4306
.7663 .7440 .6996 .6343 .5822 .8260 .7221 .7301 .6958 .6350
Logistic Regression
BoundUn
Acc
wiki250 wiki500 wiki1000 wiki1500 wiki2500 dmoz250 dmoz500 dmoz1000 dmoz1500 dmoz2500
.7527 .7302 .6836 .6166 .5802 .7742 .6608 .6845 .6678 .5959
.5423 .4709 .4354 .3801 .3506 .4724 .4513 .3681 .3616 .3351
.7527 .7302 .6836 .6166 .5802 .7742 .6608 .6845 .6678 .5959
.5423 .4709 .4354 .3801 .3506 .4724 .4513 .3681 .3616 .3351
.7464 (±.0078) .7266 (±.0056) .6836 (±.0000) .6166 (±.0000) .5802 (±.0000) .7718 (±.0047) .6586 (±.0064) .6845 (±.0000) .6678 (±.0000) .5959 (±.0000)
(±.0158) (±.0006) (±.0009) (±.0049) (±.0023) (±.0000) (±.0005) (±.0001) (±.0457) (±.0001)
5-CV MaF
Acc
MaF
(±.0183) (±.0031) (±.0274) (±.0126) (±.0004) (±.0000) (±.0022) (±.0155) (±.0998) (±.0686)
.7747 .7445 .7000 .6360 .5832 .8260 .7220 .7299 .7132 .6352
.5927 .5254 .4737 .4278 .3763 .6242 .5562 .4883 .4715 .4301
.5335 (±.0134) .4633 (±.0116) .4354(±.0000) .3801 (±.0000) .3506 (±.0000) .4692 (±.0096) .4488 (±.0076) .3681 (±.0000) .3616 (±.0000) .3351(±.0000)
.7527 .7302 .6836 .6166 .5802 .7742 .6608 .6845 .6678 .5959
.5423 .4709 .4354 .3801 .3506 .4724 .4513 .3681 .3616 .3351
.5746 .5228 .4584 .4230 .3759 .6242 .5558 .4835 .4065 .3949
Table 3: The performance of the model selection methods for SVM and Logistic Regression on the test set. For held out, we report the mean and in parenthesis the standard deviation of 10 rounds of the method.
research the extension of the theoretical and experimental findings to multilabel classification problems i.e., multi-class classfication problems where each instance can be given more than one categories at once.
Acknowledgements This work is partially supported by the CIFRE N 28/2015 and by the LabEx PERSYVAL Lab ANR-11-LABX-0025.
References 1. Arlot, S., Lerasle, M.: Why V=5 is enough in V-fold cross-validation. ArXiv eprints (2012) 2. Arlot, S., Celisse, A.: A survey of cross-validation procedures for model selection. Statistics Surveys 4, 40–79 (2010) 3. Babbar, R., Partalas, I., Gaussier, E., Amini, M.r.: Re-ranking approach to classification in large-scale power-law distributed category systems. In: Proceedings
4.
5. 6.
7. 8.
9. 10. 11. 12.
13. 14.
15.
of the 37th International ACM SIGIR Conference on Research & Development in Information Retrieval. SIGIR ’14 (2014) Bella, A., Ferri, C., Hern´ andez-Orallo, J., Ram´ırez-Quintana, M.J.: Quantification via probability estimators. In: Data Mining (ICDM), 2010 IEEE 10th International Conference on. pp. 737–742. IEEE (2010) Bengio, Y., Grandvalet, Y.: No unbiased estimator of the variance of k-fold crossvalidation. Journal of Machine Learning Research 5, 1089–1105 (2004) Blum, A., Kalai, A., Langford, J.: Beating the hold-out: Bounds for k-fold and progressive cross-validation. In: Proceedings of the Twelfth Annual Conference on Computational Learning Theory. pp. 203–208 (1999) Chapelle, O., Sch¨ olkopf, B., Zien, A. (eds.): Semi-Supervised Learning. MIT Press, Cambridge, MA (2006), http://www.kyb.tuebingen.mpg.de/ssl-book Esuli, A., Sebastiani, F.: Optimizing text quantifiers for multivariate loss functions. Tech. rep., Technical Report 2013-TR-005, Istituto di Scienza e Tecnologie dellInformazione, Consiglio Nazionale delle Ricerche, Pisa, IT (2013) Fan, R.E., Chang, K.W., Hsieh, C.J., Wang, X.R., Lin, C.J.: LIBLINEAR: A library for large linear classification. Journal of Machine Learning Research 9 (2008) Forman, G.: Counting positives accurately despite inaccurate classification. In: Machine Learning: ECML 2005, pp. 564–575. Springer (2005) Forman, G.: Quantifying counts and costs via classification. Data Mining and Knowledge Discovery 17(2), 164–206 (2008) Kohavi, R.: A study of cross-validation and bootstrap for accuracy estimation and model selection. In: Proceedings of the 14th International Joint Conference on Artificial Intelligence. IJCAI’95 (1995) Mohri, M., Rostamizadeh, A., Talwalkar, A.: Foundations of Machine Learning. The MIT Press (2012) Partalas, I., Kosmopoulos, A., Baskiotis, N., Artieres, T., Paliouras, G., Gaussier, E., Androutsopoulos, I., Amini, M.R., Galinari, P.: Lshtc: A benchmark for largescale text classification. CoRR abs/1503.08581 (march 2015) Pedregosa, F., Varoquaux, G., Gramfort, A., Michel, V., Thirion, B., Grisel, O., Blondel, M., Prettenhofer, P., Weiss, R., Dubourg, V., Vanderplas, J., Passos, A., Cournapeau, D., Brucher, M., Perrot, M., Duchesnay, E.: Scikit-learn: Machine learning in Python. Journal of Machine Learning Research 12, 2825–2830 (2011)