Efficient prototype selection supported by subspace partitions Dr. Joel Luís Carbonera
IBM research - Rio de Janeiro – Brazil
[email protected]
Dr. Mara Abel
UFRGS - Porto Alegre – Brazil
[email protected]
Introduction
Prototype selection - Overview Classification based on machine learning – traditional pipeline Training dataset (labeled instances)
Learning
Classifier
Classification
Classified instances
Unlabeled instances
© 2017 International Business Machines Corporation
3
Prototype selection - Overview Classification based on machine learning – pipeline including prototype selection Training dataset (labeled instances)
Learning
Prototype selection
Selected prototypes
•
Classifier
Classification
Classified instances
Unlabeled instances
Prototype selection:
– Selection of a smaller set of prototypes from the total available data, which is able to support a machine learning application, keeping a similar performance. – Prototypes can be synthetic instances.
•
Trade-off:
– Reduction rate X Classification quality.
© 2017 International Business Machines Corporation
4
Available approaches • Preserving the boundaries between different classes in the dataset. – Border instances provide relevant information for distinguishing different classes. Original dataset
Selected dataset
Prototype selection
© 2017 International Business Machines Corporation
5
Drawbacks of preserving the boundaries • Identification of boundaries involves a quadratic time complexity: – It is necessary to compare each pair of instances in the dataset. – Complexity can be too high for dealing with large datasets.
© 2017 International Business Machines Corporation
6
PSSP algorithm 7
Main assuptions • Assumptions: – We can extract a synthetic prototype from a given set of instances that are similar to each other. – The resulting prototype is able to abstract the information represented by the original set of instances. Instances of the original dataset Prototype
© 2017 International Business Machines Corporation
8
General strategy • P←∅ • For each label L in the dataset: – S ← find the set of sets of objects with label L that are more similar to each other. – For each set 𝒔𝒊 ∈ S: • 𝒑𝒓𝒐𝒕𝒊 ← extract the prototype that abstracts the instances in 𝒔𝒊 . • Include 𝒑𝒓𝒐𝒕= in P
• Return P © 2017 International Business Machines Corporation
9
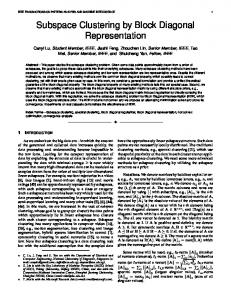
Subspace partition • Considering:
– A subspace SS of the whole dataset (where SS ⊆ D), selected by arbitrary criteria. – A dimension 𝒅𝒊 ∈ SS can be splitted into a set of intervals.
• A subspace partition is a set of intervals, one for each dimension 𝒅𝒊 ∈ SS, defining a specific multidimensional region of the subspace.
Representation of a dataset with 28 data objects in a 2D space, with 5 subspace partitions. © 2017 International Business Machines Corporation
10
PSSP algorithm
© 2017 International Business Machines Corporation
11
PSSP algorithm •
•
•
© 2017 International Business Machines Corporation
Defines a set of homogeneous SP that are enough for producing the desirable number of prototypes Finds the objects contained in each partition, using spatial hashing.
Extracts the centroid of the set of instances.
12
Complexity of PSSP • Each step of the algorithm has, at most, a time complexity that is linear on the number of instances. – The time complexity of PSSP is linear on the number of instances.
© 2017 International Business Machines Corporation
13
Experiments 14
Experimental Settings • Algorithms: DROP3, ENN, ICF, LSBo, LSSm, LDIS • 11 well-known datasets (with numerical dimensions):
© 2017 International Business Machines Corporation
15
Experimental Settings • Evaluation measures: – 𝒂𝒄𝒄𝒖𝒓𝒂𝒄𝒚
𝑺𝒖𝒄𝒆𝒔𝒔(𝑻𝒆𝒔𝒕) = |𝑻𝒆𝒔𝒕|
– 𝒓𝒆𝒅𝒖𝒄𝒕𝒊𝒐𝒏 =
𝑻 K|𝑺| |𝑻|
• Where:
– 𝑻𝒆𝒔𝒕 is the set of instances that are tested in a classification task and |𝑻𝒆𝒔𝒕| is the cardinality of this set. – 𝑺𝒖𝒄𝒆𝒔𝒔(𝑻𝒆𝒔𝒕) is the number of instances in Test correctly classified in the classification task. – 𝑻 is the cardinality of the set of instances of the whole training dataset and 𝑺 is the cardinality of the set of instances selected by a given instance selection algorithm.
© 2017 International Business Machines Corporation
16
Experimental Settings K=3 for DROP3, ENN and LDIS. D = 1 and p = 0.1, for PSSP. Euclidean distance. The classification accuracy was evaluated using the KNN algorithm, adopting k=3. • The 2 measures were evaluated in an 10-fold crossvalidation process. • • • •
© 2017 International Business Machines Corporation
17
Average accuracy
© 2017 International Business Machines Corporation
18
Average reduction
© 2017 International Business Machines Corporation
19
Computational efficiency • Synthetic dataset: – 20k 2D random points, – uniformly distributed in a squared area, – with 4 different classes (one class in each quadrant of the squared area), where each class has 5k points.
• Measure: – The time (milliseconds) taken by each algorithm for performing the prototype selection task in the synthetic dataset. © 2017 International Business Machines Corporation
20
Computational efficiency
© 2017 International Business Machines Corporation
21
Conclusion 22
Conclusion • PSSP allows the user to chose the size of the resulting reduced dataset.
– This is not a typical feature in prototype selection algorithms.
• PSSP has a time complexity that is linear on the number of objects. • The experiments show that PSSP has: – The best reduction rates. – A reasonable balance between accuracy and reduction. – The lowest running time.
• PSSP can be applied only to numerical datasets. • PSSP a promising algorithm for dealing with big volumes of data, in scenarios that the running time is critical. © 2017 International Business Machines Corporation
23
Future works • Investigate other ways of applying the notion of subspace partition for prototype selection.
© 2017 International Business Machines Corporation
24
Thank you! 25
Appendix 26
Other algorithms 27
partitioning • •
K is the maximum number of prototypes. We consider an equal number of intervals for every dimension.
𝑖𝑛𝑡𝑒𝑟𝑣𝑎𝑙𝑠 |gg| ≤ 𝑘
© 2017 International Business Machines Corporation
28
extractsPrototype
© 2017 International Business Machines Corporation
29
Effects of the parameters D and p 30
Effects of the parameters D and p •
We evaluated the effects of the parameters D and p in the performance of PSSP. – D defines the number of dimensions of the subspace. – p defines the number of prototypes (as a percentage of the total number of objects).
•
Datasets:
– The 20 datasets considered in the first experiment.
•
Evaluated measures: – Accuracy – Reduction – Effectiveness
•
Values of D:
– 1, 2, 3 and 4.
•
Values of p:
– 0.1, 0.2 and 0.3
© 2017 International Business Machines Corporation
31
Average accuracy
© 2017 International Business Machines Corporation
32
Average reduction
© 2017 International Business Machines Corporation
33
10-fold cross-validation process 34
10-fold cross-validation process Repeated 10 times, with each subsample used once as Test 7
Reduction Calculating Initial dataset
3 Partitioning
Initial training set
Selecting Appllying IS algorithm
1
5
Calculating
Reduced training set
4
IS algorithm
2
Calculating
Appllying KNN algorithm KNN algorithm
Average Reduction
Average Effectiveness
9
6 Accuracy
8 Calculating
Average Accuracy
Selecting 10 equal sized subsamples
Test
© 2017 International Business Machines Corporation
35