13 Mar 2014 - arXiv:1403.3438v1 [stat.ML] 13 Mar 2014. NEIGHBORHOOD SELECTION FOR THRESHOLDING-BASED SUBSPACE. CLUSTERING.
NEIGHBORHOOD SELECTION FOR THRESHOLDING-BASED SUBSPACE CLUSTERING Reinhard Heckel, Eirikur Agustsson, and Helmut B¨olcskei Dept. IT & EE, ETH Zurich, Switzerland
arXiv:1403.3438v1 [stat.ML] 13 Mar 2014
ABSTRACT Subspace clustering refers to the problem of clustering high-dimensional data points into a union of lowdimensional linear subspaces, where the number of subspaces, their dimensions and orientations are all unknown. In this paper, we propose a variation of the recently introduced thresholding-based subspace clustering (TSC) algorithm, which applies spectral clustering to an adjacency matrix constructed from the nearest neighbors of each data point with respect to the spherical distance measure. The new element resides in an individual and data-driven choice of the number of nearest neighbors. Previous performance results for TSC, as well as for other subspace clustering algorithms based on spectral clustering, come in terms of an intermediate performance measure, which does not address the clustering error directly. Our main analytical contribution is a performance analysis of the modified TSC algorithm (as well as the original TSC algorithm) in terms of the clustering error directly. 1. INTRODUCTION Suppose we are given a set of N data points in Rm , denoted by X , and assume that X = X1 ∪ ... ∪ XL where (ℓ) the points in Xℓ , ℓ ∈ {1, ..., L}, satisfy xj ∈ Sℓ with Sℓ m a dℓ -dimensional subspace of R . The association of the points in X with the Xℓ , the number of subspaces L, their dimensions dℓ , and their orientations are all unknown. We want to find the partitioning of the points in X into the sets X1 , ..., XL . Once this partitioning has been identified, it is straightforward to extract the subspaces Sℓ through principal component analysis (PCA). This problem is known as subspace clustering and has applications in, e.g., unsupervised learning, image processing, disease detection, and computer vision [2]. Numerous approaches to subspace clustering are available in the literature, see [2] for an excellent overview. Several recently proposed subspace clustering algorithms such as sparse subspace clustering (SSC) [3, 4], low-rank Part of the results in this paper were submitted to the Annals of Statistics [1].
representation (LRR) [5], SSC-orthogonal matching pursuit (OMP) [6], and thresholding-based subspace clustering (TSC) [1] are based on the principle of applying spectral clustering [7] to a similarity matrix A ∈ RN ×N constructed from the data points in X . Specifically, in SSC A is obtained by finding a sparse representation of each data point in terms of the other data points via ℓ1 -minimization (or via LASSO [8]), SSC-OMP replaces the ℓ1 -step in SSC by OMP, LRR computes A through a low-rank representation of the data points obtained by nuclear norm minimization, and TSC constructs A from the nearest neighbors of each data point through thresholding of the correlations between data points. A common feature of SSC, SSC-OMP, and TSC is that A is constructed by sparsely representing each data point in terms of all the other data points. The sparsity level of the corresponding representation is controlled by a stopping criterion for SSC-OMP, by the number of nearest neighbors for TSC, and by the LASSO regularization parameter λ for the robust version of SSC [8]. A procedure for selecting λ for each data point individually and in a data-driven fashion is described in [8]. Contributions: We consider a variation of TSC—referred to as “modified TSC” henceforth—which selects the number of nearest neighbors of each data point individually and in a data-driven fashion. For a semi-random data model with deterministic subspaces and the data points within the subspaces chosen randomly, we provide performance guarantees in terms of the clustering error, defined as the fraction of misclassified points. Specifically, we build on the fact that the clustering error is zero if the connected components1 in the graph G with adjacency matrix A correspond to the Xℓ . The performance results in [9, 8, 5, 6, 10] are all based on an intermediate, albeit sensible, performance measure guaranteeing that the nodes in G corresponding to Xℓ are connected to other points 1 We say that a subgraph H of a graph G is connected if any two nodes in H can be joined by a path such that all intermediate nodes also lie in H. The subgraph H is called a connected component if H is connected and if there are no connections between nodes in H and nodes outside of H [7].
in Xℓ only, for each ℓ. This is, however, not sufficient to conclude that the connected components in the graph G correspond to the Xℓ . The key to deriving conditions for TSC to yield zero clustering error is to recognize that G is a random nearest neighbor graph and to analyze its connectivity properties. Notation: We use lowercase boldface letters to denote (column) vectors and uppercase boldface letters to designate matrices. For the vector x, xq stands for its qth entry. For the matrix A, Aij is the entry in its ith row and jth column, A† its pseudo-inverse, kAk2→2 := maxkvk2 =1 kAvk2 its spectral norm, and kAkF := qP 2 i,j |Aij | its Frobenius norm. log(·) stands for the
natural logarithm, arccos(·) for the inverse function of cos(·), and x ∧ y is the minimum of x and y. The set {1, ..., N } is denoted by [N ] and the cardinality of the set T is |T |. We write N (µ, Σ) for a Gaussian random vector with mean µ and covariance matrix Σ. The unit sphere in Rm is Sm−1 := {x ∈ Rm : kxk2 = 1}. 2. THE MODIFIED TSC ALGORITHM We next present a variation of the TSC algorithm introduced in [10, 1]. The new element here is a data-driven choice of the number of nearest neighbors for each data point individually. For Step 1 below to make sense, we assume that the data points in X are normalized. This assumption is not restrictive as the data points can be normalized prior to clustering. Modified TSC algorithm. Given a set of N data points X and a threshold parameter τ (the choice of τ is discussed below), perform the following steps: Step 1: For every xj ∈ X , sort |hxj , xi i| , i ∈ [N ], in descending order, and let Tj (q) ⊆ [N ]\j be the index set corresponding to the q largest values of |hxj , xi i|. Next, determine qj as the smallest value of q such that
† (1)
(I − XTj (q) XTj (q) )xj ≤ τ 2
where XTj (q) is the matrix with columns xi , i ∈ Tj (q). Step 2: For each j ∈ [N ], set the entries of zj ∈ RN indexed by Tj (qj ) to the absolute values of X†Tj (qj ) xj and set all other entries to zero. Construct the adjacency matrix A according to A = Z + ZT , where Z = [z1 , ..., zN ]. Step 3: Estimate the number of subspaces as the numˆ of the normalized Laplacian of ber of zero eigenvalues, L, the graph with adjacency matrix A. Step 4: Apply normalized spectral clustering [7] to ˆ (A, L). Since arccos(z) is decreasing in z for z ∈ [0, 1], Tj (q) is the set of q nearest neighbors of xj with respect to the
pseudo-distance metric2 arccos(|hxj , xi i|). The hope is that Tj (qj ), corresponding to xj ∈ Xℓ , contains points in Xℓ only. In addition, we want the points corresponding to Xℓ , for every ℓ, to form a connected component in the graph G with adjacency matrix A. If this is, indeed, the case, then by virtue of the number of zero eigenvalues of the Laplacian of G being equal to the number of connected components in G [7], Step 3 delivers the correct estimate ˆ = L for the number of subspaces. The spectral clusterL ing Step 4 will then identify the individual connected components of G and thus yield correct segmentation of the data [7, Prop. 4; Sec. 7]. When the points corresponding to the Xℓ do not form connected components in G but the Aij for pairs xi , xj belonging to different Xℓ are “small enough”, a robust estimator for L is the eigengap heuristic [7]. With this modification, TSC may still cluster the data correctly, even when points corresponding to, say, Xℓ , are connected to points in the set X \Xℓ . The idea underlying Step 1 in the modified TSC algorithm is to estimate qj as the number of points necessary to represent xj ∈ Xℓ as a linear combination of its nearest neighbors; the left-hand side of (1) is the corresponding ℓ2 -approximation error. The estimate for qj will be on the order of dℓ , the dimension of Sℓ , the subspace xj lies in. To see this, assume that the data points in Xℓ are distributed uniformly at random on the set {x ∈ Sℓ : kxk2 = 1}. If the points corresponding to Tj (dℓ ) are all in Xℓ , then those points suffice (with probability one) to represent xj with zero error. Moreover, with probability one, every strict subset of these points will fail to represent xj with zero error. Thus, the estimate qj obtained for τ = 0 in Step 1 is equal to dℓ , with probability one. Throughout this paper, we set τ = 0 in (1); in the noisy case, not considered here, a sensible choice is to take τ proportional to the noise variance. 3. ANALYTICAL PERFORMANCE RESULTS We take the subspaces Sℓ to be deterministic and choose the points within the Sℓ randomly. To this end, we rep(ℓ) (ℓ) resent the points in Sℓ by xj = U(ℓ) aj where U(ℓ) ∈ m×dℓ R is an orthonormal basis for the dℓ -dimensional (ℓ) subspace Sℓ and the aj ∈ Rdℓ are i.i.d. uniformly distributed on Sdℓ −1 . Since each U(ℓ) is orthonormal, the (ℓ) (ℓ) data points xj = U(ℓ) aj are uniformly distributed on the set {x ∈ Sℓ : kxk2 = 1}. Our performance guarantees are expressed in terms of the affinity between subspaces, defined as
1
(k) T (ℓ) aff(Sk , Sℓ ) := √ U . (2)
U F dk ∧ dℓ
2 s ˜(xi , xj ) = arccos(|hxj , xi i|) is not a distance metric since s˜(x, −x) = 0, but −x 6= x for x 6= 0. It satisfies, however, the defining properties of a pseudo-distance metric [11].
Note that the affinity notion [9, Definition 2.6] and [8, Definition 1.2], relevant to the analysis of SSC, is equivalent to (2). The affinity between subspaces can be expressed in terms of the principal angles between Sk and Sℓ according to p cos2 (θ1 ) + ... + cos2 (θdk ∧dℓ ) √ (3) aff(Sk , Sℓ ) = dk ∧ dℓ where θ1 , ..., θdk ∧dℓ with 0 ≤ θ1 ≤ ... ≤ θdk ∧dℓ ≤ π/2 denotes the principal angles [12, Sec. 12.4.3] between Sk and Sℓ . Note that 0 ≤ aff(Sk , Sℓ ) ≤ 1. If Sk and Sℓ intersect in p dimensions, i.e., if Sk ∩ Sℓ is p-dimensional, then cos(θ1 ) = ... = cos(θp ) = 1 [12]. Hence, if Sk and Sℓ intersect in p ≥ 1 dimensions, we have aff(Sk , Sℓ ) ≥ p p/(dk ∧ dℓ ). We are now ready to state our main result. The corresponding proof is outlined in Section 4. Theorem 1. Suppose that Xℓ is obtained by choosing nℓ (ℓ) (ℓ) points in Sℓ at random according to xj = U(ℓ) aj , j ∈ (ℓ)
[nℓ ], where the aj are i.i.d. uniform on Sdℓ −1 , and let X = X1 ∪ ... ∪ XL . Suppose furthermore that nℓ /dℓ ≥ 6 and dℓ ≥ c2 log nℓ , for all ℓ ∈ [L], where c2 is a constant that depends on dℓ only. If max aff(Sk , Sℓ ) ≤
k,ℓ : k6=ℓ
1 , 15 log N
with N = |X |, then modified TSC yields the correct segmentation of X with probability � � at least 1 − 3/N − P 1 −c(nℓ −1) n e + , where c > 0 is a nuℓ ℓ∈[L] n2ℓ log nℓ merical constant. Theorem 1 states that modified TSC succeeds with high probability if the affinity between subspaces is sufficiently small, and if the number of points in Xℓ per subspace dimension, i.e., nℓ /dℓ , for each ℓ, is sufficiently large. Intuitively, we expect that clustering becomes easier when the nℓ increase. To see that Theorem 1, indeed, confirms this intuition, set nℓ = n, for all ℓ, and observe that the probability of success in Theorem 1, indeed, increases in n. The original TSC algorithm introduced in [1, 10] has qj = q, for all points xj ∈ X , and takes q as an input parameter. We note that the statement in Theorem 1 applies to this (original) version of TSC as well with the conditions nℓ /dℓ ≥ 6 and dℓ ≥ c2 log nℓ replaced by q ≤ nℓ /6 and q ≥ c2 log nℓ , respectively. Theorem 1 is proven (for more details see Section 4) by showing that the connected components in the graph G with adjacency matrix A correspond to the Xℓ with probability satisfying the probability estimate in Theorem 1. (ℓ) Previous results for TSC [10] established that each xi ∈ Xℓ is connected (in G) to other points corresponding to Xℓ only, but it was not shown that the points corresponding to
Xℓ form a connected component, which, however, is essential to ensure zero clustering error. The condition nℓ /dℓ ≥ 6 (q ≤ nℓ /6 for the original TSC algorithm) is used to establish that each xj ∈ Xℓ is connected to points corresponding to Xℓ only, while dℓ ≥ c2 log nℓ (q ≥ c2 log nℓ for the original TSC algorithm) is needed to ensure that subgraphs corresponding to the Xℓ are connected. The latter condition is order-wise necessary. We finally note that the constant c2 is increasing in maxℓ dℓ . This is likely an artifact of our analysis, as indicated by numerical simulations, not shown here. 4. PROOF OUTLINE In the following, we give a brief outline of the proof of Theorem 1. For the sake of brevity, we will not detail the minor modifications needed to prove the statement for the original TSC algorithm. Let G be the graph with adjacency matrix A constructed by the modified TSC algorithm. The proof is effected by showing that the connected components in G correspond to the Xℓ with probability satisfying the probability estimate in Theorem 1, henceforth simply referred to as “with high probability”. To this end, we first establish that G has no false connections in the sense that the nodes corresponding to Xℓ are connected to nodes corresponding to Xℓ only. We then show that, conditional on G having no false connections, the nodes corresponding to Xℓ form a connected subgraph, for all ℓ ∈ [L]. To establish that G has no false connections, we first show that for each xj ∈ Xℓ the corresponding set Tj (q) contains points in Xℓ only, as long as q ≤ nℓ /6. (The condition q ≤ nℓ /6 is shown to hold below.) This is accomplished through the use of concentration inequalities for order statistics of the inner products between the (random) data points. Specifically, we show that (ℓ) for each xj ∈ Xℓ , and for each Xℓ , we have that (ℓ)
(k)
z(nℓ −q) > maxk6=ℓ,i zi (ℓ) (ℓ) z(1) ≤ z(2) ≤ ... ≤ (k) (ℓ) {zi }i∈[nℓ ]\j and zi
with high probability. Here,
(ℓ) z(nℓ −1) are the order (k) (ℓ) � = xi , xj .
statistics of
We next show that qj obtained in Step 1 of the modified TSC algorithm is equal to dℓ . This is accomplished by establishing that the smallest q for which (1) holds with τ = 0 is q = dℓ . Recall that XTj (q) is the matrix with columns xi , i ∈ Tj (q). As long as q ≤ nℓ /6, Tj (q) consists of points in Xℓ only (as argued above), therefore XTj (q) = U(ℓ) ATj (q) , where the columns of ATj (q) correspond to the ai , i ∈ Tj (q). Thanks to the orthonormality of U(ℓ) , we have
† †
(I − XTj (q) XTj (q) )xj = (I − ATj (q) ATj (q) )aj . 2
2
(4)
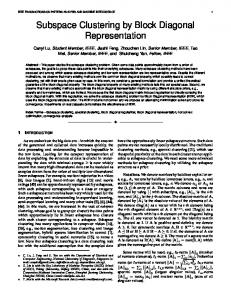
Lemma 1. Let a1 , ..., an ∈ Rd be i.i.d. uniform on Sd−1 , ˜ ˜ be the corresponding k-nearest d > 1, and let G neighbor graph, with s˜(ai , aj ) = arccos(|hai , aj i|) as the underlying distance metric. Then, with k˜ = γ c1 log n, where c1 depends onh d only, and is increasing in d, for every γ > 0, i ˜ is connected ≥ 1 − γ−1 2 we have P G n γ log n . 5. NUMERICAL RESULTS We compare modified TSC to TSC, SSC, and SSC-OMP on synthetic and on real data. For SSC, we use the implementation in [4]. Synthetic data: We generate L = 8 subspaces of R120 with dimension d = 30 each. Specifically, we choose the corresponding U(ℓ) ∈ Rm×d uniformly at random from the set of all orthonormal matrices in Rm×d , with the first d/3 = 10 columns being equal. This ensures that the subspaces intersect √ in at least d/3 dimensions and hence aff(Sk , Sℓ ) ≥ 1/ 3. The points corresponding to Sℓ are (ℓ) (ℓ) (ℓ) chosen at random according to xj = U(ℓ) aj + ej , j ∈ (ℓ)
(ℓ)
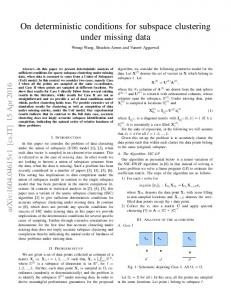
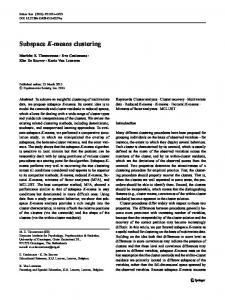
[n], where the aj are i.i.d. uniform on Sd−1 and the ej are i.i.d. N (0, (σ 2 /m)Im ) with σ 2 = 0.3. For each n, the clustering error is averaged over 50 problem instances. We choose q = 20 for TSC, stop OMP in OMP-SSC after 20 iterations, and set τ = 0.45 in modified TSC. The results, summarized in Fig. 1, show that SSC and SSC-OMP outperform TSC and modified TSC. However, TSC is computationally less demanding. Finally, modified TSC is seen to perform slightly better than the original TSC algorithm. Clustering handwritten digits: We next consider the problem of clustering handwritten digits. Specifically, we work with the MNIST data set of handwritten digits [13], and use the test set that contains 10,000 centered 28 × 28 pixel images of handwritten digits. The assumption underlying the idea of posing this problem as a subspace clustering problem is that the vectorized images of the different handwritten versions of a single digit lie in a low-dimensional subspace of unknown dimension and orientation. The empirical mean and variance of the corresponding clustering errors, depicted in Fig. 2, are
clustering error
TSC modified TSC SSC-OMP SSC
0.4
0.2
0 0
20
40
60
80
100
n
Fig. 1. Clustering error as a function of the number of points n in each subspace. TSC modified TSC SSC-OMP SSC
0.25
clustering error
With probability one, (4) is strictly positive if q < dℓ , and equal to zero if q = dℓ , thus qj = dℓ . Finally, note that nℓ /dℓ ≥ 6 ensures that qj ≤ nℓ /6, which resolves the assumption q ≤ nℓ /6. It remains to show that the nodes corresponding to Xℓ form a connected subgraph, for all ℓ ∈ [L]. Since hxi , xj i = hai , aj i for xi , xj ∈ Xℓ , it follows that the subgraph of G corresponding to the points in Xℓ is the q-nearest neighbor graph with pseudo-distance metric arccos(|hai , aj i|). The proof is then completed using the following result (with γ = 3).
0.2 0.15 0.1
5 · 10−2 50
100
150
200
250
number of points of each digit n
Fig. 2. Empirical mean and standard deviation of the clustering error for clustering handwritten digits. computed by averaging over 100 of the following problem instances. We choose the digits {0, 2, 4, 8} and for each digit we choose n vectorized and normalized images uniformly at random from the set of all images of that digit. We choose q = 7 for TSC, stop OMP in OMP-SSC after 7 iterations, and use τ = 0.45 in modified TSC. The results show that TSC outperforms modified TSC, SSC, and SSCOMP. TSC outperforming modified TSC may be attributed to the fact that for this dataset qj is large for several j, which means that some digits can not be well represented by its nearest neighbors. We hasten to add that for other problems and datasets, SSC may outperform TSC as, e.g., for the problem of clustering faces. Acknowledgments: We would like to thank Mahdi Soltanolkotabi for helpful and inspiring discussions. 6. REFERENCES [1] R. Heckel and H. B¨olcskei, “Robust subspace clustering via thresholding,” 2014, submitted to Ann. Stat.
[2] R. Vidal, “Subspace clustering,” IEEE Signal Process. Mag., vol. 28, no. 2, pp. 52–68, 2011. [3] E. Elhamifar and R. Vidal, “Sparse subspace clustering,” in Proc. of IEEE Conf. on Computer Vision and Pattern Recognition, 2009, pp. 2790–2797. [4] E. Elhamifar and R. Vidal, “Sparse subspace clustering: Algorithm, theory, and applications,” IEEE Trans. Pattern Anal. Machine Intell., vol. 35, no. 11, pp. 2765–2781, 2013. [5] G. Liu, Z. Lin, and Y. Yu, “Robust subspace segmentation by low-rank representation,” in Proc. of 27th Int. Conf. on Machine Learning, 2010, pp. 663–670. [6] E. L. Dyer, A. C. Sankaranarayanan, and R. G. Baraniuk, “Greedy feature selection for subspace clustering,” Journal of Machine Learning Research, vol. 14, pp. 2487–2517, 2013. [7] U. von Luxburg, “A tutorial on spectral clustering,” Stat. Comput., vol. 17, no. 4, pp. 395–416, 2007. [8] M. Soltanolkotabi, E. Elhamifar, and E. J. Cand`es, “Robust subspace clustering,” arXiv:1301.2603, 2013, Ann. Stat., accepted for publication. [9] M. Soltanolkotabi and E. J. Cand`es, “A geometric analysis of subspace clustering with outliers,” Ann. Stat., vol. 40, no. 4, pp. 2195–2238, 2012. [10] R. Heckel and H. B¨olcskei, “Subspace clustering via thresholding and spectral clustering,” in Proc. of IEEE International Conference on Acoustics, Speech, and Signal Processing (ICASSP), 2013, pp. 3263– 3267. [11] J. L. R. Kelley, General Topology, Springer, Berlin, Heidelberg, 1975. [12] G. H. Golub and C. F. Van Loan, Matrix computations, JHU Press, 1996. [13] Y. LeCun and C. Cortes, “The MNIST database,” 2013, http://ya nn.lecun.com/exdb/mnist/.