communication relies on numerous signal reflections off ..... 3.5. 21. 15. 9. 3. -3. -9. -15 m=3. Tx-Rx horizontal distance [m]. /2. /4. 0. R x a n g le ...... y-axis). As symmetric clipping is considered (at levels of. 0 and 2DC), these ratios correspond to ...
JOURNAL OF NETWORKS, VOL. 5, NO. 2, FEBRUARY 2010
197
Efficient Signal Processing in OFDM-based Indoor Optical Wireless Links Jelena Grubor and Klaus-Dieter Langer Fraunhofer Institute for Telecommunications, Heinrich-Hertz-Institut, Einsteinufer 37, 10587 Berlin, Germany Email: {grubor, langer}@hhi.fraunhofer.de
Abstract— We propose a rate-adaptive optical wireless transmission system based on orthogonal frequency division multiplexing for indoor communications. The investigations rely on realistic parameters of the key system components and focus on throughput maximization. We will show that a dynamically adaptive system can greatly enhance performance when compared to static operation, and how a loading algorithm, which optimally performs in powerlimited systems, needs to be adjusted if the specific terms of the optical wireless channel are to be rigorously obeyed. Our investigations include scenarios in which the non-negativity constraint on the optical source driving signal is strictly met and in which a certain amount of symmetric clipping is tolerated. In the latter case, the system can be regarded as power-limited and conventional loading algorithms are hence the most suitable. We will show that the transmission rate can be significantly improved even further by accepting a minor increase in the error rate as a result of controlled clipping, and we will compare our results with the upper system capacity limit. Index Terms— optical wireless, OFDM, adaptive transmission, loading algorithm, clipping, channel capacity
I. I NTRODUCTION The transmission of information via infrared (IR) radiation is considered to be attractive for high-speed indoor communication, especially where electromagnetic interference with existing radio systems must be avoided or wireless transmission with enhanced security is desired (like in medical facilities, airplanes, military objects, banks, etc.). According to many authors who provide an overview of indoor IR communication (e.g., [1]), the directed lineof-sight (LOS) and the non-directed link are the two basic link designs. Directed links have been shown to achieve speeds of more than 100 Mbit/s. However, user mobility can only be supported with complex and costly pointing and tracking mechanisms (mechanical [2] and electrical [2]–[5]). Even then, blocking of the LOS results in link failures. In a non-directed link configuration, communication relies on numerous signal reflections off the surfaces in the room, instead of, or in addition to the LOS. The so-called diffuse link is made to operate completely without LOS. Even though it inherently provides user mobility (no transceiver alignment necessary), This paper is based on “Adaptive Optical Wireless OFDM System with Controlled Asymmetric Clipping,” by J. Grubor, V. Jungnickel, and K.-D. Langer, which appeared in the Proceedings of the 41st Annual Asilomar Conference on Signals, Systems, and Computers, c 2007 IEEE. Pacific Grove, California, USA, in November 2007. °
© 2010 ACADEMY PUBLISHER doi:10.4304/jnw.5.2.197-211
a diffuse link requires relatively large transmission power and is severely speed-limited due to multipath propagation effects. Bit rates ranging up to 50 Mbit/s have been achieved in experiments using equalization [6]. Practical applications often call for a combination of the advantageous features of the two generic designs (user mobility of the diffuse and high-speed capability of the LOS link). The multi-spot diffusing approach was considered in [7]–[9] to improve the power efficiency of diffuse links by creating multiple LOSs between diffusing spots on the ceiling and the angle-diversity receiver. In [10], an additional diffuse transceiver mode was proposed to secure the reliability of an electronically tracked LOS link. However, this requires complex, multiple-element transmitters and receivers. To benefit from both basic link types, we consider a non-directed LOS link that encompasses both LOS and diffuse signal components at the receiver. Both measurements [11], and analytical models (e.g., [12]) indicate high dynamics in bandwidth and gain of the resulting compound channel, depending primarily on LOS prominence. In order to exploit the varying channel capacity with reasonable transmitter power levels (limited by safety regulations), yet to provide reliable operation and full coverage, we consider a rate-adaptive system concept based on multiple-subcarrier (MS) transmission. In such a system, the adaptive behavior is implemented by the processing of the electrical base-band signal. This means that it is possible to use simple and low-cost optical components. The frequency-domain approach is implemented with multicarrier modulation techniques (Discrete Multi-Tone, DMT or Orthogonal Frequency Division Multiplex, OFDM) which inherently deal with multipath distortion and allow for frequency-domain equalization with reduced complexity at the receiver. Rate-adaptive transmission, as proposed in [13]–[19], considers adaptive coding and modulation for serial transmission and, thus, requires complex time-domain equalization. The need for relatively high DC levels, i.e. a poor power efficiency, is a major disadvantage of optical wireless (OW) multiple subcarrier systems [20]–[22]. Approaches towards improving this situation involved block-coding [23]–[25], variation of the DC component on symbol interval basis, or peak-to-average power reduction techniques used in OFDM [26], [27] which resulted in a lower transmission rate or/and in high implementation complexity, thus limiting the number of subcarriers to just
198
JOURNAL OF NETWORKS, VOL. 5, NO. 2, FEBRUARY 2010
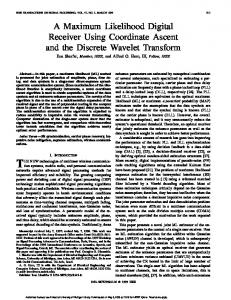
a few. In this paper, we will focus on throughput maximization in an OW OFDM-based system in a typical WLAN application. As often implemented in practical systems to improve power efficiency, we will adopt the simplest approach and allow a certain controllable amount of clipping at the transmitter, assuming that the additional errors can be tolerated. A special OFDM scheme, which foresees clipping, was suggested, e.g. in [28], for a narrowband OW channel. This scheme, however, exploits only half of the channel bandwidth since it assumes modulation of odd subcarriers only. We will show how a loading algorithm, which performs best in power-limited systems, needs to be adjusted under the specific constraints that the OW channel poses on the transmit signal waveform. We will also show that a dynamically adaptive system can hugely enhance transmission rates compared to a statically designed one, even if we put a conservative constraint on the electrical signal waveform by avoiding any clipping. In addition, we will investigate the influence of controlled symmetric clipping on system performance in terms of both error and transmission rate. The results show that the system capacity can be exploited even more by tolerating a minor increase in error rate as a result of clipping. The paper is organized as follows. A communication scenario and channel model are introduced in Chapter 2. Realistic system parameters, which are necessary for our investigations, are derived in Chapter 3, while the properties of the proposed rate-adaptive system are discussed in the subsequent section. Chapters 5 and 6 provide the performance analysis in the absence and presence of clipping, respectively, while conclusions are drawn in the final chapter. II. C OMMUNICATION S CENARIO AND C HANNEL M ODEL A. Indoor Communication Scenario Figure 1 shows a typical example of a scenario where a non-directed LOS link could be of use. It represents communication between a fixed access point (Tx) and a mobile terminal unit, e.g. a laptop (Rx) in a moderatesize room. Numerical simulations performed throughout Tx (fixed access point) 2m
F
r Reflections
LOS
3m
Q
(Lap-Top at working desk)
Rx
5m
5m
Figure 1. Indoor wireless optical communication scenario.
this paper assume the model room depicted in Fig. 1 with an Rx which may be anywhere at the desk-top surface © 2010 ACADEMY PUBLISHER
(distance, r to the Tx) and which has a free orientation (parameter θ) but the work is applicable to WLAN scenarios in general. Tx is assumed to be positioned at the center of the ceiling and pointing downwards. Tx and Rx are assumed to have wide-beam radiation characteristics and a wide Field-Of-View (FOV), respectively, so that both LOS and diffuse signals are simultaneously present at the receiver. It should also be noted that even though the access point at the ceiling is regarded in this paper as Tx and the mobile end-terminal as Rx, the communication scenario foreseen is bidirectional and the conclusions are valid for both directions. B. Noiseless Channel Model An analytical model for the OW channel of a nondirected LOS link was developed by Pohl et al. [29]. This model provides a good rule-of-thumb prediction of essential channel properties, such as path loss and bandwidth. It is simple and yet takes into account an infinite number of reflections unlike some the other models proposed. Unless the LOS is blocked, the impulse response of the non-directed LOS channel consists of two distinctive components - a discrete Dirac-like pulse (LOS contribution) and a continuous signal, arriving some time later (contribution of diffuse reflections) at the receiver. It was, in fact, recognized in [12] that the response of the diffuse channel is similar to that of an integrating sphere and that it can be well modeled with an exponentially decaying function. Accordingly, the channel frequency response is modeled as a superposition of a flat and a first-order low-pass transfer function H(f ) = =
ηLOS + HDIFF (f )e−j2πf ∆T e−j2πf ∆T , ηLOS + ηDIFF 1 + j ff0
(1)
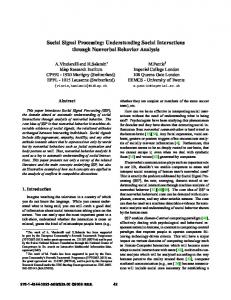
where f0 = (2πτ )−1 represents the 3 dB cut-off frequency of the diffuse channel. The delay of the diffuse component ∆T causes a frequency dependent phase offset −2πf ∆T in (1). Whereas the LOS-path amplitude gain ηLOS depends on the Tx-Rx geometry (radiation characteristic of Tx, FOV of Rx, orientation of transceivers with respect to the direct LOS direction), the two parameters describing the contribution of the reflections in the room, i.e. the diffuse-path amplitude gain ηDIFF and the cut-off frequency f0 both depend on the room properties (room dimensions, reflection coefficients of the surfaces, etc.). When the LOS component exists, large dynamics are present in the channel, depending on the ratio of the LOS and diffuse signal powers, i.e. on the so-called K-factor ηLOS . (2) K[dB] = 20 log ηDIFF In cases where LOS is blocked, K[dB] = −∞. The total channel frequency response magnitude |H(f )| for different K-factors is shown in Fig. 2. The channel gain is calculated over a 300 MHz frequency range for some illustrative K-factor values between −40 and +20 dB. It is clear that the channel response depends heavily
JOURNAL OF NETWORKS, VOL. 5, NO. 2, FEBRUARY 2010
199
1
/2
Rx angle of directivity, θ [rad]
Normalized magnitude, |H(f)|/ηDIFF
10
K = 10 dB 0
10
K = 0 dB K = -10 dB -1
10
K = -∞ dB
Diffuse
LOS
-3
15
0
LOS +Diffuse
21 50
100 150 200 Frequency [MHz]
250
300
Figure 2. Frequency response of the optical wireless channel for different values of the K-factor.
on LOS prominence (described by the K-factor). Where the LOS is blocked or very weak, the channel response is approximately low-pass and its bandwidth is quite small. The bandwidth corresponds in fact to the diffuse channel cut-off frequency, which is f0 ≈ 9 MHz for the room parameters considered. As the LOS becomes more pronounced, the channel response varies until it becomes almost flat for sufficiently large K-factors which means that bandwidths become, by an order of magnitude, greater than in the diffuse case. The notches in the characteristic appear at certain frequencies where both components destructively interfere. Further on, the K-factor is used as a single parameter to describe the channel state. To obtain the span of Kfactors of interest for the subsequent investigations, Kfactor distribution is calculated across the Rx-surface (desk-top height) in the room from Fig. 1, and for the Tx with a Lambert radiation characteristic of index m = 3. The distribution is presented depending on the receiver horizontal distance from Tx, r/ sin φ, and the angle θ (angle between the LOS arrival direction and Rx orientation) when the LOS is free. In the event of a more directed Tx characteristic (larger m), higher K values would be obtained for adequately oriented Rx and short Tx-Rx horizontal distances. However, with a growing distance or poor orientation, K-factors decrease more rapidly (there is a smaller ”hot-spot” area). In the following sections, the channel will be roughly characterized using a K-factor span of [−20, +25] dB. III. PARAMETERS OF S IMPLE O PTO -E LECTRICAL F RONT-E NDS Since the improvement in performance in the system considered is implemented with electronic signal processing, a simple optical system can be deployed (no angle diversity or pointing and tracking mechanisms). In such non-directed LOS optical links, a wide beam transmitter and a wide FOV receiver are used. As a prerequisite for investigation of the transmission method in question, this chapter will briefly discuss the opto-electrical frontends of the system, whilst aiming to keep them simple © 2010 ACADEMY PUBLISHER
-9
9 /4
-2
10
-15
3
m= 3
0
0
0.5
1 1.5 2 2.5 Tx-Rx horizontal distance [m]
3
3.5
Tx-Rx horizontal distance [m]
Figure 3. Distribution of the K-factor in [dB] at the Rx-plane, depending on the Rx orientation and its horizontal distance from the Tx.
as possible, and at the same time, however, to allow broadband transmission with a sufficient link budget. IR wireless systems, where optical power propagates openly through the air, generally comply with safety regulations. These limit the average optical power which is allowed at the Tx, depending on the viewing time, beam shape, apparent size and wavelength of the optical source [10]. Because of their wide modulation bandwidth, laser diodes present the optical source of choice for high speed links. However, due to the narrow semi-angle of their emission beam, lasers are classified as point sources which need to be diffused (with an additional component) if they are to be considered eye-safe. A diffuser destroys the spatial coherence of laser output and spreads the beam over a sufficiently extended aperture and emission angle, allowing thus for much higher power levels. In [10], it was shown that a diffused-beam source of extended diameter, emitting at 900 nm, has a much more relaxed power limit (at least several hundred mW due to the skin-safety limit) than a source working under the same conditions in the 1550 nm window. Moreover, low-cost and mature components are available for the 900 nm window. Even though ambient light noise has less influence at longer wavelengths, we assume that this is diminished by filtering at the Rx. For these reasons, in our present investigations, we consider transmission at 900 nm and a mean optical power of 400 mW for the numerical examples. At the transmission link receive-site, the IR receiver must be carefully designed. Typical receivers consist of an optical front-end (an optical filter to reject out-ofband ambient light plus an optical concentrator to collect and concentrate the incoming radiation), a photodiode and electrical front-end (preamplifier). Because of the unguided wireless propagation of optical signals, large area receivers are needed in order to receive sufficient power. Unfortunately, increasing the detector surface not only increases the cost, it also leads to an increase of inner capacitance and this has a negative impact on the receiver bandwidth. This is due to the fact that optical
200
JOURNAL OF NETWORKS, VOL. 5, NO. 2, FEBRUARY 2010
TABLE I. S UMMARY OF THE R ELEVANT R ECEIVER PARAMETERS FOR THE TARGET OW S YSTEM . Element Non-imaging Concentrator
Filter
Photodetector
Parameter type radius glass refraction index field-of-view type optical bandwidth transmission coefficient type multiplication factor responsivity excess noise factor diameter electrical bandwidth
Value (Quality) hemispherical RC = 5 mm n =1.8 ΨC = 90◦ thin-film, hemisph. ∆λ = 15 nm T0 = 0.8 Si-APD M =20 η = 0.7 A/W x = 0.36 d = 3 mm B = 100 MHz
detectors are usually designed for optical fiber systems where detector areas are small and the capacitance per unit area is less important. The following section outlines the arguments that lead to the choice of Rx parameters assumed in our further investigations and simulations. An optical concentrator is used to enlarge the receiver collection area. The constant radiance theorem limits the collection area of a given detector for a certain FOV, imposing a trade-off between gain and acceptance angle. We assume a hemispherical, non-imaging concentrator with a full FOV (180◦ ), achieving a gain of n2 , where n is the refractive index of the concentrator [20]. A hemispherical band-pass filter is assumed to reject out-ofband ambient illumination because wide FOV and narrow bandwidth (tens of nm) can be obtained at the same time [20]. It is well-known that APDs have a better sensitivity than PIN photodiodes. However, using APDs increases the shot noise component at the receiver. PINs are cheaper and do not enhance shot noise, however, their poor sensitivity can limit the link range for a given Tx power to an insufficient value in a desired system scenario. The relevant parameters of simple and available receiver components assumed for the numerical simulations in the next chapters are presented in Tab. I. It is assumed that such an APD-based receiver is shot-noise limited and that the SNR is given by 2 η 2 Psig , (3) SNR = 2qM x IBG B where Psig is the optical signal power, and IBG = ηpBG ∆λ(d2 /4)πn2 T0 is the photocurrent induced by the background light. In our numerical examples, a bright sky background light irradiance of pBG = 5.8 µW/nm/cm2 is considered.
IV. R ATE -A DAPTIVE OW S YSTEM A. OFDM-Based Rate-Adaptive OW System As introduced in Chapter 2, depending on the Tx, Rx and room characteristics, the channel frequency response varies from low-pass (about 10 MHz bandwidth) to approximately flat over the frequency range of hundreds © 2010 ACADEMY PUBLISHER
of MHz. It is, therefore, difficult to maintain the SNR sufficiently for high bit rates under all channel conditions using reasonable transmitter power levels. If, on the one hand, the system is designed to achieve sufficient SNR on all subcarriers according to the worst-case (purely diffuse) channel characteristic, the baseband bandwidth offered under favorable channel conditions will not be efficiently used, and the transmission rates achieved would then be too conservative. On the other hand, if the system is designed for transmission rates requiring bandwidths larger than those offered by the diffuse channel, error performance would be prohibitively poor and likely to lead to system outages. In order to efficiently exploit the channel bandwidth (i.e. to maximize the transmission rate, while maintaining reliable operation and full coverage), it makes sense to consider dynamically adjusting the set of subcarriers used along with the modulation orders deployed on them to the current channel condition. In such a scenario, a good subcarrier (faced with a favorable channel gain and relatively small noise enhancement) would use a higher-order modulation scheme and carry more information, whereas a poorer one would carry less or even no information, but transmission with a required bit-error-rate (BER) could still be achieved despite the impairments in the channel. In this way, such a rate-adaptive system is able to transmit at high speeds under favorable channel conditions and to reduce throughput (until the desired BER is achieved) as the channel degrades. The following sections present the main features of a modulation-adaptive system which is able to dynamically adjust the transmission rate to the OW channel and to efficiently exploit system capacity. Figure 4 illustrates the most important operational blocks and signal flows of this concept. Data, mapped to M-QAM Parallel data
Parallel data
Noise Enhancement Vector (channel information)
N-1
N-1
Equalization Loading algorithm
Adaptive mapping
Channel and NE estimation
N-1 OFDM modulator: • Hermitian symmetry • 2N-IFFT • CP insertion • P/S conversion
N-1
OFDM demodulator: • 2N-FFT • CP removal • S/P conversion
DAC LPF
ADC LPF Ambient light
DC (X0=0) OW channel
O/E front-end (LD)
Tx
O/E front-end (PD+DC blocker)
Rx
Figure 4. Block scheme of an adaptive OW system based on real-valued OFDM. LPF denotes low-pass filter, P/S and S/P denote parallel-to-serial and serial-to-parallel conversion, respectively, while all other acronyms are defined in the text.
symbols, is sent over multiple orthogonal subcarriers which together directly modulate the optical source. In an adaptive system, the order of the modulation and the symbol amplitude (i.e. power) are determined by a loading algorithm which is based on the Cannel State Information
JOURNAL OF NETWORKS, VOL. 5, NO. 2, FEBRUARY 2010
201
(CSI) obtained from the receiver via a feed-back link. An IM/DD OW system requires a real-valued OFDM signal to be generated by digital signal processing as well as a DC component to help properly drive the source. With N independent subcarriers foreseen in the system (i.e. subcarriers carrying independent information), a 2N IFFT block is required to generate a real-valued OFDM symbol because conjugate symmetry is required on the input vector at the IFFT input [X] = [X0 X1 . . . XN −1 ] by setting X2N −n = X(n)∗ , n = 1, 2, . . . , N − 1, XN = 0, X0 ∈ R.
(4)
The first input X0 , corresponding to zero frequency, must be real-valued and is generally left unmodulated. Obviously, the need for Hermitian symmetry at the input requires doubling the size of the IFFT block (which is not an implementation issue for a moderate number of subcarriers considered in OW), however, it does allow digital implementation of multicarrier modulation (without prohibitive analogue filter banks). Such an approach to real-valued IFFT output is used in DSL technology where it is referred to as Discrete Multitone (DMT) [30]. The element X0 can be used to set the DC level of the output signal. Alternatively, it can be set to zero and DC can be added directly in front of the source. If the other N − 1 elements of the input vector (corresponding to the independent subcarriers) are given by Xn = an + jbn , time samples at the output of 2N -IFFT (assuming (4)) are x(k) =
2N −1 nk 1 X Xn ej2π 2N 2N n=0
N −1 1 Xp 2 X0 an + b2n + = N n=1 2N ¶ µ bn 2πnk , + arctan cos an 2N
(5)
for k = 0, 1, . . . , 2N − 1. As in conventional OFDM systems, a guard interval in the form of a cyclic prefix (CP) is inserted between consecutive OFDM symbols at the Tx in order to eliminate inter-symbol interference and preserve subcarrier orthogonality. The signal reaches the receiver corrupted by the influence of the OW channel and ambient light (enhancing the shot-noise component at the Rx). A channel estimation is obtained using a training sequence, so that equalization and demapping of valid data can be performed and the information needed at Tx can also be obtained. For instance, in order to follow channel variations, adaptive transmission requires accurate channel estimates at the receiver and a reliable feed-back link between Rx and Tx to provide CSI (or more particular, the noise enhancement vector, NEV) to the transmitter. The feedback link required can be made reliable if it is set to occupy the lowest subcarrier(s) of the uplink which are always suitable for transmission (low frequencies in Fig. 2). In this way, the link operates even under worst-case conditions where © 2010 ACADEMY PUBLISHER
LOS is shaded and only diffuse light is received. At the Tx, each subcarrier is consequently modulated with the most suitable modulation format. The data rate is therefore chosen carrier by carrier, and the system is able to adapt to a large span of channel conditions, thus efficiently exploiting its capacity while keeping the transmission reliable. B. Constraints on the Transmit Signal Waveform The digital-to-analog converter (DAC) in front of the optical source generates a modulating signal x(t) which presents the sum of cosine waves, with amplitudes An and initial phases ϕn determined by the symbols of input vector [X] x(t) =
N −1 1 X X0 An cos (2πfn t + ϕn ) , + N n=1 2N
(6)
− TCP ≤ t < TFFT , where TCP is the length of CP and TFFTp is the OFDM symbol interval without CP. Values An = a2n + b2n and ϕn = arctan bn /an are constant over one OFDM symbol period. The OW channel places specific constraints on the waveform x(t). Whereas the mean electrical power of the modulating signal is limited in conventional RF or DSL channels, in OW, safety regulations limit the mean optical power at the transmitter. This means that the mean value of x(t) (i.e. the DC value) is constrained. Additionally, a non-negative electrical waveform signal is needed (since this signal is directly translated into optical power). The conditions can therefore be written as ¶ µ X0 ≤ PO ∧ (x(t) ≥ 0) . (7) hx(t)i = 2N We hereby assume that the data symbols appear with equal probability, so that the insertion of the CP does not influence the mean value of x(t) and the conversion factor of the optical source is set to 1 W/A without loss of generality. Since x(t) is characterized with relatively high peaks, the DC figure needed is relatively high. Nevertheless, since these high peaks occur rarely, setting the system constraints as (7) results in a conservative limit for the transmission rate as will be shown in the following chapters. V. T HROUGHPUT M AXIMIZATION UNDER C ONSERVATIVE C ONSTRAINT The throughput achievable in a given system depends on many parameters. In Chapter 3, a set of suitable parameters was chosen for a realistic system with simple optoelectronic front-ends. A baseband signal bandwidth of B = 100 MHz was assumed for broadband transmission. This leads to a sampling interval of Tsam = 5 ns, so that a typical indoor OW channel length can be handled with guard intervals L = 16 samples long (cyclic prefix). In order to have good spectral efficiency (2N/(2N + L)),
JOURNAL OF NETWORKS, VOL. 5, NO. 2, FEBRUARY 2010
A. Review of the Krongold Algorithm The Krongold algorithm uses the Lagrange multiplier method to maximize the discrete function of the total system throughput (i.e. spectral efficiency) under the total signal power constraint max(RTOT =
N X
Rn )
n=1
N X
Pn ≤ PTOT ,
(8)
n=1
where N denotes the number of subcarriers in the system, Rn represents the (integer) number of bits allocated to the nth subcarrier and Pn represents the power which is needed for symbol complexity Rn to be detected with a desired BER. The fact is that, depending on the BER required, each MF requires a certain SNR, and depending on the noise in the related channel, this SNR requires a certain power of the transmitted signal, thus rendering a relation between the rate Rn and the power Pn needed for transmission. This means that each variation of bit allocation represents a point in a total-rate-vs-total-power (RTOT -PTOT ) plane as shown in blue in Fig. 5a. This figure presents an illustrative example where allocation over 4 subchannels is assumed with possibilities for 0, 1, 2, 3 and 4 bits. The Lagrange method with multiplier λ ∈ R finds the maximum of the function N N X X J(λ) = Rn − λ Pn , (9) n=1
n=1
as ∂Rn =λ ∂Pn
(∀n = 1..N ).
© 2010 ACADEMY PUBLISHER
(10)
Total rate (spectral efficiency), RTOT [bits/transmission]
16
Unique, optimal solution
14
λoptimal
12 10
a
8 6
N=4
4
Rn = [0, 1, 2, 3, 4] Convex hull
2
All solutions
PBUD 0
Total power, PTOT
Total spectral efficiency [bits/transmission]
N − 1 = 63 independent subcarriers are considered over the bandwidth B. With such values for bandwidth and the FFT size, the potential for throughput maximization using efficient signal processing is investigated in this section. One of the main design parameters limiting the bitrate performance of a practical system is the maximal bit-error ratio (BER) allowed which can be interpreted as the guaranteed quality-of-service (QoS) on the physical layer. With the CSI available at the transmitter, the transmission scheme can be adapted to the current channel state. In rate-adaptive systems, the amount of information transmitted can be maximized by means of loading algorithms (LA). Based on the CSI, these schemes vary the transmitted power level, constellation size and/or code rate or type of transmitted signals. This means that maximum throughput is achieved while keeping the system constraints satisfied regarding the BER and transmit signal. Thus, without increasing the error probability, these algorithms provide high average spectral efficiency by assigning a lot of information to be transmitted under favorable channel conditions and reducing the throughput as the channel degrades. For further evaluations in this paper, we adopted the loading algorithm proposed by Krongold [31] for powerlimited systems and considering QAM modulation.
Subchannel rate (spectral efficiency), Rn [bits/transmission]
202
66
β Rmax =4 β
55
min R =4
44
33
b
22 11 00
Operational characteristic (OPC)
0
50
100
150
200
250
300
350
400
450
500
Subchannel power, Pn N(N =1), i.e. SNR SNR = P[W] (for = n1W)
Figure 5. (a) RTOT -PTOT diagram with all rate-power combinations. (b) The operational characteristic (OPC), i.e. Rn -Pn |Nn = 1 curve on each individual subchannel.
In other words, the rates and powers for each subchannel of the optimal solution correspond to the ”optimal operating point” on the convex hull of the RTOT -PTOT diagram. The optimal operating point is the first point on the convex hull which is met by a line of slope λ. The optimal solution is always on the convex hull because this curve connects solutions (bit combinations) that require minimal total power for each possible total rate (see Fig. 5a). All other bit combinations are located on the right side of these best solutions, i.e. they require more power. Moreover, since only discrete rates are possible, each point on the convex hull has a continuous range of optimal λs. Since the SNR on subcarrier n is given as SNRn = Pn /Nn , the optimal solution (10) can be written over the so-called operational characteristic (OPC) of each channel ∂Rn ∂Rn 1 = βn , (11) =λ → ∂SNRn ∂SNRn Nn where βn = Nn λ is the optimal slope on the OPC of subchannel n = 1, .., N . The OPC is given as the ratevs-power characteristic with unity equivalent noise (i.e. rate-vs-SNR). This characteristic (illustrated in Fig. 5b) is the same for all the subchannels and the Rn -Pn characteristics all have the same shape; the only difference being the scaling of the OPCs x-axis with Nn . Conveniently, since the OPCs are the same for all subcarriers, the ranges of optimal β slopes for each operating point on the OPC are constant, and can be
JOURNAL OF NETWORKS, VOL. 5, NO. 2, FEBRUARY 2010
203
8
placed in a look-up-table (LUT). For a particular λ, βn is calculated for each subchannel and due to its value, a corresponding point (Rn , SNRn ) is read from the LUT. It was proposed that the optimal λ value be found by way of iteration using a bisection method.
7
a
6 ΣAmax
Since the optical wireless channel is not power-limited in a conventional manner, no loading algorithm developed for power-limited systems can be applied quite in its original form. The reason for this is the fact that due to the constraints on the signal in front of the optical source (7), the electrical AC power of the signal cannot be uniquely determined. The only way to ensure that the conditions concerning signal non-negativity and mean value (mean optical power) are fulfilled is to set the maximum amplitude of the signal below or equal to the DC value (which is best set to the optical power constraint). Without a loss of generality, scaling of the FFT blocks is omitted. In a system of N −1 independent subcarriers, it can be written An,max ≤ PO ,
(12)
3 2
LA result optimal allocation DC
OPC, Rn = 0,1,..,8 Convex hull, Rn = 0,1,..,8 OPC=Convex hull, Rn = 0,2,4,6,8
1 0 0
10
20
30 An, max [A] [A] n,max
40
50
60
8
b 7 6 5 Rn [bit] n
2
N −1 X
…
4
…
B. Conservative Loading in the OW System
RTOT
R Rn [bit]
5
4
n=1
where An,max presents the maximal amplitude of a signal constellation on the nth subcarrier. Originally, the OPC presents Rn -Pn relationship with unity equivalent noise. In the case where the limit is set on the sum of maximum amplitudes of the constellations on different subcarriers, an OPC Rn -An,max with unity Nn is needed. The relationship between the SNR on a subcarrier modulated by MFn and its maximum amplitude is given by Á 2 SNRn = f (MFn )An,max Nn , (13) where the factor reflecting the ratio between the mean constellation power and the square of its maximum amplitude is ( 1, BPSK, √ (14) f (MFn ) = 1 √Mn +1 3 M −1 , square-M-QAM. n
In the case of M-QAM constellations where M is an odd integer, there is no common relationship like (14), f (MF) depends on the constellation layout. For the purpose of OPC illustration, factors for 8-QAM, 32-QAM, and 128QAM have been found to be 0.599, 0.588 and 0.428, respectively. Because of the quadratic relationship of SNRn and An,max , it is convenient to define a normalized SNR for each MF as SNR∗ = SNR/f (MF) and obtain the OPC using the relation 1 ∂Rn ∂Rn √ . = p ∂An,max ∂ SNR∗n Nn
(15)
Therefore, the OPC Rp n -An,max with unity equivalent noise is given by Rn - SNR∗n relation. Such OPC is presented in Fig. 6a for Rn = 0, 1, . . . , 8 and BER= 10−4 © 2010 ACADEMY PUBLISHER
3 2 1 0 0
OPC, Rn = 0,1,..,8 OPC=Convex hull, Rn = 0,2,4,6,8 5
10
15 20 A A [A] [A]
25
30
35
n
Figure 6. (a) The OPC, i.e. Rn -An,max |Nn = 1 plot on each individual subchannel. (b) The OPC, i.e. Rn -hAn i|Nn = 1 plot on each individual subchannel. Changing the BER will not affect the shape of the characteristics.
as an example. It is clear that the OPC no longer has a concave shape, i.e. that there are some points which lie below the convex hull (Rn = 1, 6 are obvious). A first consequence of such an adverse shape is that the algorithm cannot be reliably implemented. This means that it can happen that a slope βn obtained at some point in the algorithm corresponds to more than one pair (Rn , An,max ) because the ranges for β are not disjunct. As this is not foreseen by the implementation, the algorithm would not converge to a unique solution. A second consequence is that, even if the algorithm converges, a non-concave OPC would mean that the result may not be the optimal solution. In the case of an OPC, like in Fig. 6a, the total-rate-vs-sum-of-amplitudes diagram (analogue to the diagram from Fig. 5a) would also not have a concave shape, and some of the operating points (for some total rates) would be located below the convex hull of this diagram. Since the Lagrange method converges to a point on the convex hull, the LA will reliably converge to the optimal solution only if all the (best) operating points
JOURNAL OF NETWORKS, VOL. 5, NO. 2, FEBRUARY 2010
RTOT =
N −1 B X Rn , N n=1
(16)
which represents the gross rate (without the influence of CP or other overhead components). In the figure, three plots are shown, representing achievable bit rates in a dynamically adaptive system and reflecting different target BER values. Clearly, the rates achievable can be increased by allowing for a higher error tolerance. With deployment of sophisticated error correction techniques or automatic repeat request (ARQ) algorithms, for instance, the BER can be set as high as 10−3 . . . 10−2 , however, their complexity will influence the system overhead needed. Curves for a statically designed multiple subcarrier system, which aim guarantee the corresponding transmission performances over the whole area of interest (in this paper, the whole desk-top plane in the model room of Fig. 1), are also shown as a reference. These plots are referred to in Fig. 7 as a non-adaptive solution and are obtained also by (16), in the case of a purely diffuse channel (worst case channel realization) where only a small portion of the bandwidth is available for transmission (i.e. the first few subcarriers). Fig. 7 clearly shows that an adaptive system would © 2010 ACADEMY PUBLISHER
[Mbit/s]
be more than adequate for indoor IR applications. An adaptive system can recognize and exploit the channel knowledge efficiently and thus has the potential for much higher transmission rates than a non-adaptive system. The benefits (with respect to a non-adaptive system) increase with the K-factor and become significant earlier (lower K-factor) if higher BERs are permitted. The increase in achievable rates can be seen to be slow to start, however, this becomes much faster from the point where the link becomes transparent (i.e. all subcarriers are modulated).
Adaptive system
2
10
BER = 10-2
TOT
possible P are located on the convex hull of the total RTOT − n An,max diagram. Since this is not the case, it may happen that that the LA “oversees” the optimal solution and converges to the first solution below it on the convex hull, as illustrated in the inset in Fig. 6a. Figure 6b presents a similar plot, the difference here being that the SNR is not represented by the maximum constellation amplitude but by a mean amplitude. The OPC defined in this way will be of interest in the next chapter. It is rather important to note here that the same conclusion can be reached for such OPC with respect to the choice of MF set as for the OPC in Fig. 5a. This condition of the concave total-rate-vs-sum-ofamplitudes diagram translates into two conditions for the subchannel OPC: it must be concave (i.e. it must be equivalent to its convex hull) and it must have uniform steps on the y-axis. The term “uniformity of the y-axis” means that the difference between two adjacent symbol complexities considered is constant. The necessity for this second condition can be easily shown by a counterexample (assuming Rn = 0, 2, 3, 4 also results in a “nonconcave” total diagram). Based on the previous discussion, only square QAM is taken in consideration (Rn = 0, 2, 4, 6, ...) for application of the Krongold algorithm to the OW channel with the limit on the sum of maximal constellation amplitudes. This ensures reliable convergence of the algorithm to the unique optimal solution under the given conditions. Figure 7 presents the rates obtained by the LA over different channel realizations where the bits are distributed over N − 1 = 63 subcarriers and under the limit on the sum of maximal constellation amplitudes (12). The total bit rate RTOT [bit/s] is obtained by
Transmission rate, R
204
BER = 10-4 BER = 10-6
BER = 10-2 BER = 10-4
1
10
BER = 10-6
Non-adaptive system -10
-5
0
5 10 K [dB]
15
20
25
Figure 7. Comparison of the adaptive and non-adaptive system performance using the conservative Krongold LA for different BERs.
VI. P ERFORMANCE IN THE P RESENCE OF C LIPPING The investigations in the previous chapter showed that the dynamically adaptive system design is very attractive for the communication scenario considered, and that it enhances the transmission rates achievable with respect to the non-adaptive system for many channel states of interest, even under the strict non-negativity condition. While this approach ensures the non-negativity of the signal transmitted, setting the sum of amplitudes equal to DC (thus, assuming all subcarriers in phase) at the same time leads to rather conservative bit rates. In order to increase the achievable transmission rates further, it is assumed in this chapter that symmetric clipping is permitted at the transmitter. It is assumed that the additional clipping errors could be post-compensated or even tolerated since very high peaks occur rather rarely in the transmission signal. Hence, in a system where DC is limited, if somewhat greater tolerance of error performance is accepted by allowing for clipping, significant improvements in transmission rate can be expected. Similarly, for the same targeted transmission rate, a significantly lower DC is needed. Such approach thus also enhances system power efficiency. This chapter investigates the influence of controlled clipping on the performance of the OFDMbased OW system in terms of both error and transmission rate. As already mentioned, if clipping is permitted, the AC power of the transmission signal can be increased and this leads to higher transmission rates (assuming,
JOURNAL OF NETWORKS, VOL. 5, NO. 2, FEBRUARY 2010
205
The effect of clipping on system performance is investigated by means of Monte-Carlo (MC) simulations. For a certain assumed channel state (described by the K-factor within the range of −10 . . . + 25 dB) and a certain assumed DC limit (eye safety limit of 400 mW optical power), the sum of amplitudes (the amplitude budget, Abud ) is increased in steps over DC and the resultant total BER is observed.1 For each new Abud , a new result of the AD-LA is obtained. It is assumed that each subcarrier can carry Rn = {0, 2, . . .} bits. The AD-LA itself distributes bits and amplitudes yielding to a chosen BER, assuming only the presence of noise in the channel (no clipping). This error rate will be later referred to as BERLA , as opposed to the total error rate shown as BERTOT , which includes errors due to clipping. AD-LA is practically the same as in the previous chapter with only a minor change. It was, namely, necessary to define the amplitude budget in the previous section as the sum of maximal amplitudes of the constellations associated to the subcarriers in order to fully ensure no clipping. Nevertheless, the amplitude budget is redefined in the following as the sum of mean amplitudes of the constellations associated to the subcarriers
Á SNRn = f (MFn )hAn i Nn , 2
(18)
where the factor reflecting the ratio between mean (square M-QAM) constellation power and the square of its mean amplitude is derived as f (MFn ) = ³
2 3 (M − 1) √ √ P M −1 P M −1 4 q=1,3,... p=1,3,... M
p
p2 + q 2
´2 . (19)
B. Influence on Error Performance Symmetric clipping is assumed to occur in the digital domain (at the FFT output, in front of DAC), so that for the assumed DC, given by PO and set by X0 , clipping of high peaks is enforced on the digital signal x(k) as xc (k) < 0, 0, 2X0 , xc (k) > 2X0 , (20) xc (k) = x(k), otherwise. Clipping introduces a random shift in each symbol sent, depending on amplitudes and phases of the symbols sent on all subcarriers. It therefore presents additional interference which can significantly affect the decision process at the Rx. Unless the variance of clipping distortion is negligible with respect to background Gaussian noise variance, BERTOT will rise due to clipping errors. Figure 8 presents the influence of clipping errors on BER performance for several illustrative channel states. The bit-error rates shown in Fig. 8 are given as mean val0
10
K= K= K= K=
-1
10
0 dB 10 dB 15 dB 20 dB
-2
10 TOT
A. Simulations Scenario
amplitude is given by
BER
of course,that the error performance remains below the tolerance boundary). There are two ways to approach this. The total AC power can be either directly increased or it can be indirectly increased by increasing the sum of subcarrier amplitudes until error performance reaches a certain threshold. Since the investigations in the previous section regarding the limit on the sum of amplitudes and the rate when no clipping is permitted can be used as a reference, the same approach is adopted in order to qualitatively evaluate and describe the effects of clipping on the BER. Both approaches are considered and compared, however, for bit rate maximization. In order to be able to easily distinguish between the two approaches, we refer to them as amplitude distributing LA (AD-LA) and power distributing LA (PD-LA).
-3
10
-4
10
2
N −1 X
hAn i ≤ PO ,
(17)
n=1
and the corresponding OPC is given in Fig. 6b. The reason for this is that, even though clipping can theoretically occur with (17), its influence is statistically too low to cause a significant error increase (as can be seen in the simulation results), yet, the rates provided are less conservative. This will be seen in the examples illustrated later in this paper. The relationship hereby between the SNR on a subcarrier modulated by MFn and its mean 1 Because of simpler implementation, MC simulations were performed to render a symbol error ratio. Additional investigations were performed (not shown in the paper) which showed that for the targeted BERs up to an order of magnitude of 10−2 , BER≈SER/ log2 M is a good approximation if Gray coding is assumed (i.e. most erroneous symbols due to clipping have only one falsely detected bit).
© 2010 ACADEMY PUBLISHER
-5
10
0
2
4 10log(2A
6 /DC) [dB]
8
10
bud
Figure 8. Influence of clipping on the system error performance for different channel realizations. The plot with non-filled markers reflects the case where no clipping is enforced and corresponds to the error rates predicted by the loading algorithm.
ues (averaged over all active subcarriers). Since BERLA of 10−5 is assumed, in the case where clipping is not implemented (imaginary scenario of a perfectly linear, infinitely long laser characteristic), the result of the MC simulations reflects the system performance only under disturbance from background noise and corresponding to the error rates predicted by the loading algorithm irrespective of how high the amplitude budget is chosen. This plot
JOURNAL OF NETWORKS, VOL. 5, NO. 2, FEBRUARY 2010
(a)
(b)
two bits are allotted to the subcarriers so far unused (4-QAM, where all symbols have the same amplitude) which has a minor influence on BER or/and, amplitudes of already active subcarriers are increased by increasing the modulation order and this has a strong influence on the resultant BER growth.
the resulting maximum budget,3 but has no significant implications for the rate achieved. In this case, instead of bit error-rates, certain symbol error-rates are targeted in simulations because of slightly better accuracy. Since the conclusions have a rather qualitative character, they are just as valid for practical systems where the BER is targeted. In order to have a sound basis for MC simulations, a maximal SERTOT ≤2 · 10−3 is targeted. When clipping is permitted in the system, different ratios between noise and clipping error rates are investigated in order to determine the influence on the improvement of transmission rate. The results are presented in Fig. 9 regarding the following cases: 1) SERLA =1.9 · 10−3 , so that the permitted SERCL ≤10−4 ; the ratio between the errors due to noise and due to clipping is well in favor of noise (green). 2) SERLA =10−3 , so that the permitted SERCL ≤10−3 ; noise and clipping contributions are approximately the same (red). 3) SERLA =10−4 , so that SERCL ≤1.9·10−3 ; the ratio between the errors due to noise and due to clipping is well in favor of clipping (blue). 7
When effect (a) is dominant over effect (b), the increase of the BER is slow and steady, whereas, in the opposite case, the BER increases rapidly. Figure 8 shows that in case of K = 0 dB, effect (b) is dominant from relatively low Abud . In the case of relatively flat channels, however, there is a significant range of Abud for which the effect (a) is dominant before (b) takes over. It can be concluded that with the larger K-factor, as long as new bits are predominantly allocated, the increase of the BER is slower. At the same time, however, the effect (b) becomes dominant for lower Abud (compare cases K = 15 dB and K = 20 dB in Fig. 8). This can be explained by the fact that the same increase of Abud causes more subcarriers to be activated when K is higher. It is, therefore, important to realize that for a certain tolerated BER in the system (which allows for clipping), the maximum amplitude budget permitted (indirect power budget) differs for different channel realizations. Which BER can be accepted in a system depends finally on the error correction mechanism. Further investigations show how allowing some clipping can improve system performance in terms of the rates achievable. In the simulations, a DC of 400 mW is assumed and the amplitude budget is increased in steps of 25 mW. This can lead to some inaccuracy in 2 In practical systems, part of the budget, left over after distribution, is often equally divided among the active subcarriers in order to enhance the SNR and minimize errors (below BERLA ). In order to be able to distinguish the clipping from noise effects more easily, such a step is not included in the simulation results presented in this work. Nevertheless, additional simulations with extra budget distribution were performed, supplying practically the same results. This led to the conclusion that the budget is usually well exhausted.
© 2010 ACADEMY PUBLISHER
SERTOT ≤ 2 ⋅ 10-3
-4 SER =1e-4 SERLA LA = 10 -3 SER =1.9e-3 SERLA LA = 10
6
SER =1e-3 -3 SERLA LA = 1.9 ⋅ 10 SERLA = 2 ⋅ 10-3
5
Symmetric clipping 4
3
bud
/DC
(non-filled markers) therefore serves as a reference and also indicates that simulations are properly performed.2 From the plots reflecting clipping, it can be concluded that for a certain K-factor the amplitude budget can be increased up to a certain point without a noticeable influence on the total BER which remains in the range of 10−5 as set by the loading algorithm. At the same time, with a larger amplitude budget, the amount of information transmitted grows. In this range, the effect of clipping is still negligible with respect to the background noise component. As the signal power is further increased, errors due to clipping unavoidably become more significant and occur more often, evoking a steep increase of BERTOT which asymptotically approaches 0.5. Clearly, the increase of the BER due to the increase of signal power depends on the channel state. Increasing the signal power generally results in two effects:
2A
206
2
DC level
1
a 0 -9
-6
-3
0
3
6 9 K [dB]
15
18
21
24
SERTOT ≤ 2 ⋅ 10-3
SERLA = 10-4 SERLA = 10
12
-3
SERLA = 1.9 ⋅ 10-3
bits/OFDM symbol
SERLA = 2 ⋅ 10-3 2
10
clipping tolerance grows
Symmetric clipping
no clipping 1
10
b -9
-6
-3
0
3
6 9 K [dB]
12
15
18
21
24
Figure 9. Comparison of the (a) permitted sum of subcarrier amplitudes and (b) achievable transmission rates for different contributions of background noise and clipping effect to overall system error performance. N = 64 and DC= 400 mW are assumed.
Figure 9a shows the Abud limit over different channel 3 The
maximum rates achievable can be slightly higher.
JOURNAL OF NETWORKS, VOL. 5, NO. 2, FEBRUARY 2010
states. The black line represents the reference case when no clipping is permitted in the system and the loading algorithm itself aims at SERLA = 2 · 10−3 = SERTOT . No clipping in the system is achieved by deploying the conservative AD-LA which distributesPthe maximal constellation amplitudes, with Abud = An,max = X0 /2 =DC (as in the previous chapter). Three stair-like plots reflect the three cases when clipping is permitted. It can be seen that the maximal Abud first increases with channel quality, however, it decreases again for very large K-factors. The reason for this is that only a moderate or small budget increase is enough for such particularly good channels to drive the system into the state where all subcarriers are active. This means that any further increase of Abud results only in an increase of modulation orders (effect (b)), thus causing a rapid deterioration of the BER. For poorer channel realizations a certain increase in budget over DC is possible, however not a large one, since in such low-pass-like channels, the extra power conveys in increase of the amplitudes of the few subcarriers active. Nevertheless, in the case of most channel states, with the small decrease of performance (from SERLA to SERTOT ), the system can operate with much more modulating power and expect to provide significantly higher transmission rates. This can be seen in Fig. 9b, where the rates achievable are compared for the same cases considered. Looking at the plots, it can be concluded that operation with clipping is very beneficial. The rates achieved in case SERLA = 2 · 10−3 are clearly below the other cases where clipping is foreseen. Moreover, targeting a rather significant portion of clipping errors is recommendable. For instance, in the case SERLA = 1.9 · 10−3 , the rates achieved are not as high as in the other two cases with clipping since there is practically no buffer for clipping and the Abud values permitted are closer to the figure of 12 DC (see Fig. 9a). Cases 2 and 3 show very similar performances in terms of achievable rates. Setting the SERLA target too conservatively (case 3), however, requires deployment of higher signal powers (see Fig. 9a). In addition to this, the transmission rate R achieved for a given channel state increases when Abud increases and/or when SERLA increases as R = f (Abud , SERLA ). This means that if the LA target is too conservative (case 3), it can occur that the increase in amplitude budget (with respect to DC), which is gained by higher clipping tolerance, is not sufficient to cope with the decrease of the noise contribution permitted. No significant improvement in rate can then be achieved, or a decrease in the maximum rate may even occur. It can hence be concluded that it makes most sense to target the total SER (or BER) with approximately equal contributions due to noise and clipping (case 2). If the LA has a finite set of modulation formats, once all the channels are filled with a maximum number of bits, a further increase of the K-factor then leads to no increase in bit rate. However, since less power is needed for the transmission of these bits, error performance improves © 2010 ACADEMY PUBLISHER
207
and approaches error performance without clipping. Since a maximum of 12 bits were assumed in the LA foreseen, K-factors by which this occurs are beyond the range shown in the figure.
C. Bit Rate Maximization As stated at the beginning of this chapter, the effect of clipping on error and rate performance in the system considered has been investigated and qualitatively described up to now by varying the sum of subcarrier amplitudes since it is easier to compare the results to the “no clipping” case. Now, once clipping is permitted in the system and if the total BER limit is the only constraint, one can directly increase the electrical power budget in the similar manner and distribute the electrical power over the subcarriers using the conventional Krongold loading algorithm, denoted as PD-LA. Figure 10a presents the rates achievable when PD-LA is implemented (blue plots) and when AD-LA assumed up to now is considered (red plots). The results for BERTOT ≤ 2 · 10−5 and BERTOT ≤ 2 · 10−3 are shown with corresponding loading algorithms aiming at BERLA = 10−5 and BERLA = 10−3 , respectively. The increase of power budget Pbud is performed in steps of 0.625 mW. Figure 10a shows that for a significant range of channel realizations, the distribution of powers results in better rates. The most striking differences appear for the intermediate K values (neither too low and nor too high). This is due to the fact that for a particular K within this range, the permitted power budget Pbud , which still satisfies the limit on BERTOT , is larger than the equivalent power Peq obtained from amplitude distribution (with permitted Abud for this K), as can be seen in Fig. 10b. More precisely, if AD-LA, distributing the mean constellation amplitudes hAi and modulation formats M , renders (hAn i, Mn ) on each particular subcarrier n, the total equivalent signal power is Peq =
N −1 X
f (Mn )hAn i2 .
(21)
n=1
In Fig. 10b, these equivalent total powers are depicted by dashed red plots, presenting the power of the signal when the LA with amplitude distribution is used and compared to the permitted Pbud which results from the condition on BERTOT when the PD-LA is used (blue solid plots). It can be seen that for these channels Pbud > Peq . This can be explained by the fact that in the system considered, once clipping is permitted, apart from maximal DC value, the limit on BERTOT is the only constraint. Since the limit on the BER indirectly poses the limit on the signal power (rather than amplitude), it can be expected that the PD-LA maximizes the rate. The AD-LA achieves lower rates because it complies with an additional constraint on the sum of amplitudes. Moreover, the equivalent sum of amplitudes obtained from the results of the PD-LA with
208
JOURNAL OF NETWORKS, VOL. 5, NO. 2, FEBRUARY 2010
(than the AD-LA) which can then have larger powers (or amplitudes) for the same BER limit (by the sum of more sinusoids, there is a smaller clipping probability). For channels where both PD-LA and AD-LA activate all subcarriers, their performance is quite similar, with Aeq ≈Abud and Peq ≈Pbud .
amplitude distrib. (AD-LA) power distrib. (PD-LA)
bits/OFDM symbol
2
10
BERLA=10-3 BERTOT≤2·10-3
BERLA=10-5 BERTOT≤2·10-5
D. Capacity Estimate by Water-Filling 1
10
a -9
-6
0
3
6 9 K [dB]
12
15
18
21
24
PTOT = Peq (AD-LA) PTOT = Pbud (PD-LA)
0.3 2PTOT/DC2
-3
BERLA=10-3 BERTOT≤2·10-3
0.25 0.2 0.15 0.1
0.05 -9
BERLA=10-5 BERTOT≤2·10-5
b -6
-3
0
3
6 9 K [dB]
12
15
18
21
24
ATOT = Abud (AD-LA)
5
ATOT = Aeq (PD-LA)
2ATOT /DC
4
BERLA=10-3 BERTOT≤2·10-3
3
BERLA=10-5 BERTOT≤2·10-5
2 1
c 0 -9
-6
-3
0
3
6 9 K [dB]
12
15
18
21
24
Figure 10. Comparison of the (a) achievable rates, (b) total signal modulating power and (c) sum of amplitudes where the loading algorithms with amplitude distribution (red plots) and with power distribution (blue plots) are implemented and clipping is enforced. N = 64 and DC= 400 mW are assumed.
maximal Pbud as Aeq =
N −1 X
s
n=1
Pn f (Mn )
(22)
well exceeds the maximal Abud permitted as the sum of amplitudes under the same BER condition. This is shown in Fig. 10c which compares the maximum permitted amplitude budgets (red solid plots) and the equivalent sum of amplitudes resulting from the corresponding power budgets from Fig. 10b (blue dashed plots). This means that the advantage in rate is accomplished by disregarding the sum of amplitudes. Nevertheless, having such an additional constraint may be necessary if the crest-factor or amount of clipping is of interest; this can be particularly important if asymmetric clipping is considered in the system. According to the result of the simulations, the difference in rate for K-factors up to about 15 dB is due to the fact that the PD-LA results in more active subcarriers © 2010 ACADEMY PUBLISHER
The previous investigations showed the rates achievable when square-QAM modulations are used on condition that a certain error rate is not exceeded. The overall best rate performance was seen with the conventional LA when the total signal (AC) power was chosen so that the number of errors due to background noise and due to clipping is of the same order of magnitude. In conventional coherent systems, maximum rates obtained by an LA are upper bounded by the system capacity obtained by the water-filling (WF) solution. The following figures present a similar comparison in the optical wireless system considered. Figure 11a shows the rates already introduced in Fig. 10a for BERTOT ≤ 2 · 10−3 and BERTOT ≤ 2 · 10−5 in case of symmetric clipping (solid plots). The two dashed plots represent the capacity estimate obtained by the classical waterfilling solution where the corresponding Pbud as found in Fig. 10b is taken for each channel realization. There are two capacity plots because the power budgets permitted for BERTOT ≤ 2 · 10−3 are larger than for BERTOT ≤ 2 · 10−5 . Figure 11a shows the capacity estimates significantly above the achieved transmission rate curves. This is because the WF solution assumes a sum of Gaussian distributions which superimpose in front of the optical source and result in a Gaussian distribution N (DC, Pbud ). The ratios between √ standard deviation and mean value of this distribution Pbud /DC are presented in Fig. 11b (left y-axis). As symmetric clipping is considered (at levels of 0 and 2DC), these ratios correspond to equivalent clipping probabilities of several per mill to several percent (on both sides together). Once all the subcarriers are active, a further increase of the K-factor results in a smaller AC power increase with respect to DC, leading to a decrease of the permitted clipping probabilities for the same final BER. The WF solution provides optimistic capacity estimates (especially for lower K-factors) since it assumes transmission through a channel without loss of energy due to clipping. It can be said that WF results in an upper bound on the achievable rates of a system based on discrete square-QAM which is tighter as the clipping probability decreases. From a practical point of view, the WF estimate can be used for upper bounding the capacity of OFDM-based systems when such relatively low clipping probabilities are considered. E. Implementation of Power Control It is obvious that in order to maximize the transmission rate, the system must recognize the channel state and adaptively set the permitted Pbud . Some form of power
JOURNAL OF NETWORKS, VOL. 5, NO. 2, FEBRUARY 2010
3
REF. LA
10
Transmission rate [Mbit/s]
a Capacity estimate by watter-filling
2
10
Conventional LA with power distribution
BERTOT ≤ 2 ⋅ 10
-9
-3
BERTOT ≤ 2 ⋅ 10-5
1
10
-6
-3
0
3
6 9 K [dB]
12
15
18
21
24
0.6 0.03 0.02 0.5
bud
P1/2 /DC
0.01
0.4
BERTOT ≤ 2 ⋅ 10-3
Equivalent clipping probability, ρ
b
BERTOT ≤ 2 ⋅ 10-5 0.3 -9
209
-6
-3
0
3
6
9
12
15
18
21
24
K [dB]
Figure 11. (a) Achievable rates against capacity estimate provided by water-filling for the same signal power, (b) The ratio between signal standard deviation and mean value (left y-axis) and the corresponding symmetric clipping probability (right y-axis) of the equivalent Gaussian distribution considered by the water-filling estimate. Assumed N = 64 and DC= 400 mW.
control algorithm is hence needed. One possibility would be to use an LUT which would consist of the permitted Pbud values for all relevant channel realizations and BERTOT targets. Each time the LA is performed, it is then carried out in 2 steps: 1) Reference loading is performed where a fixed Pbud,ref . Pbud,ref is chosen to render a different number of subcarriers used, or a different total number of bits, which they carry for each channel realization; this virtual loading is hence an indicator of the present channel state. 2) The actual Pbud is extracted from the LUT (for the channel state found in step 1) and the LA is performed again to provide the parameters for transmission. An example is shown in Fig. 12. Such implementation does not depend on the number of subcarriers, and only requires that the execution time of the loading algorithm be doubled (since it needs to be performed twice) which is not an issue in the channel considered. F. Summary of Main Results Finally, Fig. 13 presents the improvement of transmission rates which can be achieved by designing the system © 2010 ACADEMY PUBLISHER
LOOK-UP-TABLE (N=64, DC=0.4)
N=64, N=64, DC=0.4 DC=0.4 BERref = 10-3 ref=1e-3 P = 0.6 Pbud,ref bud,ref=0.6 RTOT Rtot
K [dB]
BERTOT,1≤


![[PDF] Optical Signal Processing Epub - Google Sites](https://m.moam.info/img/260x300/pdf-optical-signal-processing-epub-google-sites_6477b454097c474b228c5f9b.jpg)