Mar 19, 2006 - We collect and develop a set of benchmarks using trace monitoring ...... as a trace monitor: we look for a getConnection event with a given URL, ...
The abc Group
Efficient Trace Monitoring abc Technical Report No. abc-2006-1
1
Pavel Avgustinov1 , Julian Tibble1 , Eric Bodden2 , Ondˇrej Lhot´ak3 , Laurie Hendren2 , Oege de Moor1 , Neil Ongkingco1 , Ganesh Sittampalam1 Programming Tools Group 2 Sable Research Group 3 Programming Languages Group University of Oxford McGill University University of Waterloo
March 19, 2006
aspectbench. org
Contents 1 INTRODUCTION
3
2 SYSTEMS 2.1 Tracematches . 2.2 PQL . . . . . . 2.3 J-LO . . . . . . 2.4 AspectJ . . . . 2.5 Other systems .
5 5 6 7 7 8
. . . . .
. . . . .
. . . . .
. . . . .
. . . . .
. . . . .
. . . . .
. . . . .
. . . . .
. . . . .
. . . . .
. . . . .
. . . . .
. . . . .
. . . . .
. . . . .
. . . . .
. . . . .
. . . . .
. . . . .
. . . . .
. . . . .
. . . . .
. . . . .
. . . . .
. . . . .
. . . . .
. . . . .
. . . . .
. . . . .
. . . . .
. . . . .
. . . . .
. . . . .
. . . . .
. . . . .
. . . . .
. . . . .
. . . . .
. . . . .
. . . . .
. . . . .
. . . . .
. . . . .
3 GENERAL CHALLENGES
9
4 LEAK AND INDEX CHALLENGES
13
5 SPECIFICATION LANGUAGE CHALLENGES 5.1 Cost of filtering . . . . . . . . . 5.2 Context-free patterns . . . . . . 5.2.1 thisJoinPoint binding . 5.2.2 Efficiency improvements
. . . .
16 17 18 18 18
. . . . .
20 20 22 23 24 25
6 TECHNIQUES 6.1 State machine . . . . . . . . . 6.2 Representing partial matches 6.3 Specialising to the pattern . . 6.4 Detecting and avoiding leaks 6.5 Indexing . . . . . . . . . . . .
. . . . .
. . . .
. . . . .
. . . .
. . . . .
. . . .
. . . . .
. . . .
. . . . .
. . . .
. . . . .
. . . .
. . . . .
. . . .
. . . . .
. . . .
. . . . .
. . . .
. . . . .
. . . .
. . . . .
. . . .
. . . . .
. . . .
. . . . .
. . . .
. . . . .
. . . .
. . . . .
. . . .
. . . . .
. . . .
. . . . .
. . . .
. . . . .
. . . .
. . . . .
. . . .
. . . . .
. . . .
. . . . .
. . . .
. . . . .
. . . .
. . . . .
. . . .
. . . . .
. . . .
. . . . .
. . . .
. . . . .
. . . .
. . . . .
. . . .
. . . . .
. . . .
. . . . .
. . . .
. . . . .
. . . .
. . . . .
. . . .
. . . . .
. . . .
. . . . .
. . . .
. . . . .
. . . .
. . . . .
7 FUTURE WORK 28 7.1 Intertype Declarations (ITDs) . . . . . . . . . . . . . . . . . . . . . . . . . . . . . . . . . . . . 28 7.2 Singleton Bindings . . . . . . . . . . . . . . . . . . . . . . . . . . . . . . . . . . . . . . . . . . 28 7.3 Static Match Analysis . . . . . . . . . . . . . . . . . . . . . . . . . . . . . . . . . . . . . . . . 29 8 CONCLUSIONS
30
1
List of Figures 1 2 3 4 5
6 7 8
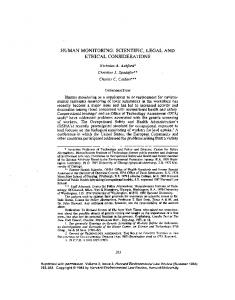
Tracematch for unsafe enumerators. . . . . . . . . . . . . . . . . . . . . . . . . . . . . . . . . PQL for unsafe enumerators. . . . . . . . . . . . . . . . . . . . . . . . . . . . . . . . . . . . . J-LO for unsafe enumerators. . . . . . . . . . . . . . . . . . . . . . . . . . . . . . . . . . . . . Runtimes for SafeEnum. . . . . . . . . . . . . . . . . . . . . . . . . . . . . . . . . . . . . . . Memory usage for SafeEnum (moving average to show trends). Some benchmarks omitted to avoid cluttering the graph; the missing benchmarks have almost identical memory usage to the bottom line (TM), exhibiting no memory leaks. . . . . . . . . . . . . . . . . . . . . . . . . Tracematch for LUInMeth. . . . . . . . . . . . . . . . . . . . . . . . . . . . . . . . . . . . . . Automaton for the pattern r p q. . . . . . . . . . . . . . . . . . . . . . . . . . . . . . . . . . An example of how patching works when an event has just occured which matches a symbol with the constraint (x = o2 ) ∧ (z = o5 ) . . . . . . . . . . . . . . . . . . . . . . . . . . . . . . .
2
6 6 7 11
11 19 21 27
Abstract A trace monitor observes the sequence of actions in a software system, and when it detects that this sequence matches a given pattern, it executes some extra code of its own. Trace monitors are often specified declaratively using patterns based on regular expressions, context free grammars or logical formulae, and then the trace monitor implementation is generated from the specification. Trace monitors are particularly useful for runtime verification, and many variations have been proposed. Despite this intense interest, there have been hardly any systems that implement the idea in its full generality, because it is hard to generate efficient code from a purely declarative statement of the pattern. This paper identifies and addresses the challenges faced in generating efficient trace monitors from declarative pattern-based specifications. We present the first set of benchmarks and experiments to identify these implementation challenges which include: (1) careful generation of the automaton for recognising the pattern, (2) specialising the generated code to the pattern being recognised, (3) avoiding memory leaks and (4) quickly locating relevant partial matches. We also examine the impact of the choice of specification formalism on performance. Based on our experimental observations we present several novel techniques that address these challenges, purely through a careful analysis of the monitor specification. Our techniques do not require a whole-program analysis of the base program that is being monitored. All of our techniques have been implemented in abc, an extensible compiler for the AspectJ language, which is itself an extension of Java. Their applicability is by no means restricted to this setup, however, and we argue that they can be used to improve any trace monitoring system. Both the benchmarks and the implementation are publicly available.
1
INTRODUCTION
Any substantial software system involves some monitoring code, for instance to check a system-wide invariant or to measure the frequency of certain types of event. In this paper, we focus on trace monitors, which observe the current execution trace, and execute some extra code when the trace matches a given pattern. A typical example is incorrect use of an enumerator, where the underlying collection is modified while iteration is in progress. A trace monitor is usually specified declaratively in two parts: firstly, a pattern describing which traces should match, and secondly, an action that should be executed when a program trace matches. The actual implementation of a trace monitor is automatically generated from its specification. There is a very large amount of previous research on this topic, e.g. [4, 10, 12, 13, 15, 17, 19–23, 25, 27, 32, 35, 38, 41, 43]. These studies range from applications in medical image generation through business rules to theoretical investigations of the underlying calculus. The way the patterns are specified varies, and temporal logic, regular expressions and context-free languages all have been considered. One theme shines through all of these previous works: trace monitors are an attractive, useful notion, worthy of integration into a mainstream programming language. This has not happened, however, because it turns out to be very difficult to generate efficient code when the trace monitor is phrased as a declarative specification. The objective of this paper is to examine a wide variety of existing trace monitoring systems in order to identify the challenges faced in generating efficient code and to provide a set of techniques that can be applied to these challenges. There have been some previous attempts to improve efficiency via complex whole-program analyses (in particular in [35]), applied to the program that is being monitored. Such analyses are however not always feasible, and they could lead to brittle performance where a small local change can hugely impact the efficiency of the system. In contrast, our techniques rely on analysing only the monitor specification and on careful generation of the automaton for recognising the pattern. Our general approach has been to study existing systems and to develop a wide range of trace monitor benchmarks for those systems which are publicly available. By studying and comparing the systems, we showed that efficiency, both in terms of memory and time, is a large problem and we identified several general challenges for improving performance.
3
In order to improve the efficiency of generated trace monitor implementations we then developed a collection of techniques and implemented these in the context of the design of tracematches, which are now distributed with abc [3], an extensible compiler for AspectJ. We report on these techniques, which should also be applicable to other trace monitoring systems. Thus, our main contributions in this paper include: • We study existing trace monitor systems, pulling together closely related developments in aspectoriented programming, program analysis and runtime verification. • We collect and develop a set of benchmarks using trace monitoring [2], which we then use to carefully examine the reasons why implementing trace monitors is hard. • Through these experiments we identify six challenges that are important for a trace monitoring system to have acceptable performance (i.e. within an order of magnitude of the same program instrumented by hand): 1. Careful generation of an automaton for recognising the pattern. 2. An appropriate representation for partial matches that involve variable bindings. 3. A data structure for manipulating sets of such partial matches. 4. Detecting and preventing potential space leaks due to the matching process. 5. Balancing the expressive power in the pattern language with efficiency. 6. Predicting statically when a single-event match must lead or cannot lead to a matching trace. • We present novel solutions to Challenges 1, 2, 3, and 4 above; our experiments show that these solutions suffice to attain our goal of acceptable performance. For Challenges 5 and 6, we outline possible approaches that we have not yet evaluated. The paper is organised in three parts. The first part describes the background. We start with a survey of the field. In Section 2, we present the trace monitor systems we have studied, through one particular case study. We provide a summary of all systems and more detailed descriptions for those systems that were publicly available and suitable for our experiments. The second part of the paper concerns experiments to articulate and investigate the challenges involved in generating efficient trace monitors from specifications. In Section 3 we apply all systems to a single benchmark problem, making a detailed comparison. As the results will show, only two of the systems really seem to be of practical use at the moment, namely that presented in [35] and our own. Hence we conduct further experiments with those systems only. From these initial experiments in Section 3, we also deduce the six challenges listed above. Two of them (3 – organising partial matches and 4 – space leaks) clearly require deeper investigation, and that is the purpose of the experiments in Section 4. Here we apply eight different trace monitors to highly non-trivial base programs. Furthermore, we assess the effect of different optimisations and code generation strategies. In Section 5 we zoom in on Challenge 5 (balancing expressiveness and efficiency). To that end, we perform a set of experiments in order to compare different styles of pattern specification, and their effect on runtime performance. This completes our investigation of the six challenges. The third part of the paper presents novel solutions to the challenges. Section 6 shows how our implementation meets the most important of those challenges. Throughout this section, we take pains to point out how the same ideas apply to other monitoring systems. Our aim in this paper is to obtain an efficient implementation without a costly analysis of the program that is being monitored. It is natural to ask, however, whether there is further scope for improvements if advanced analyses were brought to bear on the problem. This is discussed, along with related work on techniques for making trace monitoring feasible, in Future Work (Section 7). Finally, we conclude in Section 8.
4
2
SYSTEMS
There are many proposals for systems that generate trace monitors from specifications. In this section, we shall introduce a few of them in detail, with reference to a single example, to give the reader a thorough understanding of the type of specification involved. Because we wished the techniques presented in this paper to be generally applicable, we were careful to start with a comparison of the widest possible variety of systems. In particular we discuss a representative system from the aspect-oriented programming community (tracematches), a system from the program analysis community (PQL), and also a system from the runtime verification community (J-LO). The fact that these three distinct research communities have all converged on the same concepts is strong evidence of their importance. We then go on to provide an overview of other similar systems, analysing their strengths and weaknesses. Safe enumeration Before proceeding to the description of systems for generating trace monitors, we introduce the example that we shall use to illustrate each of those systems. Consider the problem of checking whether an enumerator is used safely, with no modifications to the underlying collection while an enumeration is in progress. To wit, we want to catch the situation where the collection is updated, and yet a further step is made in the enumeration. While implementations of the newer java.util.Iterator interface are expected to include such instrumentation, this is not the case for the less modern java.util.Enumeration. So our aim is to write a monitor specification that checks this externally, in particular for the use of Enumeration over the Vector class. We chose this example because it can be expressed by all of the systems we examine. An example of a substantial piece of code that uses enumerations over vectors is the popular open source drawing program JHotDraw. As it happens, JHotDraw does contain such an unsafe use, which can be exposed by editing a drawing while an animation of that drawing is running. In summary, these are the rules of the game: we are interested in implementing a trace monitor for detecting unsafe uses of enumerations in JHotDraw, without modifying the source of JHotDraw, and of course also not changing the implementation of Vector.
2.1
Tracematches
Figure 1 shows the specification for such a monitor, expressed with a language feature called tracematches that we proposed ourselves in [4]. Tracematches form a small extension of the AspectJ language [7]. First we define a pointcut that describes all the different ways one may update the state of a vector (Lines 1-5). The definition of the tracematch itself follows. It consists of three parts: a declaration of all the events of interest (the symbols, Lines 8-13), a regular expression pattern (Line 15), and code to execute when the current trace matches the pattern (Line 17). There are two variables declared in the tracematch (Line 7), namely ds (for data source) and e (for enumeration). These variables are bound by the matching process. There are three symbols to consider: the creation of a new enumeration e over a given data source ds, the ‘next element’ operation on that same enumeration e, and updates of the underlying collection ds. Each symbol has a ‘before’ or ‘after’ annotation, to indicate whether we wish to match the beginning of a call or its end. As normal AspectJ pointcuts, symbols may generally also match other events besides calls, such as field accesses or exception handlers. The regular pattern says that we see an enumeration creation, potentially followed by some enumeration steps, then one or more updates of the vector and finally, an offending enumeration step. All these symbols have to match a suffix of the current trace with the same bindings for ds and e. Our semantics state that for each possible binding of ds and e, we project the current trace onto the events of interest (we call this process filtering), and then match the pattern to each suffix of that filtered trace. This filtering semantics of matching is shared with similar language features in the aspect-oriented programming community. The runtime verification community generally favours a quite different ‘skipping’ semantics, described below. The extra code to execute upon a match is not very interesting here; we just throw the appropriate exception. In general, however, it is permitted to refer to variables bound in the symbols. For example, one 5
1 2 3 4 5
pointcut vector update() : call(∗ Vector.add ∗(..)) || call(∗ Vector. clear ()) || call(∗ Vector.insertElementAt(..)) || call(∗ Vector.remove∗(..)) || call(∗ Vector. retainAll (..)) || call(∗ Vector.set ∗(..));
6 7 8 9 10 11 12 13
tracematch(Vector ds, Enumeration e) { sym create enum after returning(e) : call(Enumeration+.new(..)) && args(ds); sym call next before : call(Object Enumeration.nextElement()) && target(e); sym update source after : vector update() && target(ds);
14
create enum call next∗ update source+ call next { throw new ConcurrentModificationException(); }
15 16 17 18 19
}
Figure 1: Tracematch for unsafe enumerators. might wish to bind the source location where the first update occurred, and then report that as part of the exception to make it easier to track down the problem.
2.2
PQL
The Program Query Language (PQL) of Michael Martin et al. [35] is in many respects similar to tracematches. A specification for the same trace monitor in PQL is shown in Figure 2. Just like the tracematch, it binds two free variables, one for the datasource ds and another for the enumeration e. 1 2 3 4 5 6 7 8 9 10 11
query main () uses object java. util .Vector ds; object java. util .Enumeration e; matches { e = new Enumeration(ds); { ds.add ∗(...) | ds. clear (...) | ds.insertElementAt (...) | ds.remove∗(...) | ds. retainAll (...) | ds.set ∗(...); } e.nextElement(); }
Figure 2: PQL for unsafe enumerators. The pattern looks somewhat different, however. Here we just specify a sequence of three events: creation (Line 6), update (Lines 7-9), ‘next’ step (Line 10). When matching against a trace PQL can freely ignore any event that occurred in between these. That contrasts with tracematches, where a declared symbol can never be skipped. PQL matches against all possible subsequences of the current trace, whereas tracematches match against the projection of the trace to the declared symbols. It would therefore perhaps be a more accurate comparison to write the PQL pattern as follows: e = new Enumeration(ds); { ds.add ∗(...) | ds. clear (...) | ds.insertElementAt (...)
6
| ds.remove ∗(...) | ds. retainAll (...) | ds.set ∗(...); } ˜e.nextElement(); e.nextElement();
Here ˜X stands for the negation of an event X: it matches any sequence in which X does not occur. In the above pattern, there should be no ‘next’ steps between the update and the ‘next’ operation that we match. In the tracematch that requirement is implicit, and even if we did not throw an exception in its body, it would only match the first ‘next’ operation and not subsequent ones. Another difference between PQL and tracematches is that PQL is a stand-alone tool rather than a programming language feature, while tracematches are tightly integrated with the AspectJ language.
2.3
J-LO
Bodden and Stolz have also proposed an extension of the AspectJ language, the Java Logical Observer (JLO), with a semantics that is close to PQL [13, 38]. The way patterns are specified in J-LO is however quite different from PQL: it uses Linear Temporal Logic (LTL), a popular formalism in the verification community. A J-LO specification of the unsafe enumeration observer is shown in Figure 3. The logic formula actually expresses what it means for an enumeration to be safe: the tool will report a violation of the declared property if that formula is falsified by the current trace. 1 2 3 4 5 6 7 8 9 10 11
Vector ds, Enumeration e: G(( exit(call(Enumeration+.new(..)) && args(ds)) returning e ) →( G(( entry(vector update()) && target(ds)) ) →( G(!( entry(call(Object Enumeration.nextElement()) && target(e)) ))))))
Figure 3: J-LO for unsafe enumerators. Let us examine the formula more closely. It states that whenever we see the creation of an Enumeration e over a Vector ds (Line 3) it follows (Line 4) that whenever an update of ds occurs (Line 6), after that update there is no (Line 8) occurrence of the nextElement operation (Lines 9-10). To wit, the shape of the formula in Figure 3 is G(create → G(update → G(!next)))
That says: henceforth, a ‘create’ event implies that henceforth when we see an ‘update’ event, henceforth ‘next’ does not happen.
2.4
AspectJ
In our experiments, we shall always include numbers for the uninstrumented code in pure Java, to see how much the additional cost of observing is. It is however also interesting to have a gold standard for the efficiency of implementing the observer itself. For several of our applications it is not practical to do the instrumentation by hand, due to the size of the base program. Therefore, we shall provide alternative implementations using the AspectJ language. AspectJ only allows one to intercept a single event at a time, so the process of matching a trace has to be coded by hand.
7
For the unsafe enumeration example, a simple aspect might keep several identity hash maps: one to track the state of each data source (using a modification counter), another to retrieve the data source corresponding to an enumeration, and finally one to remember the state of the data source upon the creation of an enumeration. Those three hash maps should store only weak references, since otherwise memory leaks would occur. It is also possible, however, to use aspects to do exactly what a good programmer would do by hand: store the modification counter as a field on the vector class, and on the enumeration class introduce two fields for saving that counter and for retrieving the corresponding datasource. This strategy reflects the one used internally in the JDK in order to ensure the correct use of implementations of the more modern Iterator interface. That requires one to know, however, that all vectors in JHotDraw are allocated in user code, so that we can replace those vector constructor calls with constructors for a special subclass (which contains the additional fields). Thus, this optimisation requires a full analysis of the base program. As we remarked earlier, it is useful to have this type of non-trivial implementation as a ‘gold standard’ in our benchmarks, so we have a clear idea of what the best possible performance might be. In what follows, we shall often employ the terminology of aspect-oriented programming, especially when discussing implementation issues. A pattern for describing a set of events is called a pointcut. The events that can be described in this way are composite, for instance method calls can be nested inside each other; these composite events are named joinpoints. A piece of advice consists of a pointcut plus some extra code to execute, before, after or around (that is instead of) joinpoints picked out by the pointcut. Advice conceptually intercepts joinpoints at runtime, but a good compiler will attempt to do the matching of pointcuts to joinpoints at compile-time [36]. It identifies regions of code that can give rise to joinpoints at runtime: these regions are called shadows. As pointcuts can examine runtime information (such as the presence of a particular method on the call stack), it is not always possible to do all joinpoint matching at the level of shadows. In those cases, the compiler inserts a residue (i.e. a dynamic test) to complete the matching at runtime.
variables
filtering
context-free
semantics
leak busting
indexing
specialisation
static match
availability
Implementation
integration
Patterns
functionality
tracematches [4] PQL [35] J-LO [38] AspectJ [7] tracecuts [43] PTQL [27] HAWK [17] Alpha [12] Arachne [25]
Purpose fault finding
System
± + + ± + + ± ±
+ + + + +
+ + + + +
+ + + + + + -
+ + + +
+ + + + + -
+ + -
+ -
+ -
+ -
+ + -
+ + + + + +
Table I: Systems for trace monitoring.
2.5
Other systems
There are many other proposals for systems that generate trace monitors from specifications, but hardly any are available for experimentation. Table I provides a very brief survey of these proposals; it leaves out works like [20, 32], which are more concerned with the design of a calculus than a practical implementation. It also leaves out JAsCo [41], which is much less declarative than the other systems, and so many of the
8
issues we wish to compare do not arise. The table is arranged in five sections: purpose, integration, patterns, implementation and availability. We examine each of these in turn. Purpose We distinguish between systems whose primary purpose is finding faults, and systems that have extensive facilities for adding new functionality whenever a match occurs. Integration This refers to integration in a mainstream programming language. Almost all systems that provide it in our table are extensions of AspectJ, and AspectJ itself is integrated with Java. The only exception is Arachne, which is integrated with C. The systems that are not integrated with a language are stand-alone tools. Patterns In some systems, one can bind free variables via the pattern matching process. When available, this feature greatly simplifies writing patterns that track the behaviour of individual object instances. It is very hard to implement such variable binding efficiently, however. Tracematches and Alpha are the only systems that provide a filtering semantics in conjunction with free variables. The filtering semantics are also shared with the tracecuts of Walker et al. and Arachne. The other systems stem from the runtime verification community, and they follow the liberal ‘skipping’ semantics of PQL. Several systems provide extremely powerful pattern languages, which allow the expression of context-free properties. One aim of the present paper is to evaluate these design choices with reference to runtime performance. Implementation Tracematches and J-LO are the only systems where the implementation is carefully justified via an equivalence between a declarative and an operational semantics. In our experience, this is not an academic luxury, as we found it impossible to get the implementation right without a formal model. Leak busting, indexing and specialisation are among the challenges identified in the next section, so we defer their discussion until later. The static match column indicates whether (in some cases) the system is able to do all the matching at compile-time. This issue will be discussed further in Section 7. The paper that introduced PQL [35] stressed its use of static analyses to improve performance, but the publicly available implementation of PQL does not do any of these analyses. So while we have given it a ‘+’ in the static match column, that does not apply to the version available for our experiments. Availability Unfortunately not all of the systems described above have been released for general use. Of those that apply to Java programs, only tracematches, PQL, J-LO, and AspectJ were available to us: these will be evaluated in the next section. There is an implementation of tracecuts, but it is immature, and while its authors kindly gave us private access to their executables, they did not feel it was appropriate for us to use their prototype for the experiments in this paper. PTQL was constructed within IBM research, and it is not available to other researchers. HAWK is owned by Kestrel Technology, and due to licensing reasons it was impossible for us to run experiments. The author of HAWK, Klaus Havelund, kindly ran some experiments on our behalf, which indicated that its performance ranks considerably below those of the systems we benchmark here, due to excessive memory consumption. Alpha has been publicly released, but it operates on a small experimental toy language, so it is not possible to make a fair comparison to the other systems. Finally, Arachne is based on C and it is therefore also unsuitable for comparative performance experiments with Java systems.
3
GENERAL CHALLENGES
We aim to pinpoint what challenges must be met for a trace monitoring system to be efficient. The first exploratory step is to compare all four systems for which an implementation was available (tracematches, PQL, J-LO and AspectJ), applied to a single benchmark, namely SafeEnum. It applies the trace monitors which we presented in Section 2 to the popular JHotDraw drawing program [26]. JHotDraw consists of roughly 10 KSLOC of Java. One of its features is to turn a drawing into an animation, jiggling the drawing
9
components to achieve a visually pleasing effect. The use of enumerations in the animation feature is not safe, because one can edit the drawing while the animation is running. If we ran the animation as it stands, it would not be an interesting benchmark because there is a call to Thread.sleep to slow it down artificially, so that the drawing bounces around smoothly. We removed that call to properly expose the overheads, and ran the animation loop 100,000 times. To factor out unwanted costs for drawing on the display, we ran the benchmark with a local vnc server that is not actually connected to a display, with the window minimised. (Interestingly, there is a rather large performance difference between running the benchmark with a minimised or unminimised window even when the window is actually not rendered on the screen. It seems this is due to peculiarities in the Swing library.) Finally, we altered the animation to measure and print the memory usage every 100 iterations (i.e. animation steps). There are 11 different configurations of this benchmark, most of which were already discussed in Section 2. For ease of reference, we give them names, and take the opportunity of explaining a number of variations: None: No instrumentation, pure Java program. Tm: Tracematch version as given in Figure 1. TmNoLeakElim: Any trace monitor runs the risk of introducing space leaks by holding on to partial matches that have no chance of being completed. For that reason, our trace match implementation has a feature for detecting and often eliminating space leaks. In this version, we have turned off that feature, to measure its impact and determine its importance. TmNoIndex: An important issue in the implementation of trace monitors is the design of data structures for managing the set of all partial matches, which occur when a pattern has been partially matched but further events are needed to complete a match of the whole pattern. In the SafeEnum benchmark, such partial matches exist for all live enumeration objects at any point during program execution. The tracematch implementation provides quick access to partial matches via an indexing data structure (described in section 6.5). In this version of the benchmark, we have disabled that indexing data structure, using a straightforward list instead. TmNoFilter: The tracematch code, but with filtering turned off, so that events may be skipped just as they are in PQL. In general the result of turning off negative bindings in tracematches is nonsensical, but for this particular example it yields correct results, so it allows us to measure the overhead induced by filtering. Pql: PQL version as given in Figure 2. PqlNeg: PQL version with additional negation as discussed in Section 2. Jlo: J-LO version as given in Figure 3. AjNaive: Naive aspect using identity hash maps with strong references. AjNormal: Aspect using weak identity hash maps. AjGold: Complex aspect to achieve the same effect as a clever hand-coded solution — this is the gold standard for efficiency in this benchmark. AjItd: The result of systematically applying the ITD and singleton binding optimisations by hand to Tm, as will be described in Section 7. Unless otherwise indicated, all benchmarks were run on a dual Pentium Xeon 3.2GHz with 4GB of RAM, using Sun’s HotSpot JVM 1.4.2 02 and a maximum heap of 1.5GB (to minimise the necessity for forced garbage-collection runs). The run times (in seconds) are displayed on the log-scale barchart in Figure 4. The time for TMNoLeak and Jlo are missing from the chart, because they did not terminate in a reasonable time frame. For merely
10
Figure 4: Runtimes for SafeEnum.
Figure 5: Memory usage for SafeEnum (moving average to show trends). Some benchmarks omitted to avoid cluttering the graph; the missing benchmarks have almost identical memory usage to the bottom line (TM), exhibiting no memory leaks.
11
10K iterations, instead of the 100K iterations with the other configurations, TMNoLeak took 197 minutes and Jlo took 470 minutes. Not surprisingly, we find that AjGold and AjItd have the best performance. As has been noted already, those correspond to clever solutions of the monitoring concern and might be written by a good programmer, after significant consideration. AjNaive and AjNormal are almost on par with each other; the big difference is their memory behaviour. While AjNormal exhibits a slight upwards trend in Figure 5, AjNaive uses a linear amount of memory; objects bound by partial matches are never released. In particular, if this benchmark is run with the default JVM heap size, its runtime explodes, since garbage-collection runs are triggered very frequently. The performance number listed for AjNaive was in fact obtained by using a heap size of 1.5GB, significantly more than the maximum memory consumption. The tracematch variations have slightly longer runtimes again, though they are still well within an order of magnitude of AjNormal, which is our best implementation of the concern that doesn’t require an expensive whole-program analysis of the base program. It is instructive to note the memory usage here: the bottom line in Figure 5 corresponds to TM, and like the other TM variations (as well as AjGold, AjNaive and None, which have been omitted from the graph to avoid cluttering it) there is no upwards trend, indicating a non-leaking implementation of the trace monitor. Finally, the two longest runtimes correspond to Pql and PqlNeg. The reason for this poor performance becomes apparent upon inspection of the memory consumption: memory usage increases rapidly, and the benchmark cannot complete with the standard VM heap size without throwing an OutOfMemoryError. The two lines almost coincide in the graph, showing a linear growth in the memory footprint. This behaviour is due to partial matches and bound objects not being freed when they are no longer needed, and illustrates the general need for leak elimination techniques. The reason PqlNeg takes almost twice as long as Pql is briefly discussed in section 6.1. Finally, note the topmost line in Figure 5: TMNoLeak, representing our tracematch implementation with space leak elimination turned off. As we see, the memory behaviour is terrible, and in fact the benchmark was actually infeasible to complete in a reasonable amount of time, which is why the data series is incomplete. This serves to illustrate the effectiveness of our leak analyses — we are able to optimise this atrocious memory behaviour in such a way that there is no upwards trend at all. We now deduce some general challenges for implementing trace monitoring concerns from these experiments. Challenges Not surprisingly, a crucial challenge concerns the representation of the state machine for matching. This is illustrated by the poor performance of J-LO, which runs a state machine interpreter at runtime, whereas the tracematch implementation generates specialised matching code based on a given state machine. The fact that PQLNeg does worse than PQL can also be traced back to a poor representation of the former state machine. This, then, is our first challenge: Challenge 1 (State machine) Represent the state machine for matching. As said, this is not an easy task. A closely intertwined challenge is the representation of partial matches that involve variable bindings (some representation of those bindings plus a notion of ‘current state’ to indicate how much of the pattern has been matched so far). In PQL, that informal intuition is implemented quite literally and in TM, we choose a slightly more complex scheme via constraints attached to states. Both are responses to our next challenge: Challenge 2 (Partial matches) Represent partial matches that involve bindings of variables. Apart from choosing a representation of individual partial matches, we also need to decide how the complete collection of partial matches is arranged. The slowness of TMNoIndex (130s) as compared to TM (96s) indicates the importance of building an appropriate data structure for quickly accessing members 12
of the set of partial matches. In the next section we shall in fact see that it is not only important, but indispensible on some benchmarks. Challenge 3 (Match sets) Design an appropriate data structure for sets of partial matches. Taking memory measurements sheds some light on the reason why TMNoLeak, PQL, PQLNeg, and AJNaive (the latter is actually significantly slower than AjNormal unless it is provided with a very large heap) perform so poorly: all of them exhibit memory leaks. This is illustrated in Figure 5. Indeed, it is no surprise that trace monitors easily lead to memory leaks — even a naively written aspect suffers from that problem. It is important, therefore, that a system for generating monitors tries to avoid creating such leaks, and if it cannot do so, that the user is presented with a warning: Challenge 4 (Space leaks) Detect and prevent potential space leaks. It is interesting to note that J-LO does not produce any space leaks. Above we mentioned that it employs a generic state machine interpreter at runtime, instead of specialising the generated matching code to the pattern in hand. By doing that it can actually avoid space leaks simply by keeping track of the remaining variables in “the rest of the formula yet to match”. It thus achieves at interpreter level what tracematches do via an analysis at code generation time; see section 6.4 for details. While the above challenges are clearly universal, there might be others that relate to particular ways of specifying the trace pattern. For instance, the differences between TM and TMNoFilter indicate that in tracematches, our notion of filtering the trace with declared symbols may be expensive. Similarly the difference between PQL and PQLNeg shows that using the more restrictive pattern actually worsens the execution time. These highlight the importance of the next challenge: Challenge 5 (Expressiveness) Balance expressive power in the pattern language with efficiency. Finally, we would like to draw the reader’s attention to the fact that even AjNormal is still quite a lot less efficient than AjGold, so there is a lot of scope for further improvements in generating efficient code from the trace property specification, even going beyond the code a competent aspect programmer would write. Intuitively, it ought to be possible to analyse the paths taken in the program and see whether individual symbol matches (at a particular joinpoint shadow in the program text) can ever lead to a complete match for a trace. That leads us to formulate our last challenge: Challenge 6 (Static prediction) Predict statically when a symbol match must lead or cannot lead to a matching trace. In the remainder of this paper, we shall first seek to further articulate the most difficult of the above challenges through further benchmarks. Then we shall present our own solutions to some of these challenges. Finally, we discuss possible ways how the remaining challenges may be addressed in future work. Table II provides a roadmap.
4
LEAK AND INDEX CHALLENGES
Having identified the general challenges in generating efficient trace monitors from specifications, we now zoom in on two of them, namely Challenge 3 (Match sets) and Challenge 4 (Space leaks). We felt these need further investigation because the design space for addressing them is quite large, and therefore it is necessary to have a thorough understanding before diving into the details of a solution.
13
challenge 1. State machine 2. Partial matches 3. Match sets 4. Space leaks 5. Expressiveness 6. Static prediction
investigation 3 3 3, 4 3, 4 3, 5 3, 5
solution 6.1 6.2 6.5, 7.1, 7.2 6.4 7.3 7.3
Table II: Challenges, their investigation and solutions (section numbers). In particular, it is important that our understanding of these challenges and their relative importance is not skewed by considering only one kind of benchmark. Therefore, in this section we shall consider eight different trace monitoring properties, taken from a broad set of applications, with highly non-trivial base programs to monitor. For each of these properties, we wrote an AspectJ implementation as a baseline for efficiency comparisons. We furthermore compiled each tracematch with default settings (all optimisations enabled), and with leak detection and indexing disabled. Where it was possible, we also expressed the same property in PQL. PQL is however somewhat less expressive than tracematches, mostly due to the fact that it is not embedded in a full-blown programming language as tracematches are. For example, it is not possible to bind the current thread in PQL while matching a symbol; in tracematches, there is a general construct for binding such information. We did not include numbers for J-LO, due to the rather large overheads observed in the previous experiments. Below we present each of the trace monitors in our benchmarks, together with a short description of the base program(s) they have been applied to: NullTrack: The purpose of this monitor is to help track down the cause of a null pointer exception. That is, we look for locations where a field f (of a specific object o) is set to null, followed by a read of f (without an intervening assignment to f ), and then the occurrence of a null pointer exception. Of course there may be multiple null field reads that are all potential causes of the exception, so the monitor prints them all. We confirmed with the authors of [35] that this example cannot be expressed in PQL because there is no way of binding the signature of a field that is being read. Again, in our system there is a general construct for binding runtime information in patterns. It is quite challenging to implement this trace monitor efficiently, because it needs to instrument all field accesses in an application. We applied it to CertRevSim, a discrete event simulator used to simulate the performance of various certificate revocation schemes [6]. HashCode: A common flaw in programs that use hash sets is the insertion of an object, followed by a change to the object’s hashcode, followed by a membership test. Because the hashcode changed, the membership test may wrongly return a negative answer. We wrote a monitor to identify such problems, namely the trace pattern of an insertion of an object o into a set s, no removals of o from s, and then a lookup of o in s. The advice then checks whether the hashcode of o has changed since the insertion event. Again we confirmed with the authors of [35] that this example is not expressible in PQL. In this case, this is due to the fact that it is impossible to bind an object’s hash code, and so there is no way to detect a changed hash code. We chose a base program that makes intensive use of hash sets, namely AProVE. AProVE is a popular system for automated termination proofs of term rewrite systems [5]. It is a very substantial program of over 439 KSLOC. Because its source is not freely available to others, we applied our monitor directly to the compiled bytecode (our compiler can process both Java source and class files). Here and elsewhere in this paper, source sizes have been computed with the sloccount tool [44]. For this benchmark, we used the Sun HotSpot JVM version 1.5.0 06 with 1024MB heap on the same machine as stated in section 3.
14
Another base program for virtually the same trace monitor is Weka. The only difference here is that we tested on hash maps rather than sets because sets are not being used in Weka. Observer: Consider the well-known observer pattern: we create an observer o on a subject s, and then whenever s is changed, o needs to be updated as well. This is a nice, easy example of a trace monitor. We applied this encoding of the observer pattern to AJHotDraw, an aspect-oriented version of JHotDraw [40]. In the original AJHotDraw, updating of figure displays is done via standard Java listeners; we replaced the updating by an aspect, a tracematch and a PQL script implementing the observer pattern respectively. DBPooling: In his introductory textbook on aspect-oriented programming, Ramnivas Laddad demonstrates the use of aspects to implement database connection pooling [34]. This has a natural expression as a trace monitor: we look for a getConnection event with a given URL, then a releaseConnection, followed by a getConnection with the same URL. All releaseConnection events are intercepted to avoid having the connection released, and when the pattern matches, we return the connection that was obtained originally for the given url. Instead of using a realistic base program, we used a slightly modified version of the artificial example in Laddad’s book. Note that this actually magnifies the overheads due to trace monitors, as the base program does hardly anything else besides the monitored events. The AspectJ version we have benchmarked is Laddad’s. It appears this example is expressible in PQL in principle, but we were not able to make it work in practice, due to bugs in the PQL implementation; we have informed the PQL authors of these problems. LUInMeth: A common style rule is to require that any resource locked during a method invocation m is released during that same method invocation m. In [35], the authors of PQL propose this as an illustrative example for their system, and they present numbers for its performance. We decided to adopt it as a benchmark in this paper both to provide a fair comparison, and because the pattern features a well-bracketing property: method entry, lock, no unlock, method exit. At first sight, it might seem that such matching method entry and exit event pairs go beyond patterns that are expressible with regular expressions. It turns out, however, that the use of variable bindings makes the example expressible in tracematches, in a number of different ways. We shall look closely at these patterns and their ramifications for performance in Section 5.2 below. The base program chosen for this example is Jigsaw, the w3c’s leading-edge web server platform [42]. This is a fairly substantial application, of about 100 KSLOC. Jigsaw actually violates the style rule being checked, and our monitor catches that violation. Somewhat surprisingly, to apply PQL in this instance, we had to fix the released version of PQL, and the authors of PQL have now integrated that bug fix into their own code base. LOR: It is very hard to spot the possibility of deadlocks by mere testing, as their occurrence may depend on the way threads are scheduled. The Lock Order Reversal monitor (first discussed in [38]) spots situations where one thread acquires two locks in reverse order to another thread, and the two thread traces may be interleaved in such a way as to create a deadlock. As a pattern, it is interesting because we need to bind the current thread, and consider different interleavings of lock/unlock events. Binding the current thread is impossible in PQL. LOR was applied to Jigsaw, the same base program as the previous monitor. Interestingly, it turned out that Jigsaw produces a large number of matches to this pattern, i.e. there is some potential for deadlocks in the system. ReWeave: In this example, the base program is the abc compiler itself. In abc, we employ the following strategy for optimising aspect-oriented programs: first an aspect is woven naively. The result is pure Java bytecode, and so we can employ the analysis frameworks in Soot. The aspect is then unwoven (undoing the effect of the first weaving step), and we weave again, now using the analysis information gained earlier. This process is named reweaving; it can be iterated if so desired. A detailed description of reweaving can be found in [8]. 15
The unweaving step is a potential source of subtle bugs: it must be ensured that during unweaving, the system is completely returned to its original state. We have therefore written a trace monitor for checking that all fields are appropriately reset. There is an equivalent pure AspectJ version. The tracematch is very similar to that for NullTrack, and it cannot be expressed in PQL for the same reasons as in that example. Results are in Table III; a ⋆ indicates that the example is not expressible, and a − indicates the example is expressible, but bugs prevent it from running. Monitor NullTrack HashCode HashCode Observer DBPooling LUInMeth LOR ReWeave
Base CertRevSim AProVE Weka AJHotDraw Artificial JigSaw JigSaw Abc
KSLOC 1.4 438.7 9.9 21.1 90m 4.1s 61.9s 5.0s 21.9s 34.9s 9.1s
TMNoIndex 25.6s >90m 15.8s 39.7s 4.8s 20.9s 34.7s 9.0s
Table III: Run times in seconds. (⋆ indicates that the monitor cannot be expressed and − indicates that the correct implementation could not be generated) First we would like to comment on the general trend in these figures: for all these benchmarks, TM is usually within a small factor of the AspectJ equivalent, and never more than a factor of 9. This is strong evidence that we have identified all the important challenges in generating trace monitors from pattern specifications, and that the techniques presented later in this paper go a long way towards addressing those challenges. It is clear from the numbers that Challenge 3 (Match sets) is extraordinarily important. On the NullTrack benchmark, using an appropriate data structure for organising the set of partial matches yields a speedup of a factor of 6. For HashCode applied to AProVe, the situation is even more marked, as the execution becomes infeasible without indexing. The explanation is simple: without indexing, the monitor induces a cost at each hash operation that is proportional to the total number of live hash sets in the system. A good organisation of the set of partial matches is also beneficial for HashCode on Weka, and a little bit for ReWeave. It is noteworthy, however, that for the other benchmarks the set of partial matches is always small, and therefore storing it in a sophisticated datastructure induces an overhead. This is especially clear in the case of Observer. Further investigation revealed that in this example, the set of partial matches is in fact a singleton, and accessing a single element via several levels of indirection is expensive. Challenge 4 (Space leaks) is also well ilustrated by these numbers. Again HashCode on AProVe is infeasible with a system that does not carefully eliminate such leaks. This tallies with the earlier experiments in Section 3, where we found SafeEnum is intractable without an optimisation that addresses the challenge. Finally, note that the effects of such an optimisation are either negligible or hugely beneficial. The small overheads in some benchmarks such as Observer are caused by an extra level of indirection, namely the use of weak references.
5
SPECIFICATION LANGUAGE CHALLENGES
We now seek to further investigate Challenge 5 (Expressiveness). Having identified the primary challenges of implementing trace monitors efficiently, it is natural to return to the wide variety of systems we mentioned in Section 2. While all the systems described there share the same goals, they differ in the choice of
16
PQL ⋆ ⋆ ⋆ 82.0s − 15s ⋆ ⋆
specification formalism for describing trace patterns. What are the ramifications of the choice of formalism for performance? The first set of experiments focusses on the semantics of matching, pitting the definition that is prevalent in the aspect-oriented programming community against that used in runtime verification. The second question concerns the expressive power of the pattern language. Do we need the full power of context-free languages, and if so, what is the performance cost of using such non-regular patterns?
5.1
Cost of filtering
When we described the various systems in Section 2, we already indicated the two competing forms of matching: the skipping semantics from the runtime verification community, and the filtering semantics from aspect-oriented programming. Filtering has the advantage of a purely declarative description: we do not need to define the matching process in an operational manner. By contrast, the skipping semantics allows declared events to be ignored, but not while matching a negated pattern. The formal definition of the skipping semantics therefore inevitably requires some notion of operational semantics, changing the skipping behaviour when a negation is encountered. It appears harder to implement filtering efficiently, however, because it requires one to keep track not only of positive bindings (saying that a variable equals some object instance) but also of negative bindings (recording an inequality). To see the need for negative bindings, consider a pattern r p q where r binds no variables, while p and q bind the same variable x. Now suppose this is matched against a trace of events r; p(a); p(b); q(a); p(b); q(b) There are two filtered instances of this trace, namely for x = a (r; p(a); q(a); q(b) ) and for x = b (r; p(b); p(b); q(b)). Note that the last event is never filtered away (in particular we do not remove the last event q(b) from the x = a trace), as we wish matches to be triggered immediately when they occur, and not after some possibly irrelevant events have happened. The pattern matches neither of these filtered traces (it does match a prefix of the x = a trace). Now when we do the matching in an on-line fashion, on the basis of events as they appear in the trace, we must record whether it was decided to skip the first instance of p(b), because the same decision must be made for the second instance. The decision to skip p(b) is recorded as the inequality x 6= b. One way of making a performance comparison is to look at the performance of PQL (which uses the skipping semantics) versus that of tracematches (which uses the filtering semantics). However, because PQL has other performance deficiencies, that comparison is not conclusive. At best it tells us that the cost of maintaining negative bindings is not overwhelming. A more meaningful experiment is to provide the tracematch implementation with a switch to turn off the use of negative bindings. That changes the semantics from filtering to skipping. It does however only implement the skipping semantics of systems like PQL and J-LO when there is no use of negation in the pattern, because in those systems, skipping symbols while matching a negated pattern is not allowed. Two benchmarks fit the bill, therefore, namely SafeEnum and Observer. For SafeEnum, the tracematch pattern can be simplified to create enum update source call next
so that it becomes equivalent to the PQL pattern for this example. The results are shown in the table below: benchmark SafeEnum Observer
TM 98.0s 62.0s 17
TMNoFilter 69.3s 44.3s
We conclude that about 20% of the time taken by tracematches is due to the filtering semantics. While this is encouraging, we believe it would be worthwhile to do a more thorough study involving a full implementation of the skipping semantics, also for negated patterns, which takes advantage of all the findings in the present paper. We are currently working towards that goal.
5.2
Context-free patterns
Another major design issue concerns the expressive power of the patterns in trace monitors. The designers of PQL and tracecuts have opted for the full power of context-free languages, whereas tracematches and J-LO stay within the more restrictive realm of regular languages. Obviously regular languages are easier to analyse, so the main question is whether the additional expressive power of context-free languages is actually necessary. The principal argument for requiring non-regular patterns is a desire to identify well-bracketed events like entry and exit from a particular method call. The LUInMethod benchmark is a good example of a pattern where that is needed: a lock acquired during method invocation m must be released during that that same method invocation. It turns out, however, that this pattern is expressible with regular expressions, provided we make appropriate use of variable bindings. 5.2.1
thisJoinPoint binding
The first and most declarative way of doing so is to use the fact that AspectJ provides access to reflective information about the current event. In the AspectJ language, composite events like method executions are named joinpoints. The events are composite because they can be nested inside each other: one method execution may occur as part of another. AspectJ provides a primitive value named thisJoinPoint that uniquely identifies the current joinpoint; it provides access, for example, to the name of the method being executed, the arguments that were passed to it, and so on. For the entry into a composite event (a before symbol in tracematches) and for exit from the same event (an after symbol), the value of thisJoinPoint is the same. However, for recursive entries into an event (or recursive exits from it) there are distinct thisJoinPoint instances for each level. To expose that information in tracematches, we added a new primitive named let for binding arbitrary information (including the current joinpoint) to AspectJ. Since symbols are just AspectJ pointcuts (with a before/after annotation), we could use this in a symbol. It then becomes possible to say: entry into method m, bind the current joinpoint, exit from m, and the joinpoint for method entry and exit coincides. This yields precisely the well-bracketing information required. To illustrate, the tracematch for LUInMeth is shown in Figure 6. We first define a named pointcut for intercepting the execution of any method body, except those in the monitor itself (Lines 1–2). Next we define a pointcut named enclosingExec, which binds the immediately enclosing method execution of the current joinpoint (Lines 4–5). This is achieved via the primitive cflowbelow of AspectJ. Here it matches the enclosing method execution (with anyfunc()), and we bind the joinpoint of that method execution via let. The tracematch itself is declared with the perthread modifier (Line 7): it monitors traces of events within each thread separately. The tracematch defines four symbols. The first two beforefunc and afterfunc are for method entry and exit on the same joinpoint (Lines 8–11). The lock symbol intercepts calls to a resource locking method — and the immediately enclosing method execution again refers to the same joinpoint (Lines 12–13). Finally, unlock does the same for a resource unlocking method (Lines 14–15). When we see a method entry, followed by a lock, and then a method exit, but no intervening release of the lock, an error should be reported. 5.2.2
Efficiency improvements
Cognoscenti of AspectJ will recognise that while the code in Figure 6 is an elegant and direct expression of the required pattern, it might be inefficient for a number of reasons: it instruments all method calls,
18
1 2
pointcut anyfunc() : execution( ∗ ∗(..)) && !within(LUInMeth);
3 4 5
pointcut enclosingExec(JoinPoint jp) : cflowbelow(anyfunc() && let(jp,thisJoinPoint));
6 7 8 9 10 11 12 13 14 15
perthread tracematch(ResourceReference r, JoinPoint jp) { sym beforefunc before : anyfunc() && let(jp, thisJoinPoint); sym afterfunc after : anyfunc() && let(jp, thisJoinPoint); sym lock after : lock(r) && enclosingExec(jp); sym unlock after : unlock(r) && enclosingExec(jp);
16
beforefunc lock afterfunc { /∗ report error ∗/ }
17 18 19 20
}
Figure 6: Tracematch for LUInMeth. the construction of joinpoint objects could be costly, and the use of cflowbelow in conjunction with variable binding can be quite expensive. We examine each of these issues in some detail. First, all method calls are being instrumented, which seems unnecessarily expensive. Clearly only methods that contain a call to the locking method need to be monitored. A deep analysis of the above tracematch might be able to deduce that automatically, taking into account the meaning of complex features of AspectJ like cflowbelow. It turned out that on very large input programs such as Jigsaw, our compiler is unable to deal with the vast data structures that result from instrumenting every possible method call. For that reason, we added a new pointcut to AspectJ, namely contains(pc), which allows one to specify that only methods containing calls to the locking method need to be intercepted. In the jargon of aspect-oriented programming, contains(pc) matches shadows that contain a shadow matching the parameter pointcut pc; it is a generally useful addition to the AspectJ language, by no means restricted to this particular application. This version, where only relevant methods are instrumented, is the base tracematch version of LUInMeth shown in Table III. The equivalent AspectJ version of course also makes use of our new contains primitive. We shall compare these two against other variations of LUInMeth in Table IV. benchmark AspectJ TM TM-JPId TM-CFDepth TM-CFDepth-Full AspectJ-Full
time (s) 18.1 22.4 22.0 18.5 281.8 22.9
memory (MB) 0.9 2.8 2.8 1.0 1.1 0.9
Table IV: Variations of LUInMeth. Second, we already noted that thisJoinPoint refers to a complex object, including the method name, parameters, value of this, and so on. We only need its identity, however, and a good optimising compiler would be able to deduce that directly from the above code. To determine whether it is worth implementing such an analysis, we provided a special compiler switch that turns off the code generation for the contents of
19
joinpoint objects. This version is named TM-JPId. As shown in Table IV that yields a modest improvement in time but not in space — we conclude that the main overheads are in the use of cflowbelow and the concomitant maintenance of a stack at runtime. The third potential inefficiency concerns the use of cflowbelow, in particular as the argument pointcut binds a value. The implementation of this AspectJ feature requires the construction of a stack of bindings [31], and an analysis of its performance can be found in [8, 24]. A potentially cheaper solution is to achieve the desired well-bracketed matching by recording merely the depth of the stack. For this too, we need new pointcut primitives, namely cflowdepth(i, pc), which tells us the number i of enclosing joinpoints (including the current one) that match pc, and its counterpart cflowbelowdepth(i, pc) that tests for strictly enclosing joinpoints (excluding the current one). Again these are not features specific to the problem in hand, and indeed Harbulot has previously proposed them for completely different purposes [29]. This version is named TM-CFDepth in Table IV. Pleasingly, overheads over the pure AspectJ version are very small indeed. We conclude that when efficiency is a concern, it is advisable to express context-free patterns via cflowdepth. It turns out that our compiler can process the cflowdepth version of this benchmark when all method calls are instrumented, without using the contains primitive introduced above. The unrestricted version is named TM-CFDepth-Full. As shown by the penultimate row of IV, it is absolutely crucial to use contains: it leads to almost a 15 fold improvement in run time. In Section 7, we shall return to this point and speculate on an analysis that could automatically insert appropriate uses of contains. We also measured the effect of not using contains in the AspectJ version, and that is the last row of IV. The effect is much less pronounced than for tracematches because here the overhead per method call is essentially just a counter update, whereas the tracematch version creates a new partial match upon every method invocation.
6
TECHNIQUES
We have motivated the need for trace monitoring features, and we have argued that such features pose significant challenges to any attempt at implementing them. We now proceed to discuss some of the techniques we have used to obtain the performance results presented above, and examine in how far similar techniques are applicable (or indeed necessary) for alternative trace monitoring approaches.
6.1
State machine
A natural way of giving an operational semantics to a trace monitor is to define some finite-state automaton that accepts traces interesting to the monitor. This idea is highly pervasive. Indeed, all of the trace monitoring solutions for which we had access to implementation information make use of state machines to do their matching. Of course, depending on the expressiveness of the underlying formalism, different classes of automata need to be used: for tracematches, non-deterministic finite automata (NFAs) are sufficient; systems that support context-free patterns use some variant of push-down automata, and J-LO implements its LTL semantics via an alternating automaton. It seems clear, therefore, that investigating how the size and shape of the automaton impacts performance would be of interest to most, if not all, systems. We first discuss our own implementation — tracematches. During compilation, the regular expression for a tracematch is converted into an equivalent non-deterministic finite automaton. The alphabet of this automaton consists of the declared tracematch symbols, plus one special symbol which we call skip. Transitions labelled with this symbol are triggered when an event may be filtered due to variable bindings. It is also the only source of negative bindings. For a more detailed discussion of skip and its semantics, see [4]. As previously shown, sequences of events which all match the tracematch pattern but have different variable bindings may occur interleaved together at runtime, yet still match. For this reason, at runtime there is no notion of ‘the current automaton state’ — at any one time the implementation may be storing multiple partial matches corresponding to different automaton states. Thus, in a sense, all states are “current”: the matching state is represented by a series of constraints, one per state, and any state would be “current” subject to the constraint that labels it. Each time an event 20
occurs, the state is updated. For example, consider again the pattern r p q where r binds no variables, while p and q bind the same variable x, and the trace of events r; p(a); p(b) The automaton for this pattern is shown in Figure 7. Initially, the matching state is skip 0
r
1
skip p
2
q
3
Figure 7: Automaton for the pattern r p q. 0:true 1:false 2:false 3:false After the first event, r, the constraint from state 0 is propogated to state 1, along the transition labelled r. It is not possible for the r event to be skipped because it binds no variables, so it would never be filtered by a choice of variable bindings. The matching state is then 0:true 1:true 2:false 3:false The next event is p(a), for which we can follow the p transition (generating the constraint x = a) and also follow the skip transitions (generating the constraint x 6= a). This results in the following matching state 0:true 1:(x 6= a) 2:(x = a) 3:false The update for p(b) is similar to that for p(a). Note that the new constraint is always calculated by taking the conjunction of the constraint generated by following a transition, and the old constraint for the state the transition is from. The next matching state is therefore: 0:true 1:(x 6= a) ∧ (x 6= b) 2:(x = a) ∨ (x = b) 3:false Evidently, since each event may cause the constraints for most states to be updated, it is imperative that the automaton is as small as possible. For this reason, the NFA of each tracematch pattern is converted to a minimal DFA during compilation. The benefit of this step is purely in making the automaton smaller — there is no inherent benefit in having a deterministic automaton, and in fact a later compilation-step (collapsing all final states into a single final state with no outgoing transitions) may make the automaton non-deterministic again. Minimising the automaton for the pattern is merely a compile-time computation, but we have found it to be essential for achieving decent performance. Recall the two benchmark runs labelled Pql and PqlNeg in Section 3: Pql is the “natural” form of SafeEnum expressed in PQL, while PqlNeg added an extra negated symbol to approximate the behaviour of tracematches. In particular, one would expect that the negated symbol would allow PQL to discard partial matches earlier (immediately after a match has been detected) rather than keeping them alive indefinitely. Yet, the runtime of PqlNeg is almost twice that of Pql. Our investigations indicate that this is due to the fact that PQL generates a significantly larger automaton for the augmented pattern (the number of states grows from 13 to 19), and there are no efforts to minimise this. For comparison purposes, we would like to stress that the automaton generated by our tracematch implementation for SafeEnum has four states, and is thus minimal for the pattern. Tracematches have a filtering semantics, and this imposes some constraints on the generated automaton. The most obvious change necessitated by filtering is the addition of skip transitions, but one has to be 21
careful. Our formal semantics specifies that a skip transition is taken whenever no declared symbol matches. This is, of course, operationally infeasible — we do not want to instrument every single bytecode instruction of the base program, just because no declared symbol matched it. It turns out that this is unnecessary if we require that all skip transitions be self-loops — then it is sufficient to update the matching state any time a declared symbol matches (since taking a self-loop skip transition on an event that does not correspond to any declared symbol doesn’t change the partial matches; in particular, it can’t introduce positive or negative bindings). This observation is crucial to any trace monitoring feature that does not allow abitrary skipping of events, i.e. that uses a filtering semantics. One final observation about the effect of automaton structure on matching complexity is the following: tracematches (and indeed most other trace monitoring solutions) are concerned with matching suffixes of the program trace (i.e. any trace is allowed before we see an actual match). This is easily achieved in our case by ensuring that the constraints on initial states always remain true. Intuitively, this means that at any point we could start observing a sequence of events that will eventually lead to a match. Thus, initial states need not be updated, and do not contribute to the cost of matching. We have found a similar requirement useful for final states: we postulate that no final state should have outgoing transitions. If we take care to construct an automaton that satisfies this requirement, we can treat its final states as sinks for partial matches. Whenever the constraint label of a final state contains some partial matches (i.e. is not false), we run the tracematch body for each of those, but we are certain we never have to update them again. Also, if all final states are such that they do not have outgoing transitions, we can collapse them into a single state while preserving behaviour. Thus, we conclude that one should aim for an automaton with as few non-initial non-final states as possible.
6.2
Representing partial matches
As discussed in Section 2, not all of the systems we examined provided facilities to bind variables to runtime objects during matching of the trace condition. Allowing such bindings simplifies many patterns and makes others expressible in the first place; however, it is not at all clear what scheme should be used to represent the bound values at runtime. Indeed, this is Challenge 2 (Partial Matches) that we identified earlier. abc takes the unique approach (as far as we’re aware) of specialising to the declared tracematch variables [4]. Recall that we label each state with a constraint, which is built up from equalities (x = v) and inequalities (x 6= v), as well as logical conjunction and disjunction. For reasons of simplicity, we represent such constraints in disjunctive normal form (DNF); it is convenient to think of them as sets of disjuncts. Each disjunct roughly corresponds to a partial match — it records variable bindings for a potential matching trace of the program, and the state on which it appears can be used to deduce what portion of a matching trace has been observed already, and what events should be expected next. Thus, we need to provide an acceptable representation for these partial matches. The actual implementation generates a Disjunct class for each tracematch, specialised to the variables bound by that tracematch. The generated class has fields (of the right type) for every variable, so that looking up a binding is merely a field access. It also has fields for any negative bindings that are accumulated (these are represented as sets of weak references to values), and provides standard operations that our constraint updating code relies on — recording new bindings or checking compatibility of bindings, for example. All these operations are generated so that they take into account the structure of the class. A subtle point is that throughout the implementation, wherever a hash of a bound value is required, we cannot simply use the binding’s hashCode() method. Firstly, computing that may be quite expensive for certain objects; more importantly, it does not give us the right contract. Since the tracematch semantics distinguish bindings up to object identity (rather than some other notion of identity, e.g. the equals() method, which is the default for HashMaps and HashSet s), we must use identity hashes — hash codes that depend only on the object’s location in memory. Specialising the partial match representation to each individual tracematch may seem like a lot of effort, but we believe that it is worthwhile. The alternative is to have some generic way of representing bindings — for example, some mapping from partial matches to bound variables, or a generic PartialMatch class that
22
uses, say, Object arrays or similar to store the bindings. However, our experiments with J-LO indicate that a substantial part of its overhead is induced by the fact that a generic partial match representation is used. In addition to runtime overheads, both generic approaches proposed above suffer complications when we consider binding primitive values like int or float (indeed, we speculate that this difficulty is the reason why PQL does not support primitive-type bindings). The problem with primitive-type bindings would probably be somewhat alleviated by the autoboxing/autounboxing features of Java 1.5, which provide a canonical reference-typed representation for each primitive-type value. Still, by specialising the partial match representation at compile-time, one can employ techniques that would otherwise not be possible, since types of bindings are known. In summary, generating a specialised class for storing partial matches at compile-time allows us to reduce the cost for looking up a binding to a simple field access. By generating fields of exactly the right type for the bindings, we can provide a small measure of type safety, and reduce the need for casting from Object. In particular, knowing which bindings are of a primitive type allows us to generate code that handles them appropriately, e.g. by boxing them when required. We can effectively exploit this knowledge when generating the methods of the class in such a way that a minimum number of runtime tests are necessary.
6.3
Specialising to the pattern
As described above, the idea of using some sort of automaton (NFA, push-down automata, alternating automata, etc.) is quite pervasive. It is easy to think of a trace monitoring concern as a state machine being run alongside the program, making transitions and triggering matches. How should one implement this in practice? Some of the trace monitoring solutions (e.g. PQL, J-LO) keep a representation of the automaton at runtime, thus literally implementing the intuition given above. In abc with tracematches, we chose an approach similar to that of parser generators: there is no explicit record of the automaton at runtime, but its structure is implicit in the specialised code that is generated. The constraints with which we label the states of the automaton are represented by a special Constraint class, which stores a set of disjuncts, but also provides operations for updating and querying the constraint. In generating the code of these methods, we use our compile-time knowledge of the automaton; its structure guides the actions taken by them. For example, a method that records new bindings acquired by following a symbol transition can put the bindings precisely into the right fields with a minimum of runtime tests. A method that performs logical disjunction of constraints can, in constructing the new constraint, only copy the necessary parts of the old one, since we know at compile-time what variables are guaranteed bound at each state (and we don’t need to keep track of negative bindings sets for bound variables, for example; nor do we need to copy unbound values). Thus, all that remains of the state machine implementing the trace monitoring concern at runtime is the set of constraints labelling its states, and methods that simply “do the right thing”. We statically know what variables (of what types) are bound by each transition, and so we know whether a transition records new bindings or merely checks compatibility to existing bindings for any state. The only runtime check that remains necessary (for most methods) is a lookup switch at the beginning that differentiates between different states the constraint could be on; after that jump no further tests are required. Until now, we have not mentioned how events are intercepted by the tracematch system. It is not, in general, possible to statically determine whether or not a symbol-matching event will occur at a particular source location. However, a large part of the matching can be done at compile time. Source locations that may give rise to a symbol-matching events are instrumented to trigger constraint updates if such events occur. The code that is triggered is split up by symbol so that only the relevant updates are computed. Since more than one symbol may match the same event, the updated constraints are computed incrementally, symbol by symbol.
23
6.4
Detecting and avoiding leaks
Any trace monitoring solution that provides a way to bind variables must worry about space leaks caused by keeping references to the bound values, thus preventing them from being garbage-collected. In fact, even beyond this obvious source of leaks, there is the danger of “leaking” memory due to partial matches which can never complete, but are kept alive indefinitely because no event that invalidates them happens. Some implementations (e.g. PQL) do not consider space leaks to be a serious enough problem to warrant special treatment. Indeed, for our SafeEnum benchmark, the PQL-instrumented version threw an OutOfMemoryError on our default Java VM heap size, and we were forced to significantly increase available memory. It also seems easy to “overlook” the second kind of leak (leaking partial matches) and only deal with the first kind (leaking bound variables). It is our hope that our experiments served to illustrate the dangers of addressing this challenge incompletely. In the following, we shall describe a set of analyses for both kinds of space leak that we have implemented in abc. These analyses enable us to either avoid leaks entirely, or to warn the user at compile-time when a given tracematch can result in space leaks. Again, we would like to stress that no expensive whole-program analysis is required for these techniques. In fact, they rely on a purely local analysis of the tracematch automaton. At each state of the automaton, we partition the formal variables of the tracematch into the following sets: StrongRefs A formal variable v is in this partition if • it is used in the tracematch body, and • there is some path from the current state to a final state that does not bind v. Informally, v is a variable that we will need if the current partial match enters a final state, but if we don’t keep a strong reference to it it might be garbage-collected by the time a match is completed. WeakRefs A formal variable v is in this partition if • it is not used in the tracematch body, and • there is some path from the current state to a final state that does not bind v. Informally, even if we would normally have to keep a strong reference for v, we don’t have to if it is not used in the tracematch body. Keeping only a weak reference to v will allow it to be garbage-collected if necessary. CollectableWeakRefs A formal variable v is in this partition if every path from the current state to a final state also binds v. Informally, if v should be garbage-collected, then we know the current partial match can’t possibly result in a complete match, since on any path to a final state we would have to bind v again, and v has been destroyed. Now we can describe how we avoid the two kinds of space leaks introduced above. We avoid leaking bound values by keeping weak references to the bindings wherever possible. This means that on any state, we always keep weak references to every variable in the current WeakRefs and CollectableWeakRefs sets. Also, more subtly, we always keep weak references for negative bindings (even for variables that are actually in the StrongRefs set of the current state). This is because when we have a binding of the form (v 6= x), this doesn’t become invalid when the value x is garbage-collected — indeed, at that point we can be sure that v will never be bound to x, and we can drop the binding. We avoid leaking partial matches by discarding a partial match as soon as a variable v in its CollectableWeakRefs set is garbage-collected, since we can be sure that it can never reach a final state (recall that for v to be in this partition, there must be no path to a final state that doesn’t bind it again — and we know for sure that it won’t occur again in the program trace). These considerations make it quite clear when we have to issue a warning that leaks may occur. If there is some state (which is not initial and not final) which does not guarantee any of the variables in 24
its CollectableWeakRefs set bound, then we must warn, since partial matches could end up in a situation where they can’t be invalidated and will never progress to another state. Note that being able to give this warning is a significant advantage of a higher-level declarative trace monitor specification over a hand-coded AspectJ solution, where the same dangers are present, yet the potential for leaks can remain undiscovered. Also note that even if some state has a non-empty StrongRefs set, as long as it has variable in CollectableWeakRefs, it will still be destroyed when that variable is garbage-collected, and thus release its strong references, so that in this itself does not constitute a space leak. Note that while this sounds quite elaborate, due to the specialisation of the generated code at compile-time (cf. Sections 6.2, 6.3) our Constraint and Disjunct classes automatically handle the bindings appropriately, boxing them in weak references when needed, and performing the cleanups described above. We have found that far from being an unjustified burden, eliminating space leaks in fact significantly increases the performance of a trace match, since (a) allowing bindings to be garbage-collected keeps the memory usage down, reducing the need of forced GC runs, and (b) discarding invalidated partial matches early saves more work than it requires. As seen in Section 4, without the space leak eliminations some of our benchmarks are not feasible for tracematches, and even for those benchmarks which do not lead to space leaks without the analyses, there is hardly any overhead incurred by performing them anyway. It is of interest to contrast the J-LO implementation with our analyses. A J-LO trace specification consists simply of an LTL formula, there is no body of code that should be executed when a match occurs. The system works by rewriting the formula at run-time: whenever an event of interest happens, it either falsifies the formula (triggering a message), or it allows the formula to be rewritten given the assumption that the event has happened. For example, if a formula had the shape a =⇒ b and a occured, J-LO would keep only b, since ((a =⇒ b) ∧ a) =⇒ b. Some of the bound variables are thus eliminated from the formula if they don’t occur in the transformed formula; all the variables remaining correspond to our notion of CollectableWeakRefs, since they must occur in the program trace again for the formula to become invalid (this crucially depends on the fact that no extra code is executed upon a successful match, as otherwise it might be necessary to keep strong references to some of the variables). This enables J-LO to discard any partial formulae which have (weakly) bound a runtime value that is garbage-collected. It effectively performs our leak elimination analyses at runtime. Of course, this is another source of overhead.
6.5
Indexing
We have already stated that our tracematch implementation stores constraint labels in disjunctive normal form for each automaton state; the fact that we use DNF simplifies the constraints, at least conceptually, to a set of disjuncts (i.e. partial matches). However, any trace monitoring system must have some way of storing multiple partial matches at runtime — this is challenge 3 (Match Sets). We will describe a technique (and associated data structure) that has proved in many cases invaluable in making tracematch performance acceptable. If the constraint on each state was represented by a set of disjuncts, then every update that affected that state would have to iterate over the whole set, updating each partial match with the newly acquired information. In general, this means that the work done for each event would be proportional to the current number of partial matches. Indexing can reduce this substantially. Consider a single transition from state i to state j, labelled with the symbol s, which binds x. Suppose that all disjuncts at state i must have x bound. What happens when an event, s(o), occurs? For each disjunct D on state i, D ∧ (x = o) should be added to the constraint on state j. However, since all the disjuncts, on state i must have x bound, there are only two possibilities: either x is bound to o already and we just copy D across, or x is bound to a different object in which case D ∧ (x = o) ≡ false. It is therefore possible to index the disjuncts of state i by the object they bind x to, and only consider ‘compatible’ disjuncts when calculating the effect of an s event. Conversely, suppose we were adding a negative binding, (x 6= o). Recall, from Section 6.1, that we construct the automaton in such a way that transitions labelled with skip are always self-loops, and skip transitions are the only way we can acquire negative bindings. Thus, we only need to update each disjunct, D, that is not logically equivalent to D ∧ (x 6= o). Again, this is easily achieved — simply look up o in the 25
indexing map and perform the operations required on the resulting set of partial matches; we know that all other partial matches will remain unchanged. Our indexing data structure is a multi-level map. Suppose we had determined [x, y, z] as the list of variables to index on. At the top level, we would have a map from values of x to maps of level 2. Those maps would take us from values of y to maps of level 3, which in turn would take us from values of z to sets of partial matches that have the bindings of x, y, z corresponding to the path through the maps that we chose. The depth of the structure is the number of variables indexed on, and if the state can’t be usefully indexed at all then just a single set of disjuncts is stored. For a single state i and a single symbol s, the set of variables that it is useful to index on is I(i, s), defined as I(i, s) = bound(i) ∩ binds(s) where bound (i) is the set of tracematch formals that are guaranteed to be bound at state i, and binds(s) is the set of formals that the symbol s binds. States are, in general, the source of more than one transition, but we can only use one indexing scheme on each state, so we need to choose one that will benefit all transitions, if possible. If I(i, s) = ∅, for some symbol s, then that symbol should be ignored when choosing the formals to index on for that state — just because indexing cannot help s it does not mean performance gains are not available for other transitions. The set of formals chosen to index on, for a state i and the set of all tracematch symbols S, is therefore \ I(i, s) s∈S I(i,s)6=∅
This takes into account all tracematch symbols because all states that may be indexed have skip-loops; calculating the constraint generated by skipping an event involves calculating the constraint generated by each symbol not matching that event. Sometimes, a good choice of variables to index on cannot be made purely by analysing the automaton. For example, there may be symbols s1 , s2 and a state i such that I(i, s1 ) and I(i, s2 ) are disjoint. This is the case for the SafeEnum benchmark — there is actually a clear choice of index, but it relies on knowing that one symbol will be matched significantly more often than another. For this reason, tracematch symbols may be annotated ‘frequent’. When such annotations are used, only the annotated symbols are used to calculate which variables to index on. Note that the constraint for the initial state in a tracematch automaton is always true, so this state is never indexed. Also, by construction, the automaton only has one final state. This final state has no outgoing transitions, and the tracematch body is run once for each distinct set of bindings whenever the constraint for this state is not false. Therefore the final state is also never indexed. Indexing works best, and brings enormous savings, when there are many partial matches with different values for the bound variables; if there are only very few different values maintaining the indexing maps may actually cause an overhead. Indeed, this is the reason why, in Section 4, for the Observer benchmark TMNoIndex performs better than TM: the base program is such that there is only ever exactly one set of values to which the tracematch formals are bound. Recall that each time an event occurs, changes to the state constraints are calculated incrementally — symbol by symbol. As a result, there may be interleaved uses of the old constraint for a state (as a source of disjuncts) and updates to the new constraint for that state (as a sink for newly calculated disjuncts). Consequently, it is not possible to destructively update a state’s map of disjuncts. Copying the map is the obvious solution, but this would negate the performance benefits of indexing in the first place: the amount of work done would again be proportional to the number of partial matches stored. The tracematch implementation solves this problem by maintaining one complete map of disjuncts and incrementally updating two patches (similar in principle to those used by the diff command), which queue the updated disjuncts until they can be merged into the complete map. One patch is for holding the intermediate calculations for the skip transition (which are combined with conjunction), and the other is for holding the results of non-skip transitions (which are combined with disjunction). Figure 8 demonstrates 26
this process, assuming that an event has just occured which matches a symbol, s, with the constraint (x = o2 ) ∧ (z = o5 ), for a state with no incoming s transitions.
x = o1 ∧ y = o4 x = o1
Original constraint
x = o2
x = o2 ∧ y = o4
x = o3
x = o3 ∧ y = o4
skip patch
non-skip patch
x = o2
x = o2 ∧ y = o4 ∧ z 6= o5
x = o2
false
x = o1 ∧ y = o4 x = o1
New constraint after merge
x = o2
x = o2 ∧ y = o4 ∧ z 6= o5
x = o3
x = o3 ∧ y = o4
Figure 8: An example of how patching works when an event has just occured which matches a symbol with the constraint (x = o2 ) ∧ (z = o5 ) A further complication of implementing indexing is that we must be careful not to break the techniques for avoiding space leaks described in the previous Section. We must also avoid creating an unbounded number of boxes for primitive bindings. We achieve this in the following way: WeakRefs When a formal variable in this category is indexed on, objects used in the index are boxed in weak references and stored in a HashMap. The equals() method on the weak reference implementation that we use is based on the identity of the objects being weakly referenced, and this preserves tracematch semantics. Of course, we need to be careful to use identity hashes rather than the normal hash codes of the stored bindings. CollectableWeakRefs Objects bound to formal variables in this category are stored as in the WeakRefs case, except the map used automatically discards a mapping if the weakly-referenced key is garbage collected. This is a very cheap way of dropping invalidated partial matches. Primitive Variables Primitive values are also boxed and stored in a HashMap. The standard Java boxingobjects are used, on which equality is defined in terms of the equality of the boxed values, not the 27
identity of the boxes. As a result, we only have one box for a given primitive value in a map, and the total number of boxes is bounded by the number of maps (and the number of different values that we see).
7
FUTURE WORK
We have presented various of useful optimisations and have shown their effectiveness by employing several benchmarks. Those benchmarks, however, also show that there is still a remaining gap in performance between hand-optimised AspectJ versions and code generated by our tracematch implementation. In this section we review areas where we see further room for improvements, paying particular attention to Challenge 6 (Static prediction), as well as further ways of addressing Challenge 3 (Match sets).
7.1
Intertype Declarations (ITDs)
As we have seen in Section 6, indexing the set of constraints by the objects bound to specific variables reduces the overhead of tracematches. It thus goes a long way towards answering Challenge 3. However, the run-time cost of maintaining and querying the index implemented using a HashMap is still significant. In many common cases, it is possible to further reduce this cost by storing the mapping from bound objects to constraints in the bound objects themselves, rather than in an external HashMap. Once we have done the required analysis for indexing, this transformation is conceptually simple: for each class C of an object on which we index, we can implement the indexing as a field index injected into C using an intertype declaration. We can then replace each costly HashMap lookup of the form index.get( object ) with a cheap field access of the form object.index A subtle implementation detail is that an intertype declaration can only be applied to a class if the class is weavable (that is, it is one of the classes into which the compiler is weaving). In many tracematches, the types of bound variables are classes of the standard library, which are usually not provided to the compiler as weavable. For example, in the unsafe enumerators tracematch shown in Figure 1, the bound variables are of type Vector and Enumeration. When the class of a bound variable is not weavable, it may be possible to synthesise a weavable version of the class (as a subclass of the original class), and replace all instances of the original non-weavable class with the synthesised weavable class. This is possible only when the creation site of every object bound by the tracematch is in a weavable class, and therefore available to be replaced with a creation site of the synthesised class. This condition can be statically conservatively approximated using points-to analysis. Alternatively, the transformation can be done speculatively without a static points-to analysis in the following way. First, we modify all weavable creation sites to create objects of the synthesised weavable class. Then, whenever the tracematch binds an object, it must check whether it is of the weavable class. If it is, the tracematch can use its index field; otherwise, the tracematch must fall back to indexing the object in a HashMap.
7.2
Singleton Bindings
In many tracematches binding two or more variables, it is the case that the value of one of the tracematch variables uniquely determines the value of a second tracematch variable. For example, in the unsafe enumeration tracematch, each Enumeration (e) object corresponds to a single unique Vector (ds) object. If we first index on the variable e, only one binding for ds is possible. In this case, since e and ds are the only tracematch variables, the set of possible bindings after indexing on e is always a singleton set. Therefore, rather than storing the set of bindings as a singleton HashSet and iterating over it, we can more efficiently store only the single binding itself.
28
More generally (i.e. in a tracematch with more than two variables), if we first index on the variable that uniquely determines the value of a second variable, we can avoid the index lookup on the second variable. In the unsafe enumeration tracematch, it is quite easy to prove that each Enumeration uniquely determines the corresponding Vector, because the first symbol of the tracematch (create enum) matches the constructor of the Enumeration, guaranteeing a fresh Enumeration object that could not have been bound by any other match. In the general case, a more sophisticated dataflow analysis may be required to prove that each instance of the match binds a fresh object. We have applied the ITD and Singleton Bindings optimisations by hand to the unsafe enumeration tracematch. As we can see in Figure 4, the optimisation reduces execution time by a factor of 14.5, bringing it to within a factor of 1.3 of the uninstrumented Java code. Therefore, we believe that implementing these transformations and the required analysis will be very worthwhile.
7.3
Static Match Analysis
In the longer term, we plan to implement additional static analyses to reduce the number of joinpoint shadows at which matching work must be done at runtime. Ideally, for some programs, all matching would be done statically, but this is undecidable in general. Even when static analysis cannot compute tracematch matching completely, it may be able to determine that updates at the shadows of some tracematch symbols are unnecessary, because for this symbol either every path leading to a final state goes through this shadow or conversely, no such path exists. For example, given a tracematch pattern p q r, when q binds no variable and we can prove that every program path starting at a shadow of p and ending in a shadow of r leads through a shadow of q, then we do not need any state updates when encountering q. In fact, the generated code for the implementation can be reduced completely to code that would be generated for the pattern p r. Conversely, if we could prove that there exists no reachable shadow of p, q or r in the instrumented program at all, then we also know that the tracematch can never match and can statically decide to not actually do any weaving at all, lowering the overhead effectively to zero. Similarly we can narrow the set of joinpoint shadows that a symbol matches if we can prove that this transformation will not affect the behavior of the tracematch over all possible traces of the base program. The use of contains() in LUinMeth is one such optimisation, and the experiments have shown that it produces a 15-fold speed up on the tracematch, making it almost match the pure aspect version in run time. In general we believe that such an analysis would require more precision than contains() provides, and several proposed query and pointcut languages can be useful for this purpose [1,33,37], if only as an internal representation. PQL [35] uses flow-insensitive points-to analysis to rule out some match updates. For the SQL injection detection checker used as the running example in this paper, the analysis reduces the runtime cost of the checker by ruling out the many instances of java.lang.String that will never be passed to SQL code. Since tracematches are flow-sensitive by their nature, we plan to implement a flow-sensitive tracematch analysis. Such an analysis must consider both possible control flow and possible dataflow between joinpoint shadows matched by symbols of the tracematch. To analyse control flow, we plan to construct a pruned interprocedural control flow graph containing only joinpoint shadows matching some symbol of the tracematch and possible control flow edges between them. We will then interpret the matching automaton on the control flow graph to find only those joinpoint shadows reachable in both the control flow graph and the automaton, since only these shadows can lead to a match. This is very similar to the usual algorithms for performing LTL Model Checking [16] where an automaton equivalent to a negated LTL specification is combined with an abstract model of the program under test. The combined graph is then searched for accepting paths. Any such path is a path that could lead to a match during runtime. Indeed, this technique, similiar to slicing [11, 39], has been implemented in the Bandera Model Checker [30]. Initial experiments we conducted showed that such an abstraction of the control flow graph pays off very well since in many cases most of the edges induced by JDK internal calls can be abstracted away, reducing the resulting graph significantly in size.
29
In the case of tracematches, because they usually bind values, analysis of dataflow is needed in addition to control flow analysis. May-point-to analyses track possible flow from allocation sites to other parts of the program. For tracematches, however, we are interested in flow between joinpoint shadows matched by different symbols of a trace match. Thus, we expect techniques similar to those used in may-point-to analyses to be applicable, but we will modify them to track flow from joinpoint shadows rather than allocation sites. In addition to possible (may) flow information, definite (must) flow information will be useful to rule out matches that cannot match due to filtering. Thus, we plan to implement must analyses in addition to may analyses. There is a very large body of related work on static analyses for verifying finite state properties of code via static analysis. Engler [28] presents an efficient framework, which has turned out to be very effective in locating potential bugs, but it is unsound and therefore unsuitable for our application. By contrast, Das [18] presents a sound framework for checking finite state properties, but it is somewhat restrictive, for example dealing with at most one bound variable. Nevertheless, we believe some of his techniques may be effective in our context. Finally, the SLAM project at Microsoft [9] does very precise analysis, using predicate abstraction to rule out false matches. Such techniques are only likely to be necessary when combining tracematches with AspectJ’s declare error construct for reporting faults at compile-time.
8
CONCLUSIONS
A large amount of previous work has demonstrated that trace monitors are a useful programming language feature: one can specify a desired trace property (possibly with an associated action) in a declarative style, and the compiler inserts the necessary instrumentation in a software system, possibly in many different places. It is very hard, however, to generate efficient instrumentation. The first objective of this paper has been to acquire the measurements that show this difficulty. In order to achieve that objective, we have studied a wide variety of systems from three research communities, namely aspect-oriented programming (e.g. tracematches), program analysis (e.g. PQL) and runtime verification (e.g. J-LO). Indeed, the results of this paper demonstrate that the problems in this area can only be attacked by drawing on the results and experiences from all three of those research areas. We then went on to develop a set of quite sophisticated monitor specifications, and we applied these to highly non-trivial benchmark programs. The monitor specifications are representative of those found in the literature, including typical concurrency properties like lock-order reversal, and also properties that appear to require context-free (as opposed to merely regular) patterns. The monitored benchmark programs include substantial applications such as the web server Jigsaw (101 KSLOC) and the termination prover AProVe (439 KSLOC). We found that although there are many suggested systems and prototypes for generating trace monitors from specifications, very few systems are robust enough to run large benchmarks. Furthermore, the overheads of instrumentation turned out to be surprisingly high, often prohibitively so. It is nevertheless our aim to render trace monitors a mainstream programming language feature. For that reason, it is important that the implementation does not require whole program analyses of the monitored code, as that could lead to infeasibly high compilation times. Also, such analyses could easily result in brittle performance, where a small change in the base code has unexpected repercussions in runtime or memory usage. Therefore, we decided to investigate techniques that only rely on analysis of the monitor specification to obtain acceptable overheads. To achieve that goal, we identified six major challenges in a series of extensive, careful experiments: 1. Represent the state machine for matching. 2. Represent partial matches that involve bindings of variables. 3. Design an appropriate data structure for sets of partial matches. 4. Detect and prevent potential space leaks. 30
5. Balance expressive power in the pattern language with efficiency. 6. Predict statically when a single-event match must lead or cannot lead to a matching trace. We found very effective techniques for addressing the first four of these challenges. On the fifth challenge, we concluded that the use of bound variables in patterns obviates the need for context-free pattern languages. The last challenge, when solved, has the potential to rival the efficiency of hand-coded solutions. We feel it is very important that our local techniques already come close to that ideal, always within an order of magnitude for the benchmarks we have studied to date. Therefore, implementing further sophisticated analyses could yield improvements, but the feasibility of using trace monitors does not hinge on such analyses. Interestingly, no single technique is enough on its own, and in particular the use of an indexing data structure for sets of partial matches is essential in conjunction with leak prevention. More precisely, for benchmarks with a lot of heap turnover, where partial matches refer to garbage-collected objects, leak prevention is a must. For benchmarks where there are large collections of live partial matches, indexing saves the day. In addressing these challenges, we also discovered a number of interesting new language features for AspectJ, that are of general interest beyond the context of trace monitors. One example of such a feature is the new let pointcut, that allows one to bind any value (that is statically in scope) to a pointcut parameter. This is useful, for example, in binding the current thread, or the line number where a fault occurred. Another example of a new feature is the contains(pc) pointcut, which allows one to pick out joinpoints whose shadow contains a shadow matching pc. That is often useful in restricting the amount of instrumentation generated, and the experiments have shown that proper use can decrease run times by an order of magnitude. As our evaluation has shown, similar language features would have made more of our examples also expressible in PQL. Indeed, a language feature for binding threads is planned for a later version of PQL but is not yet available to date. The size of the benchmarks themselves indicate that the run-time performance of trace-based monitoring with variable bindings can scale, with the use of appropriate optimisations. This is important, as high-level declarative trace specifications become more useful as the size and complexity of its base program increase. The implementation of such systems must generate instrumentation that does not have too great a negative impact on the base program’s run time, and for the most part our experiments have shown that generated code can achieve performance close to equivalent hand-crafted AspectJ code, even on the larger benchmarks. Indeed, the Jigsaw benchmark results show that trace-based matching can even produce run times that are competitive with hand-coded AspectJ. In summary, a lot of previous work has demonstrated the importance of trace monitors. Here we have shown, for the first time, how they can be implemented with acceptable efficiency, relying only on local analyses of the monitor specification. A lot more remains to be done. In particular performance can be further improved, via the techniques we have outlined in Section 7, and perhaps also via direct support in a virtual machine [14]. We also plan to coordinate a collaborative effort to further build up the collection of benchmarks, both by adding new examples and by coding up existing benchmarks in other systems. We hope that others will join us in the investigation of this exciting new area that draws together the forefront of aspect-oriented programming, program analysis and runtime verification. Aspects offer an ideal setting for integrating monitoring features into a mainstream language; program analysis provides techniques to achieve efficiency, and runtime verification contributes appropriate specification formalisms.
ACKNOWLEDGEMENTS We would like to thank Michael Martin for answering many questions about PQL, and for his help in getting it to process the benchmarks in this paper. Kevin Viggers and Rob Walker kindly gave us a private preview of their DEPs tool that implements the tracecut feature with context-free patterns, as an extension of AspectJ. Klaus Havelund contributed much to our understanding of the subject, and he kindly ran some benchmarks on our behalf because licensing issues prevented him from sharing his implementation of HAWK. Christoph Bockisch provided some background information on the Alpha tool, and we had interesting discussions about 31
the implementation challenges with him and Klaus Ostermann. Eric Bodden would like to thank Volker Stolz for the very enjoyable collaboration that led to the J-LO tool, and thus to the work presented here. Oege de Moor would like to thank the programming languages group at IBM Watson research center for their feedback on this work during a productive visit in January 2006. Elnar Hajiyev and Damien Sereni provided helpful comments on a draft of this paper. This research was supported by EPSRC grants EP/C546873/1 and EP/D037085/1 and NSERC.
References [1] The alpha project. http://www.st.informatik.tu-darmstadt.de/pages/project/alpha/, 2006. [2] Trace monitoring benchmarks. Available from http://aspectbench.org/benchmarks, 2006. [3] abc. The AspectBench Compiler. Home page with downloads, FAQ, documentation, support mailing lists, and bug database. http://aspectbench.org. [4] Chris Allan, Pavel Avgustinov, Aske Simon Christensen, Laurie Hendren, Sascha Kuzins, Ondˇrej Lhot´ ak, Oege de Moor, Damien Sereni, Ganesh Sittampalam, and Julian Tibble. Adding Trace Matching with Free Variables to AspectJ. In Object-Oriented Programming, Systems, Languages and Applications, pages 345–364. ACM Press, 2005. [5] AProVE. Automated Program Verification Environment. http://aprove.informatik.rwth-aachen. de/, 2006. [6] Andr´e Arnes. Certificate revocations performance simulation project. http://www.pvv.ntnu.no/ ~andrearn/certrev/sim.html, 2000. [7] AspectJ Eclipse Home. The AspectJ home page. http://eclipse.org/aspectj/, 2003. [8] Pavel Avgustinov, Aske Simon Christensen, Laurie Hendren, Sascha Kuzins, Jennifer Lhot´ ak, Ondˇrej Lhot´ ak, Oege de Moor, Damien Sereni, Ganesh Sittampalam, and Julian Tibble. Optimising AspectJ. In Programming Language Design and Implementation (PLDI), pages 117–128. ACM Press, 2005. [9] Thomas Ball and Sriram K. Rajamani. The SLAM project: debugging system software via static analysis. In Proceedings of the 29th ACM SIGPLAN-SIGACT Symposium on Principles of Programming Languages, pages 1–3. ACM Press, 2002. [10] Howard Barringer, Allen Goldberg, Klaus Havelund, and Koushik Sen. Rule-based runtime verification. In Fifth International Conference on Verification, Model Checking and Abstract Interpretation (VMCAI 04), volume 2937, pages 44–57. Lecture Notes in Computer Science, 2003. [11] David Binkley and Keith Brian Gallagher. Program slicing. Advances in Computers, 43:1–50, 1996. [12] Christoph Bockisch, Mira Mezini, and Klaus Ostermann. Quantifying over dynamic properties of program execution. In 2nd Dynamic Aspects Workshop (DAW05), Technical Report 05.01, pages 71–75. Research Institute for Advanced Computer Science, 2005. [13] Eric Bodden. J-LO - A tool for runtime-checking temporal assertions. Master’s thesis, RWTH Aachen University, 2005. [14] Eric Bodden and Volker Stolz. Efficient temporal pointcuts through dynamic advice deployment. In Workshop on Open Aspect Languages, Bonn, Germany, 2006. [15] Mar´ıa Augustina Cibr´ an and Bart Verheecke. Dynamic business rules for web service composition. In 2nd Dynamic Aspects Workshop (DAW05), pages 13–18, 2005. [16] Edmund M. Clarke, Orna Grumberg, and Doron A. Peled. Model Checking. The MIT Press, Cambridge, Massachusetts, 1999. 32
[17] Marcelo d’Amorim and Klaus Havelund. Event-based runtime verification of java programs. In WODA ’05: Proceedings of the third international workshop on Dynamic analysis, pages 1–7. ACM Press, 2005. [18] Manuvir Das, Sorin Lerner, and Mark Seigle. ESP: path-sensitive program verification in polynomial time. In ACM SIGPLAN 2002 Conference on Programming Language Design and Implementation, pages 56–68. ACM Press, 2002. [19] R´emi Douence, Pascal Fradet, and Mario S¨ udholt. A framework for the detection and resolution of aspect interactions. In Proceedings of the ACM SIGPLAN/SIGSOFT Conference on Generative Programming and Component Engineering (GPCE’02), pages 173–188. ACM Press, 2002. [20] R´emi Douence, Pascal Fradet, and Mario S¨ udholt. Composition, reuse and interaction analysis of stateful aspects. In Karl Lieberherr, editor, 3rd International Conference on Aspect-oriented Software Development, pages 141–150. ACM Press, 2004. [21] R´emi Douence, Pascal Fradet, and Mario S¨ udholt. Trace-based aspects. In Aspect-oriented Software Development, pages 141–150. Addison-Wesley, 2004. [22] R´emi Douence, Thomas Fritz, Nicolas Loriant, Jean-Marc Menaud, Marc S´egura, and Mario S¨ udholt. An expressive aspect language for system applications with arachne. In Aspect-Oriented Software Development, pages 27–38. ACM Press, 2005. [23] R´emi Douence, Olivier Motelet, and Mario S¨ udholt. A formal definition of crosscuts. In Akinori Yonezawa and Satoshi Matsuoka, editors, Reflection 2001, volume 2192 of Lecture Notes in Computer Science, pages 170–186. Springer, 2001. [24] Bruno Dufour, Karel Driesen, Laurie Hendren, and Clark Verbrugge. Dynamic metrics for Java. In Proceedings of the 18th ACM SIGPLAN conference on Object-oriented programing, systems, languages, and applications, pages 149–168. ACM Press, 2003. [25] Thomas Fritz, Marc S´egura, Mario S¨ udholt, Egon Wuchner, and Jean-Marc Menaud. An application of dynamic AOP to medical image generation. In 2nd Dynamic Aspects Workshop (DAW05), Technical Report 05.01, pages 5–12. Research Institute for Advanced Computer Science, 2005. [26] Erich Gamma. JHotDraw. Available from http://sourceforge.net/projects/jhotdraw, 2004. [27] Simon Goldsmith, Robert O’Callahan, and Alex Aiken. Relational queries over program traces. In Proceedings of the 20th Annual ACM SIGPLAN Conference on Object-Oriented Programming, Systems, Languages and Applications, pages 385–402. ACM Press, 2005. [28] Seth Hallem, Benjamin Chelf, Yichen Xie, and Dawson Engler. A system and language for building system-specific, static analyses. In ACM SIGPLAN Conference on Programming Language Design and Implementation, pages 69–82. ACM Press, 2002. [29] Bruno Harbulot. CFlowLevel extension for abc. Description and downloads at http://www.cs. manchester.ac.uk/cnc/projects/loopsaj/cflowlevel/, 2005. [30] John Hatcliff, Matthew B. Dwyer, and Hongjun Zheng. Slicing software for model construction. HigherOrder and Symbolic Computation, 13(4):315–353, 2000. [31] Erik Hilsdale and Jim Hugunin. Advice weaving in AspectJ. In K. Lieberherr, editor, Aspect-oriented Software Development (AOSD 2004), pages 26–35. ACM Press, 2004. [32] Peter Hui and James Riely. Temporal aspects as security automata. In Foundations of Aspect-Oriented Languages (FOAL 2006), Workshop at AOSD 2006, Technical Report #06-01, pages 19–28. Iowa State University, 2006. [33] Doug Janzen and Kris de Volder. Navigating and querying code without getting lost. In Proceedings of the 2nd international conference on Aspect-oriented software development, pages 178–187. ACM Press, 2003. 33
[34] Ramnivas Laddad. AspectJ in Action. Manning, 2003. [35] Michael Martin, Benjamin Livshits, and Monica S. Lam. Finding application errors using PQL: a program query language. In Proceedings of the 20th Annual ACM SIGPLAN Conference on ObjectOriented Programming, Systems, Languages and Applications, pages 365–383. ACM Press, 2005. [36] Hidehiko Masuhara, Gregor Kiczales, and Chris Dutchyn. A compilation and optimization model for aspect-oriented programs. In Compiler Construction, volume 2622 of Lecture Notes in Computer Science, pages 46–60. Springer, 2003. [37] Tobias Rho and Gunter Kniesel. Uniform genericity for aspect languages. Technical Report IAI-TR2004-4, University of Bonn, 2004. [38] Volker Stolz and Eric Bodden. Temporal Assertions using AspectJ (to appear in LNCS). In RV’05 Fifth Workshop on Runtime Verification, 2005. [39] Frank Tip. A survey of program slicing techniques. Journal of Programming Languages, 3(3):121–189, 1995. [40] Arie van Deursen, Leon Moonen, and Marius Marin. projects/ajhotdraw/, 2006.
AJHotDraw.
http://sourceforge.net/
[41] Wim Vanderperren, Davy Suv´e, Mar´ıa Augustina Cibr´ an, and Bruno De Fraine. Stateful aspects in JAsCo. In Software Composition: 4th International Workshop, volume 3628 of Lecture Notes in Computer Science. Springer, 2005. [42] w3c. Jigsaw. http://www.w3.org/Jigsaw/, 2006. [43] Robert Walker and Kevin Viggers. Implementing protocols via declarative event patterns. In ACM Sigsoft International Symposium on Foundations of Software Engineering (FSE-12), pages 159–169. ACM Press, 2004. [44] David Wheeler. SLOCCount. http://www.dwheeler.com/sloccount/, 2006.
34