Efficient Volume Visualization of Large Medical Datasets Stefan Bruckner∗ Institute of Computer Graphics and Algorithms Vienna University of Technology Vienna, Austria
A BSTRACT In volume visualization, huge amounts of data have to be processed. While modern hardware is quite capable of this task in terms of processing power, the gap between CPU performance and memory bandwidth further increases with every new generation of CPUs. It is therefore essential to efficiently use the limited memory bandwidth. In this paper, which summarizes the key findings of the master’s thesis with the same title [1], we present novel approaches to optimize CPU-based volume raycasting of large datasets on commodity hardware. A new addressing scheme is introduced, which permits the use of a bricked volume layout with minimal overhead. We further present an extended parallelization strategy for Simultaneous Multithreading. Finally, we introduce memory efficient acceleration data structures which enable us to render large medical datasets, such as the Visible Male (587 × 341 × 1878), at up to 2.5 frames/second on a commodity notebook. 1
I NTRODUCTION
Direct volume rendering (DVR) is a powerful technique to visualize complex structures within volumetric data. Its main advantage, compared to standard surface rendering, is the ability to concurrently display information about the surface and the interior of objects. This aids the user in conveying spatial relationships of different structures (see Figure 1). In medicine, visualization of volumetric datasets acquired by computed tomography (CT), magnetic resonance imaging (MRI), or ultrasound imaging helps to understand patient’s pathological conditions, improves surgical planning, and has an important role in education. However, a typical data size of today’s clinical routine is about 512 × 512 × 1024 (12 bit CT data) and will increase in the near future due to technological advances in acquisition devices. Conventional slicing is of limited use for such large datasets due to the enormous amount of slices. However, providing interactive three-dimensional volume visualization of such large datasets is a challenging task. The purpose of this paper is to summarize the key findings of the master’s thesis Efficient Volume Visualization of Large Datasets [1] carried out at the Institute of Computer Graphics and Algorithms of the Vienna University of Technology in cooperation with TIANI Medgraph AG. The full text of the thesis and additional material is available at: http://www.cg.tuwien.ac.at/˜bruckner/homepage/content/mastersthesis. The main motivation for the master’s thesis was to develop a high-quality direct volume rendering system capable of handling large medical data on commodity hardware. As the system was to be deployed on a large number of systems equipped with heterogenous hard- and software, it was essential not to rely on any specific capabilities, such as special graphics hardware features. Current approaches for graphics hardware accelerated volume rendering are ∗ e-mail:
[email protected]
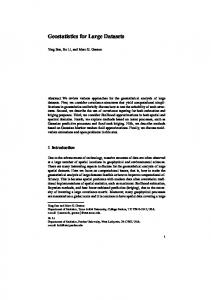
Figure 1: Direct volume rendering of a computed tomography angiography (CTA) dataset - enhanced display of blood vessels
still limited with respect to the dataset size (most graphics cards are only equipped with 256 MB of memory while a standard PC has 1000 MB of main memory) and quality (e.g. floating-point operations are only partly supported). Furthermore, practical problems like manufacturer dependent feature sets, different driver versions, etc. were to be avoided. A fully software-based system generally does not suffer from these problems, while still allowing for a highly efficient solution. The software implementation developed was integrated in TIANI’s medical workstation J-Vision and is clinically used by many customers. Furthermore, the research performed within the scope of this master’s thesis has lead to a number of publications in journals and at international conferences [4, 6, 5]. In this paper, we present several techniques developed to perform high-quality volume visualization of large datasets (> 512 × 512 × 512) using commodity hardware. Section 2 is devoted to the extensive research that has been performed in this area. In Section 3, we deal with the fundamental issue of efficient memory management. We present methods to exploit parallelization techniques available on consumer hardware in Section 4. In Section 5, we introduce acceleration data structures that do not suffer from the drawback of high memory consumption. Finally, our results are presented and discussed in Section 6 and the paper is concluded in Section 7. 2
R ELATED W ORK
Within the domain of volume visualization three basic directions of research have emerged: Firstly, in recent years methods have
been presented which utilize the latest features of consumer graphics hardware. Secondly, several dedicated hardware solutions have been developed. The third category is CPU-based volume rendering using algorithmic optimizations. Graphics hardware based solutions provide real-time performance and high quality [2, 3, 26, 15, 10, 24]. These methods rely on advanced graphics hardware features, which limits their use on general purpose PCs. Guthe et al. [8] utilize wavelet compression to handle large datasets. They gain performance by using a levelof-detail approach based on the viewer position. One problem of approaches using graphics hardware is that they are limited in their functionalities: Basic rendering capabilities are supported by hardware volume rendering solutions. However, advanced visualization systems provide preprocessing features such as filtering, segmentation, morphological operations, etc. If such operations are not supported by the hardware, they have to be performed on the CPU and data must be transferred back to the hardware. This transfer is very time consuming, thus, no interactive feedback is possible. Dedicated hardware solutions [7, 16, 20, 23, 22] provide support for many advanced visualization techniques. They feature highquality and impressive performance. For example, the VolumePro board [22] is capable of rendering a 512 × 512 × 512 dataset at 30 frames/second. The disadvantage of these approaches is their high cost. In CPU-based solutions memory and processing bandwidth are limited. Their strength is the high flexibility and independence of special hardware capabilities. These approaches rely on specialized algorithms to provide interactivity. Many high-level algorithmic optimization techniques have been developed to achieve high performance. Most of these techniques have the assumption in common that only parts of the data have to be visualized. This assumption is still valid, but the resolution delivered by acquisition devices constantly increases. A main issue therefore is to handle these large amounts of data. Approaches by Knittel [9] and Mora et al. [18] achieve high performance by using a spread memory layout. The main drawback of these approaches is the enormous memory usage. In both systems, the usage is approximately four times the data size. This memory consumption is quite a limitation, considering that the maximum virtual address space is about 3 GB on current commodity computer systems. One focus of our research was to address this issue in order to present a new approach using significantly less memory. In contrast to other methods, we try to reduce the influence of the memory bottleneck by performing many computations (gradient estimation, shading) on-the-fly rather than to rely on precomputation. 3
M EMORY M ANAGEMENT FOR L ARGE DATASETS
The past years have shown that the discrepancy between processor and memory performance is rapidly increasing, making memory access a potential bottleneck for applications which have to access large amounts of data. Raycasting, in particular, is prone to cause problems, since it generally leads to irregular memory access patterns. This section discusses strategies to improve memory access patterns taking advantage of the memory hierarchy. The memory of contemporary computers is structured in a hierarchy of successively larger, slower, and cheaper memory levels. Each level contains a working copy or cache of the level above. Recent developments in processor and memory technology imply an increasing penalty if programs do not take optimal advantage of the memory hierarchy. In general, if the CPU issues an operation on a data item, the request is propagated down the cache hierarchy until the requested data is found. It is very time consuming if the data is only found in a slow cache. This is due to the propagation itself as well as to the back propagation of data through all the caches. For good performance, frequent access to the slower caches has to be avoided. Accessing the slower caches, like hard
block
(a)
(b)
Figure 2: Linear and bricked volume layouts. (a) linear volume layout stored as a stack of slices. (b) bricked volume layout stored as a set of blocks.
disk and main memory, only once would be optimal. We assume that there is enough main memory available to hold the volume data and all other data structures necessary - the hard disk only has to be accessed when a volume is loaded. Thus, the main focus lies in optimizing main memory access. 3.1 Bricking The most common way of storing volumetric data is a linear volume layout. Volumes are typically thought of as a stack of twodimensional images (slices) which are stored in an array linearly. The work-flow of a standard volume raycasting algorithm on a linearly stored volume is as follows: For every pixel of the image plane a ray is cast through the volume and the volume data is resampled along this ray. At every resample position resampling, gradient computation, shading, and compositing is performed. The closer the neighboring rays are to each other, the higher the probability is that they partially process the same data. Given the fact that rays are shot one after the other, it is very likely that the same data has to be read several times from main memory, because in general the cache is not large enough to hold the processed data of a single ray. This problem can be targeted by a technique called tile casting. Here, rather than processing one ray completely, each pass processes only one resample point for every ray. However, different viewing directions still cause different amounts of cache line requests to load the necessary data from main memory which leads to a varying frame-rate. The concept of bricking supposes the decomposition of data into small fixed-sized data blocks (see Figure 2). Each block is stored in linear order. The basic idea is to choose the block size according to the cache size of the architecture so that an entire block fits into a fast cache of the system. It has been shown that bricking is one way to achieve high cache coherency, without increasing memory usage [21]. However, accessing data in a bricked volume layout is very costly. 3.2 Addressing The addressing of data in a bricked volume layout is more costly than in a linear volume layout. To address one data element, one has to address the block itself and the element within the block. In contrast to this addressing scheme, a linear volume can be seen as one large block. To address a sample it is enough to compute just one offset. In algorithms like volume raycasting, which need to access a certain neighborhood of data in each processing step, the computation of two offsets instead of one generally cannot be
brick boundary
sample
(a)
brick boundary
sample
(b)
Figure 3: Access patterns during resampling and gradient computation. (a) typical access pattern during resampling (8neighborhood). (b) typical access pattern during gradient computation (26-neighborhood).
neglected. In a linear volume layout, the offsets to neighboring samples are constant. Using bricking, the whole address computation would have to be performed for each neighboring sample that has to be accessed. To avoid this performance penalty, one can construct an if-else statement. The if-clause consists of checking if the needed data elements can be addressed within one block. If the outcome is true, the data elements can be addressed as fast as in a linear volume. If the outcome is false, the costly address calculations have to be done. This simplifies address calculation, but the involved if-else statement incurs expensive pipeline flushes on almost all current computer architectures. We therefore apply a different approach [4]. We distinguish the possible sample positions by the locations of the needed neighboring samples. The first sample location (i, j, k) is defined by the integer parts of the current resample position. Assuming trilinear interpolation, during resampling neighboring samples to the right, top, and back of the current location are required. A block can be subdivided into subsets. For each subset, we can determine the blocks in which the neighboring samples lie. Therefore, it is possible to store these offsets in a lookup table. This is illustrated in Figure 3 (a). We see that there are four basic cases, which can be derived from the current sample location. This can be mapped straightforwardly to 3D, which gives eight distinct cases. The input parameters of the lookup table addressing function are the sample position (i, j, k) and the block dimensions Bx , By , and Bz . We assume that the block dimensions are a power of two, i.e., Bx = 2Nx , By = 2Ny , and Bz = 2Nz . As a first step, the block offset part from i, j, and k is extracted by a conjunction with the corresponding B{x,y,z} −1. The next step is to increase all by one to move the maximum possible value of B{x,y,z} − 1 to B{x,y,z} . All the other possible values stay within the range [1, B{x,y,z} − 1]. Then a conjunction of the resulting value and the complement of B{x,y,z} − 1 is performed, which maps the input values to [0, B{x,y,z} ]. The last step is to add the three values and divide the result by the minimum of the block dimensions, which maps the result to [0,7]. This last division can be exchanged by a shift operation. In summary, the lookup table index for a position (i, j, k) is given by: i′ j′ k′ index
= = = =
((i & (Bx − 1)) + 1) & ∼ (Bx − 1) (( j & (By − 1)) + 1) & ∼ (By − 1) ((k & (Bz − 1)) + 1) & ∼ (Bz − 1) (i′ + j′ + k′ ) ≫ min(Nx , Ny , Nz )
(1)
We use & to denote a bitwise and operation, | to denote a bitwise or operation, ≫ to denote a right shift operation, and ∼ to denote a bitwise negation.
A similar approach can be done for gradient computation. We present a general solution for a 26-connected neighborhood. Here we can, analogous to the resample case, distinguish 27 cases. The first step is to extract the block offset, by a conjunction with B{x,y,z} − 1. Then we subtract one, and conjunct with B{x,y,z} + B{x,y,z} − 1, to separate the case if one or more components are zero. In other words, zero is mapped to 2 · B{x,y,z} − 1. All the other values stay within the range [0, B{x,y,z} − 2]. To separate the case of one or more components being B{x,y,z} − 1, we add 1, after the previous subtraction is undone by a disjunction with 1, without loosing the separation of the zero case. Now all the cases are mapped to {0, 1, 2} to obtain a ternary system. This is done by dividing the components by the corresponding block dimensions. These divisions can be replaced by faster shift operations. Then the three ternary variables are mapped to an index in the range of [0, 26]. In summary, the lookup table index computation for a position (i, j, k) is: i′ j′ k′ index
= = = =
(((((i & (Bx − 1)) − 1) & (2Bx − 1)) | 1) + 1) ≫ Nx ((((( j & (By − 1)) − 1) & (2By − 1)) | 1) + 1) ≫ Ny (((((k & (Bz − 1)) − 1) & (2Bz − 1)) | 1) + 1) ≫ Nz 9i′ + 3 j′ + k′ (2) The presented index computations can be performed efficiently on current CPUs, since they only consist of simple bit manipulations. The lookup tables can be used in raycasting on a bricked volume layout for efficient access to neighboring samples. The first table can be used if only the eight samples within a cell have to be accessed (e.g., if gradients have been pre-computed). The second table allows full access to a 26-neighborhood. Compared to the ifelse solution which has the costly computation of two offsets in the else branch, we get a speedup of about 30%. The benefit varies, depending on the block dimensions. For a 32 × 32 × 32 block size the else-branch has to be executed in 10% of the cases and for a 16 × 16 × 16 block size in 18% of the cases. Another possible option to simplify the addressing is to inflate each block by an additional border of samples from the neighboring blocks [8]. However, such a solution increases the overall memory usage considerably. For example, for a block size of 32 × 32 × 32 the total memory is increased by approximately 20%. This is an inefficient usage of memory resources and the storage redundancy reduces the effective memory bandwidth. Our approach practically requires no additional memory, as all blocks share one global address lookup table. 3.3 Traversal It is most important to ensure that data once replaced in the cache will not be required again to avoid thrashing. Law and Yagel have presented a thrashless distribution scheme for parallel raycasting [13]. Their scheme relies on an object space subdivision of the volume. While their method was essentially developed in the context of parallelization, to avoid redundant distribution of data blocks over a network, it is also useful for a single-processor approach. The volume is subdivided into blocks. These blocks are then sorted in front-to-back order depending on the current viewing direction. The ordered blocks are placed in a set of block lists in such a way that no ray that intersects a block contained in a block list can intersect another block from the same block list. Each block holds a list of rays whose current resample position lies within the block. The rays are initially assigned to the block which they first intersect. The blocks are then traversed in front-to-back order by sequentially processing the block lists. The blocks within one block list can be processed in any order, e.g., in parallel. For each block, all rays contained in its list are processed. As soon as a ray leaves a block, it is removed from its ray list and added to the new block’s ray list.
6 7
advancing ray-front
simultaneously processed blocks
8 9 10 11
5 6 7 8 9 10 4 5 6 7 8 9 3 4 5 6 7 8 2 3 1 2
4 5 6 3 4 5
7 6
image plane
Figure 4: Blockwise raycasting scheme. A ray-front is advancing through the volume processing one list of blocks in each pass. The numbers inside the blocks identify their block list.
1
2
2
1
2
3
3
2
2
3
3
2
1
2
2
1
blocklist number
viewing direction
Figure 5: Front-to-back orders of blocks. In an interval of 90 degrees of the viewing direction the front-to-back order remains constant. The numbers inside the blocks identify their block list, and thus the designated processing order.
When the ray list of a block is empty, processing is continued with the next block. Figure 4 illustrates this approach. Due to the subdivision of the volume, it is very likely that a block entirely remains in a fast cache while its rays are being processed, provided the block size is chosen appropriately. The generation of the block lists does not have to be performed for each frame. For parallel projection there are eight distinct cases where the order of blocks which have to be processed remains the same. Thus, the lists can be pre-computed for these eight cases. Figure 5 shows this for 2D where there are four cases. 4
PARALLELIZATION H ARDWARE
S TRATEGIES
FOR
C OMMODITY
Raycasting has always posed a challenge on hardware resources. Thus, numerous approaches for parallelization have been presented. As our target platform is consumer hardware, we have focused on two parallelization schemes available in current stand-alone PCs: Symmetric Multiprocessing (SMP) and Simultaneous Multithreading (SMT). 4.1 Symmetric Multiprocessing Architectures using multiple similar processors connected via a high-bandwidth link and managed by one operating system are referred to as Symmetric Multiprocessing systems. Each processor has equal access to I/O devices. As Law and Yagel’s traversal scheme was originally developed for parallelization, it is straightforward to apply to SMP architectures. The blocks in each of the
rays with same subsequent block
Figure 6: Concurrency problem in parallel block processing. The two highlighted blocks are processed by different CPUs. When both CPUs try to add their rays to the next block’s ray list, race conditions can occur.
block lists described in Section 3.3 can be processed simultaneously. Each list is partitioned among the count physical CPUs available. A possible problem occurs when rays from two simultaneously processed blocks have the same subsequent block, as shown in Figure 6. As blocks processed by different CPUs can contain rays which have the same subsequent block, race conditions occur when both CPUs simultanously try to assign rays to the ray list of one block. One way of handling these cases would be to use synchronization primitives such as mutexes or critical sections to ensure that only one thread can assign rays at a time. However, the required overhead can decrease the performance drastically. Therefore, to avoid race conditions when two threads try to add rays to the ray list of a block, each block has a ray list for every physical CPU. When a block is being processed, the rays of all these lists are cast. When a ray leaves the block, it is added to the new block’s ray list corresponding to the CPU currently processing the ray. The basic algorithm processes the pre-generated block lists in passes. The ProcessVolume procedure (see Algorithm 1) is executed by the main thread and distributes the blocks of each pass among the available processors. It starts the execution of ProcessBlocks (see Algorithm 2) in a thread for each of the processors. ProcessBlocks traverses the list of blocks assigned to a processor and processes the rays of each block. ProcessRay performs resampling, gradient estimation, shading, and compositing for a ray, until it leaves the current block or is terminated for another reason (e.g., early ray termination). It returns true if the ray enters another block and false if no further processing of the ray is necessary. ComputeBlock returns the new block of a ray when it has left the current block. In the listed procedures, count physical is the number of physical CPUs in the system. Algorithm 1 ProcessVolume(blocklists) for all lists l in blocklists do Partition l = l0 ∪ ... ∪ lcount physical −1 for i = 0 to count physical − 1 do Begin execution of ProcessBlocks(li ,i) in thread Ti+1 on physical CPU i end for Wait for threads T1 ,...,Tcount physical to finish end for
4.2 Simultaneous Multithreading Simultaneous Multithreading is a well-known concept in workstation and mainframe hardware. It is based on the observation that
Algorithm 2 ProcessBlocks(blocklist,id physical )
physical CPU 0
for all blocks b in blocklist do for i = 0 to count physical − 1 do for all rays r in b.raylist[i] do if ProcessRay(r) then {the ray has entered another block} Remove(b.raylist[i],r) newBlock = ComputeBlock(r) Insert(newBlock.raylist[id physical ],r) else {the ray has been terminated or has left the volume} Remove(b.raylist[i],r) end if end for end for end for
logical CPU 0 T3
advancing ray-front
T1 T4 logical CPU 1
T0 logical CPU 2 T5 image plane
T2 T6 logical CPU 3
the execution resources of a processor are rarely fully utilized. Due to memory latencies and data dependencies between instructions, execution units have to wait for instructions to finish. While modern processors have out-of-order execution units which reorder instructions to minimize these delays, they rarely find enough independent instructions to exploit the processor’s full potential. SMT uses the concept of multiple logical processors which share the resources (including caches) of just one physical processor. Executing two threads simultaneously on one processor has the advantage of more independent instructions being available, and thus leads to more efficient CPU utilization. Intel’s SMT implementation is called Hyper-Threading [14] and was first available on the Pentium 4 CPU. Currently, two logical CPUs per physical CPU are supported. Exploiting SMT, however, is not as straight-forward as it may seem at first glance. Since the logical processors share caches, it is essential that the threads operate on neighboring data items. Therefore, treating the logical CPUs in the same way as physical CPUs leads to little or no performance increase. Instead, it might even lead to a decrease in performance, due to cache thrashing. Thus, the processing scheme has to be extended in order to allow multiple threads to operate within the same block. The blocks are distributed among physical processors as described in the previous section. Within a block, multiple threads, each executing on a logical CPU, simultaneously process the rays of the block. Using several threads to process the ray list of a block would lead to race conditions and would therefore require expensive synchronization. Thus, instead of each block having just one ray list for every physical CPU, we now have countlogical lists per physical CPU, where countlogical is the number of threads that will simultaneously process the block, i.e., the number of logical CPUs per physical CPU. Thus, each block has count physical · countlogical ray lists. The basic algorithm described in the previous section is extended in the following way: The ProcessBlocks procedure (see Algorithm 3) now starts the execution of ProcessRays for each logical CPU of the physical CPU it is executed on. ProcessRays (see Algorithm 4) processes the rays of a block for one logical CPU. All other routines remain unchanged.
physical CPU 1
Figure 7: Simultaneous Multithreading enabled raycasting. The work is distributed among the threads Ti executing on different logical CPUs.
Algorithm 4 ProcessRays(block,id physical ,idlogical ) for i = 0 to count physical − 1 do for all rays r in block.raylist[i][idlogical ] do if ProcessRay(r) then {the ray has entered another block} Remove(currentBlock.raylist[i][id physical ],r) blocknew = ComputeBlock(r) Insert(blocknew .raylist[id physical ][idlogical ],r) else {the ray has been terminated or has left the volume} Remove(block.raylist[i][idlogical ],r) end if end for end for
Figure 7 depicts the operation of the algorithm for a system with two physical CPUs, each allowing simultaneous execution of two threads, i.e. count physical = 2 and countlogical = 2. In the beginning seven treads, T0 , ..., T6 , are started. T0 performs all the preprocessing. In particular, it has to assign the rays to those blocks through which the rays enter the volume first. Then it has to choose the lists of blocks which can be processed simultaneously, with respect to the eight to distinguish viewing directions. Each list is partitioned by T0 and sent to T1 and T2 . After a list is sent, T0 sleeps until its slaves are finished. Then it continues with the next pass. T1 sends one block after the other to T3 and T4 . T2 sends one block after the other to T5 and T6 . After a block is sent, they sleep until their slaves are finished. Then they send the next block to process, and so on. T3 , T4 , T5 , and T6 perform the actual raycasting. Thereby T3 and T4 simultaneously process one block, and T5 and T6 simultaneously process one block.
Algorithm 3 ProcessBlocks(blocklist,id physical ) for all blocks b in blocklist do for i = 0 to countlogical − 1 do Begin execution of ProcessRays(b,id physical ,i) in thread Tid physical ·countlogical +i+1 on logical CPU i of physical CPU id physical end for Wait for threads Tid physical ·countlogical +1 ,...,Tid physical ·countlogical +countlogical to finish end for
5
M EMORY TURES
E FFICIENT ACCELERATION DATA S TRUC -
Applying efficient memory access and parallelization techniques still is not sufficient to efficiently handle the huge processing loads caused by large datasets. We present algorithmic optimizations to reduce this workload. We introduce three techniques which each can achieve a significant reduction of rendering times. Our goal
was to minimize the additional memory requirements of newly introduced data structures. 5.1 Gradient Cache It has been argued that the quality of the final image is heavily influenced by the gradients used in shading [17]. High-quality gradient estimation methods have been developed, which are generally more expensive due to the large neighborhood they use [19]. Many approaches therefore use expensive gradient estimation techniques to precompute gradients at the grid positions and store them together with the original samples. The additional memory requirements, however, limit the application of this approach to large datasets. For example, using 2 bytes for each component of the gradient increases the size of the dataset by a factor of four (assuming 2 bytes are used for the original samples). In addition to the increased memory demands of precomputed gradients, this approach also reduces the effective memory bandwidth. We therefore choose to perform gradient estimation on-the-fly. Consequently, when using an expensive gradient estimation method, caching of intermediate results is inevitable if high performance has to be achieved. An obvious optimization is to perform gradient estimation only once for each cell. When a ray enters a new cell, the gradients are computed at all eight corners of the cell. The benefit of this method is dependent on the number of resample locations per cell, i.e., the object sample distance. However, the computed gradients are not reused for other cells. This means that each gradient typically has to be computed eight times, as illustrated in Figure 8. For expensive gradient estimation methods, this can considerably reduce the overall performance. It is therefore important to store the results in a gradient cache. However, allocating such a cache for the whole volume still has the mentioned memory problem. Our blockwise volume traversal scheme allows us to use a different approach. We perform gradient caching on a block basis. The cache is able to store one gradient entry for every grid position contained in a cell of the current block. Thus, the required cache size is (Bx + 1) × (By + 1) × (Bz + 1) where Bx , By , Bz are the block dimensions. The block dimensions have to be increased by one to enable interpolation across block boundaries. Each entry of the cache stores the three components of a gradient, using a 4 byte single precision floating-point number for each component. Additionally, a bit array has to be stored that encodes the presence of an entry in the cache for each grid position in a cell of the current block. When a ray enters a new cell, for each of the eight corners of the cell the bit set is queried. If the result of a query is zero, the gradient is computed and written into the cache. The corresponding value of the bit set is set to one. If the result of the query is one, the gradient is already present in the cache and is retrieved. The disadvantage of this approach is that gradients at block borders have to be computed multiple times. However, this caching scheme still greatly reduces the performance impact of gradient computation and requires only a modest amount of memory. Furthermore, the required memory is independent of the volume size, which makes this approach applicable to large datasets. 5.2 Entry Point Buffer One of the major performance gains in volume rendering can be achieved by quickly skipping data which is classified as transparent. In particular, it is important to begin sampling at positions close to the data of interest, i.e., the non-transparent data. This is particularly true for medical datasets, as the data of interest is usually surrounded by large amounts of empty space (air). The idea is to find, for every ray, a position close to its intersection point with
rays
resample locations
Figure 8: Redundant gradient computation at grid positions. Without caching, the gradient at the highlighted grid position has to be recomputed multiple times. block
template
image plane
Figure 9: Block template generation. The block is projected onto the image plane, its depth values are rasterized and stored in a template image.
the visible volume, thus, we refer to this search as entry point determination. The advantage of entry point determination is that it does not require additional overhead during the actual raycasting process, but still allows to skip a high percentage of empty space. The entry points are determined in the ray setup phase and the rays are initialized to start processing at the calculated entry position. The basic goal of entry point determination is to establish a buffer, the entry point buffer, which stores the position of the first intersection with the visible volume for each ray. As blocks are the basic processing units of our algorithm, the first step is to find all blocks which do not contribute to the visible volume using the current classification, i.e., all blocks that only contain data values which are classified as transparent. It is important that the classification of a whole block can be calculated quickly to allow interactive transfer function modification. We store the minimum and maximum value of the samples contained in a block and use a summed area table of the opacity transfer function to determine the visibility of the block [12, 11]. We then perform a projection of each non-transparent block onto the image plane with hidden surface removal to find the first intersection point of each ray with the visible volume [25]. The goal is to establish an entry point buffer of the same size as the image plane, which contains the depth value for each ray’s intersection point with the visible volume. For parallel projection, this step can be simplified. As all blocks have exactly the same shape, it is sufficient to generate one template by rasterizing the block under the current viewing transformation (see Figure 9). Projection is performed by trans-
where N is the depth of the octree, octanti is the octant of level i where the node is located. For an octree of depth N there are 8N different indices. The relative translational offsets for the octree nodes can be precomputed and stored in a lookup table of 8N entries indexed by the node index. 5.3 Cell Invisibility Cache
(a)
(b)
Figure 10: Block and octree projection. (a) projection of nontransparent blocks. (b) projection of non-transparent octree nodes.
lating the template by a vector t = (tx ,ty ,tz )T which corresponds to the block’s position in three-dimensional space in viewing coordinates. Thus, tx and ty specify the position of the block on the image plane (and therefore the location where the template has to be written into the entry point buffer) and tz is added to the depth values of the template. The Z-buffer algorithm is used to ensure correct visibility. In ray setup, the depth values stored in the entry point buffer are used to initialize the ray positions. The disadvantage of this approach is that it requires an addition and a depth test at every pixel of the template for each block. This can be greatly reduced by choosing an alternative method.The blocks are projected in back-to-front order. The back-to-front order can be easily established by traversing the generated block lists (see Section 3.3) in reverse order. For each block the Z-value of the generic template is written into the entry point buffer together with a unique index of the block. After the projection has been performed, the entry point buffer contains the indices and relative depth values of the entry points for each ray. In ray setup, the block index is used to find the translation vector t for the block and tz is added to the relative depth value stored in the buffer to find the entry point of the ray. The addition only has to be performed for every ray that actually intersects the visible volume. We further extend this approach to determine the entry points in a finer resolution than block granularity. We replace the minimum and maximum values stored for every block by a min-max octree. Its root node stores the minimum and maximum values of all samples contained in the block. Each additional level contains the minimum and maximum value for smaller regions, resulting in a more detailed description of parameter variations inside the block. The resulting improvement in entry point determination is depicted in Figure 10. Every time the classification changes, the summed area table is recursively evaluated for each octree node and the classification information is stored as linearized octree bit encoding using hierarchy compression. The projection algorithm is modified as follows. Instead of one block template there is now a template for every octree level. The projection of one block is performed by recursively traversing the hierarchical classification information in back-to-front order and projecting the appropriate templates for each level, if the corresponding octree node is non-transparent. In addition to the block index, the entry point buffer now also stores an index for the corresponding octree node. In ray setup, the depth value in the entry point buffer is translated by the the tz component of the translation vector plus the sum of the relative offsets of the node in the octree. The node index encodes the position of a node’s origin within the octree. It can be calculated in the following way: N−1
index(node) =
∑ octanti (node) · 8N−i−1
i=0
(3)
We introduce a cell invisibility cache to skip the remaining transparent regions at cell level. We can skip the resampling and compositing in a cell if all eight samples of the cell are classified as transparent. To determine the transparency, a transfer-function lookup has to be performed for each of these samples. For large zoom factors, several rays can hit the same cell and for each of these rays the same lookups would have to be performed. A cell invisibility cache is attached at the beginning of the traditional volume raycasting pipeline. This cache is initialized in such a way that it reports every cell as visible. In other words every cell has to be classified. Now, if a ray is sent down the pipeline, every time a cell is classified invisible this information is stored in the cache. If a cell is found to be invisible, this information is stored by setting the corresponding bit in the cell invisibility cache. As the cache stores the combined information for eight samples of a cell in just one bit, this is more efficient than performing a transfer function lookup for each sample. The information stored in the cell invisibility cache remains valid as long as no transfer function modifications are performed. During the examination of the data, e.g., by changing the viewing direction, the cache fills up and the performance increases progressively. The advantage of this technique is that no extensive computations are required when the transfer function changes. The reset of the buffer can be performed with virtually no delay, allowing fully interactive classification. As transfer function specification is a non-trivial task, minimizing delays initiated by transfer function modifications greatly increases usability. 6
R ESULTS
We performed a comprehensive performance evaluation of the proposed techniques. The results were obtained by thorough experiments on diverse hardware. 6.1 Memory Management for Large Datasets For a comparison of bricked and linear volume layouts, we used a Dual Intel Pentium Xeon 2.4 GHz equipped with 512 KB level-2 cache, 8 KB level-1 data cache, and 1 GB of Rambus memory. In our system, we are able to support different block sizes, as long as each block dimension is a power of two. If we set the block size to the actual volume dimensions, we have a common raycaster which operates on a simple linear volume layout. This enables us to make a meaningful comparison between a raycaster which operates on simple linear volume layout and a raycaster which operates on a bricked volume layout. To underline the effect of bricking we benchmarked different block sizes. Figure 11 shows the actual speedup achieved by blockwise raycasting. For testing, we specified a translucent transfer-function, such that the impact of all high level optimizations was overridden. In other words, the final image was the result of brute-force raycasting of the whole data. The size of the dataset had no influence on the actual optimal gains. Going from left to right in the chart shown in Figure 11, first we have a speedup of about 2.0 with a block size of 1 KB. Increasing the block size up to 64 KB also increases the speedup. This is due to more efficient use of the cache. The chart shows an optimum at a block size of 64KB (32×32×32) with a speedup of about 2.8. This number is the optimal tradeoff between the needed cache space for
zoomfactor 1.0
2.8
2
bricking overhead affects speedup
simple linear volume layout
1
1
8
64
512
4096 32768
15
15
15
10
10
10
5
5
5
1.0 0.75 0.5 0.125
1.0 0.75 0.5 0.125
block size in KB
27.0
CPUs
SMT
one
off on
speedup
computation time
two
off
2 threads
two
on
4 threads
7.9 5.4 1.0 0.75 0.5 0.125
no caching
cell caching
block caching
Figure 13: Comparison of different gradient caching strategies.
1.00
1 thread 2 threads
14.9
object sample distance
Figure 11: Block-based raycasting speedup compared to raycasting on a linear volume layout.
one
zoomfactor 2.0
optimal block size 3
render time in seconds
speedup factor
zoomfactor 0.5 4
30% savings 49% savings 64% savings
1.42 1.96 2.78
Figure 12: Symmetric Multiprocessing and Simultaneous Multithreading speedups.
ray data structures, sample data, and lookup tables. Larger block sizes lead to performance decreases, as they are too large for the cache, but still suffer from the overhead caused by bricking. This performance drop-off is reduced, once the block size approaches the volume size. With only one volume-sized block, the rendering context is that of a common raycaster operating on a linear volume layout. 6.2 Parallelization Strategies for Commodity Hardware To evaluate the performance of our parallelization strategies, we used the same test system as in the previous section. This system has two CPUs and supports Hyper-Threading. Our system is able to force threads on specific physical and logical CPUs. By following this mechanism we tested different configurations to obtain figures for the speedup achieved by the presented techniques. All test runs consistently showed the same speedup factors. The achieved speedups for Symmetric Multiprocessing and Simultaneous Multithreading are shown in Figure 12. Testing Simultaneous Multithreading on only one CPU showed an average speedup of 30%. While changing the viewing direction, the speedup varies from 25% to 35%, due to different transfer patterns between the level 1 and the level 2 cache. Whether HyperThreading is enabled or disabled, adding a second CPU approximately reduces the computational time by 50%, i.e., Symmetric Multiprocessing and Simultaneous Multithreading are independent. This shows that our Simultaneous Multithreading scheme scales very well on multi-processor machines. The Hyper-Threading benefit of approximately 30% is maintained if the second hyperthreaded CPU is enabled. 6.3 Memory Efficient Acceleration Data Structures To demonstrate the impact of our high-level optimizations we used a commodity notebook system equipped with an Intel Centrino 1.6 GHz CPU, 1 MB level 2 cache, and 1 GB RAM. This system has
one CPU and does not support Hyper-Threading so the presented results only reflect performance increases due to our high-level acceleration techniques. The memory consumption of the gradient cache is not related to the volume dimensions, but determined by the fixed block size. We use 32 × 32 × 32 sized blocks, the size of the gradient cache therefore is is (33)3 · 3 · 4 byte ≈ 422 KB. Additionally we store for each cache entry a validity bit, which adds up to 333 /8 bytes ≈ 4.39 KB. Figure 13 shows the effect of per block gradient caching compared to per cell gradient caching and no gradient caching at all. Per cell gradient caching means that gradients are reused for multiple resample locations within a cell. We chose an adequate opacity transfer function to enforce translucent rendering. The charts from left to right show different timings for object sample distances from 1.0 to 0.125 for three different zoom factors 0.5, 1.0, and 2.0. In case of zoom factor 1.0 we have one ray per cell, already here per block gradient caching performs better than per cell gradient caching. This is due to the shared gradients between cells. For zooming out (0.5) both gradient caching schemes perform equally well. The rays are so far apart that nearly any gradients are shared. On the other hand, for zooming in (2.0), per block caching performs much better than per cell caching. This is due to the increased number of rays per cell. For this zoom factor, per brick gradient caching achieves a speedup of approximately 3.0 compared to no gradient caching at a typical object sample distance of 0.5 The additional memory usage of the acceleration data structures is rather low. The cell invisibility cache has a size of 323 bit = 4096 byte. The min-max octree has a depth of three storing 4 byte at each node (a 2 byte minimum and maximum value) and requires at most 2340 byte. Additionally, the classification information is stored, which requires 66 byte. We use blocks of size 32 × 32 × 32 storing 2 bytes for each sample, which is a total of 65536 bytes. Our data structures increase the total memory requirements by approximately 10%. Figure 14 compares our acceleration techniques for three large medical datasets. In the fourth column of the table, the render times for entry point determination using block granularity is displayed. Column five shows the render times for octree based entry point determination. In the fifth column, the render times for octree based entry point determination plus cell invisibility caching are displayed. Typically, about 2 frames/second are achieved for these large data sets.
Visible Male
aorta
lower extremities
[6]
[7]
[8]
[9] (a)
Image (a) (b) (c) (d) (e)
(b)
Dimensions 587 × 341 × 1878 587 × 341 × 1878 512 × 512 × 1112 512 × 512 × 1202 512 × 512 × 1202
(c)
Size 0.70 GB 0.70 GB 0.54 GB 0.59 GB 0.59 GB
(d)
Block 0.61 s 0.68 s 1.16 s 0.86 s 0.69 s
(e)
Octree 0.46 s 0.53 s 0.93 s 0.70 s 0.46 s
Cell 0.40 s 0.45 s 0.61 s 0.64 s 0.37 s
Figure 14: Acceleration techniques tested on different datasets. Column four lists the render times for entry point determination at block level. The fifth column gives the render times for entry point determination using octree projection. The last column lists render times for octree projection plus additional cell invisibility caching.
[10]
[11]
[12]
[13]
[14]
[15]
6.4 Visualization Results To demonstrate the applicability of the presented methods, we display visualization results for clinical datasets in Figures 15, 16, 17, and 18. The images show anatomic features and/or pathologies.
[16]
7
[17]
C ONCLUSION
We have presented different techniques for volume visualization of large datasets on commodity hardware. We have shown that efficient memory management is fundamental to achieve high performance. Our work on parallelization has demonstrated that wellknown methods for large parallel systems can be adapted and extended to exploit evolving technologies, such as Simultaneous Multithreading. Our memory efficient data structures provide frames per second performance even for large datasets. A key point of our work was to demonstrate that commodity hardware is able to achieve the performance necessary for real-world medical applications. In future work, we will investigate out-of-core and compression methods to permit the use of even larger datasets. R EFERENCES [1] S. Bruckner. Efficient volume visualization of large medical datasets. Master’s thesis, Vienna University of Technology, 2004. [2] B. Cabral, N. Cam, and J. Foran. Accelerated volume rendering and tomographic reconstruction using texture mapping hardware. In Proceedings of the Symposium on Volume Visualization 1994, pages 91– 98, 1994. [3] A. Van Gelder and K. Kim. Direct volume rendering with shading via three-dimensional textures. In Proceedings of the Symposium on Volume Visualization 1996, pages 23–30, 1996. [4] S. Grimm, S. Bruckner, A. Kanitsar, and E. Gr¨oller. A refined data addressing and processing scheme to accelerate volume raycasting. Computers & Graphics, 28(5), 2004. To appear. [5] S. Grimm, S. Bruckner, A. Kanitsar, and M. E. Gr¨oller. Flexible direct multi-volume rendering in dynamic scenes. In Proceedings of the 9th
[18]
[19]
[20]
[21]
[22]
[23]
[24]
[25]
[26]
International Fall Workshop on Vision, Modeling, and Visualization, 2004. To appear. S. Grimm, S. Bruckner, A. Kanitsar, and M. E. Gr¨oller. Memory efficient acceleration structures and techniques for cpu-based volume raycasting of large data. In Proceedings of the 9th IEEE/SIGGRAPH Symposium on Volume Visualization and Graphics, 2004. To appear. T. G¨unther, C. Poliwoda, C. Reinhart, J. Hesser, R. M¨anner, H.-P. Meinzer, and H.-J. Baur. VIRIM: A massively parallel processor for real-time volume visualization in medicine. Computers & Graphics, 19(5):705–710, 1995. S. Guthe, M. Wand, J. Gonser, and W. Straßer. Interactive rendering of large volume data sets. In Proceedings of Visualization 2002, pages 53–60, 2002. G. Knittel. The UltraVis system. In Proceedings of the Symposium on Volume Visualization 2000, pages 71–79, 2000. J. Kr¨uger and R. Westermann. Acceleration techniques for GPU-based volume rendering. In Proceedings of Visualization 2003, pages 287– 292, 2003. P. Lacroute. Fast Volume Rendering Using a Shear-Warp Factorization of the Viewing Transformation. PhD thesis, Stanford University, Computer Systems Laboratory, 1995. P. Lacroute and M. Levoy. Fast volume rendering using a shearwarp factorization of the viewing transformation. Computer Graphics, 28(Annual Conference Series):451–458, 1994. A. Law and R. Yagel. Multi-frame thrashless ray casting with advancing ray-front. In Proceedings of Graphics Interfaces 1996, pages 70–77, 1996. D. Marr, F. Binns, D. Hill, G. Hinton, D. Koufaty, J. Miller, and M. Upton. Hyper-threading technology architecture and microarchitecture. Intel Technology Journal, 6(1):4–15, 2002. M. Meißner, U. Hoffmann, and W. Straßer. Enabling classification and shading for 3D texture mapping based volume rendering using OpenGL and extensions. In Proceedings of Visualization 1999, pages 207–214, 1999. M. Meißner, U. Kanus, G. Wetekam, J. Hirche, A. Ehlert, W. Straßer, M. Doggett, and R. Proksa. VIZARD II: A reconfigurable interactive volume rendering system. In Proceedings of the Workshop on Graphics Hardware 2002, pages 137–146, 2002. T. M¨oller, R. Machiraju, K. Mueller, and R. Yagel. A comparison of normal estimation schemes. In Proceedings of Visualization 1997, pages 19–26, 1997. B. Mora, J.-P. Jessel, and R. Caubet. A new object-order ray-casting algorithm. In Proceedings of Visualization 2002, pages 203–210, 2002. L. Neumann, B. Cs´ebfalvi, A. K¨onig, and M. E. Gr¨oller. Gradient estimation in volume data using 4D linear regression. In Proceedings of Eurographics 2000, pages 351–358, 2000. R. Osborne, H. Pfister, H. Lauer, N. McKenzie, S. Gibson, W. Hiatt, and T. Ohkami. EM-Cube: An architecture for low-cost real-time volume rendering. In Proceedings of the Workshop on Graphics Hardware 1997, pages 131–138, 1997. S. Parker, M. Parker, Y. Livnat, P.-P. Sloan, C. Hansen, and P. Shirley. Interactive ray tracing for volume visualization. IEEE Transactions on Visualization and Computer Graphics, 5(3):238–250, 1999. H. Pfister, J. Hardenbergh, J. Knittel, H. Lauer, and L. Seiler. The volumepro real-time ray-casting system. In Proceedings of SIGGRAPH 1999, pages 251–260, 1999. H. Ray, H. Pfister, D. Silver, and T. A. Cook. Ray casting architectures for volume visualization. IEEE Transactions on Visualization and Computer Graphics, 5(3):210–223, 1999. S. Roettger, S. Guthe, D. Weiskopf, T. Ertl, and W. Strasser. Smart hardware-accelerated volume rendering. In Proceedings of the Joint EUROGRAPHICS - IEEE TCVG Symposium on Visualisation 2003, pages 231–238, 2003. R. Srinivasan, S. Fang, and S. Huang. Volume rendering by templatebased octree projection. In Proceedings of the Workshop on Visualization in Scientific Computing 1997, pages 155–163, 1997. R. Westermann and T. Ertl. Efficiently using graphics hardware in volume rendering applications. In Proceedings of SIGGRAPH 1998, pages 169–178, 1998.
Figure 15: CT scan of colon. Bones and colon are displayed in the top image. The bottom image shows the colon without bones.
Figure 17: CT scan of lumbar spine. A fracture of a lumbar vertebra is highlighted.
Figure 16: CT scan of heart. The myocardal muscle is displayed in red, the coronary vessels are depicted in yellow tones.
Figure 18: CT scan of abdomen. Through enhancement of the abdominal vascular structure an aorta aneurysma can be recognized.