Remote Visualization of Large Datasets with MIDAS and ParaViewWeb Julien Jomier∗ Kitware, SAS
Sebastien Jourdain† Kitware, Inc.
Utkarsh Ayachit‡ Kitware, Inc.
Charles Marion§ Kitware, SAS
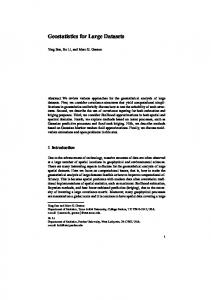
Figure 1: Integration of ParaViewWeb and the MIDAS system
Abstract
1 Introduction
In the recent years, the scientific community has been focusing on the management and dissemination of datasets. Challenged by the rapid growth in the number and size of scientific data and supported by new governmental policies, data sharing has become a necessary step in scientific discovery. In parallel, publishing companies have shifted their business to provide not only publications but also associated datasets to their readers. In fact, the publishing industry has been investigating ways to disseminate datasets and more importantly, to present this data to readers in a meaningful manner. In this paper, we present a combination of two leading technologies which allows for online exploration and visualization of scientific datasets. We have combined a digital archiving system, MIDAS, with an online parallel visualization framework, ParaViewWeb. The system has been deployed at several organizations and has been proven to facilitate knowledge dissemination across scientific teams.
In the past few years, several organizations have been acquiring infrastructure for high performance computing (HPC). HPC has allowed scientists and researchers to run more detailed simulations and, as a result, the data generated has become massive. While the current trends in infrastructure focus on scalability, data to be produced is going to get even larger and preponderant. For large simulations the data generated can actually become too massive to be stored and analyzed, and new techniques, such as coprocessing, also known as in situ processing, have been developed. To visualize massive datasets, tools like ParaView [Moreland et al. 2008], Visit [Lawrence Livermore National Laboratory 2011] or Ensight [CEI International 2011] can be used. However, as the data gets larger, it becomes more and more difficult to move the data across networks, especially when the server storing the data and the client are distant geographically. In the past two years, we have developed a framework for remote rendering, ParaViewWeb [Jourdain et al. 2010], which provides a thin-client connected to a ParaView server. The ParaViewWeb framework uses a message broker interface to communicate with the distant server; the visualization is performed directly on the remote server and images are streamed directly to the client. The client is implemented as a web interface that has been deployed on the major web browsers.
CR Categories: H.2.8 [Database Management]: Database Applications—Scientific databases; H.3.5 [Information Storage and Retrieval]: Online Information Services—Data sharing; H.3.7 [Information Storage and Retrieval]: Digital Libraries— Dissemination;
Data management remains an important issue for organizations, especially when the data is very large and contains sensitive information. Digital storage is actually a simple task and solutions have been developed since the beginning of the computing age: tape recording, data backup storage, etc.. Nowadays, the big challenge is to provide searchable, redundant and on-demand access to the data. Researchers do not want to wait a couple of hours in order to retrieve a dataset that has been stored on tape, instead they want to search and quickly access the dataset in order to process the data as soon as possible. In parallel, distributed storage systems, such as the Hadoop File System [The Apache Software Foundation 2011] and Amazon S3 [DeCandia et al. 2007] have emerged and are now easily accessible and maintainable. However, there are three barriers which limit the adoption of large storage systems. First, organizations often need a full time system administrator to manage and to
Keywords: Web 3D, remote rendering, data management, large data visualization, MIDAS, ParaView ∗
[email protected]
†
[email protected] ‡
[email protected] §
[email protected]
Copyright © 2011 by the Association for Computing Machinery, Inc. Permission to make digital or hard copies of part or all of this work for personal or classroom use is granted without fee provided that copies are not made or distributed for commercial advantage and that copies bear this notice and the full citation on the first page. Copyrights for components of this work owned by others than ACM must be honored. Abstracting with credit is permitted. To copy otherwise, to republish, to post on servers, or to redistribute to lists, requires prior specific permission and/or a fee. Request permissions from Permissions Dept, ACM Inc., fax +1 (212) 869-0481 or e-mail
[email protected]. I3D 2011, Paris, France, June 20 – 22, 2011. © 2011 ACM 978-1-4503-0774-1/11/0006 $10.00
147
ensure the reliability of the system; instead of a simple NAS server, a complex distributed environment composed of several nodes has to be supervised. Second, the customization of the infrastructure is not a trivial task; while simple storage servers often offer flexibility in terms of user interface and connectivity (Web, Samba, etc.), large distributed storage systems are usually monolithic applications which provide little room for customization. Third, storage is important but sorting and indexing are often critical in order to quickly get access to the data. For these reasons, we have developed MIDAS [Jomier et al. 2010], an open-source digital archiving system capable of handling not only large datasets but also the associated metadata and related information. MIDAS is an archiving framework which allows to easily build an end-user application.
and distributed engines. The MIDAS client is defined as a collection of interfaces to manage, search and access the data stored in the system. The current interfaces include a web interface, written in PHP with Web 2.0 technologies: Javascript, Flash and Java. MIDAS also provides a complete RESTful API and a C++ client library. MIDAS has been deployed at several institutions, including the National Cancer Institutes, the National Library of Medicine and the Optical Society of America. MIDAS provides a complete data management system, from uploading and storing the data, to searching and accessing them. However for large datasets the system becomes less usable by researchers because moving massive datasets to the remote client is just not possible. To overcome this issue, we have integrated ParaViewWeb with MIDAS.
However, the inter-connectivity between the storage and the postprocessing systems remains a gap in the data processing workflow. Because they are usually considered as two separate entities, postprocessing often requires loading the data over the network. This mechanism works well when the size of the data remains small or if the data is located at the post-processing system. However, when dealing with large datasets, this workflow is not suitable. Fortunately, recent projects have been addressing this challenge. For instance the Collaviz consortium [Dupont et al. 2010] has been developing a middleware which retrieves the data via streaming with remote compression algorithms. On the other hand the ParaViewWeb project moves the processing power to the server and relies on a thin client for visualization.
2.2 ParaViewWeb: The Web Visualization Framework
In order to provide a complete data management system for large datasets, we have combined ParaViewWeb with the MIDAS system. These systems are described next.
2
Components
In this section, we describe the different components in detail. First, we present the MIDAS and ParaViewWeb systems. Second, we show how we integrated ParaViewWeb into MIDAS. Third, we describe the current applications of the system. And finally, we present some future work and potential extensions.
2.1
Figure 2: The ParaViewWeb interface is written in HTML/Javascript. The visualization is provided either in Flash, Java or Javascript.
MIDAS: The Digital Archiving System ParaViewWeb is a framework composed of reusable components. These components implement server- and client-side functionalities. On the server side, the visualization server (PWServer) is a ParaView-based engine which generates the actual visualization either by itself or by connecting to a remote ParaView server running over a cluster with MPI. The web service component (PWService) manages communication between remote visualization servers (PWServer) and clients. The framework also provides administration web pages which allow users to monitor visualization sessions. On the client side, a JavaScript library is provided and allows to create remote visualizations and to manage them. Several visualization components have also been implemented in order to provide users with tools to visualize 3D content in the browser interactively. Using these components, developers can build complete websites or web portals with visualization and data processing capabilities. These components can be easily integrated into Rich Internet Applications (RIAs) developed using popular web designing infrastructures such as Dojo, Google Web Toolkit and Java. Figure 2 gives a schematic of the various components involved. The implementation requires any supporting Java-based Web Application server, which includes Apache Tomcat, an open source, freely available implementation.
Data management is a critical task for research centers and corporations. The service has to be reliable, secure and fast. For a long time, hospitals have adopted Picture Archiving and Communication Systems (PACS) in order to manage patient images generated by scanners as well as patients’ healthcare information. However, data management systems in other industries are not that trivial. First, each company has their own specificities and require different customizations; for instance some companies only want a reliable backup, while some requires a fast access to the data, etc.. Second, the diversity of archiving solutions makes it difficult to choose and to maintain the systems while keeping the data in a standard and interoperable form. We have developed MIDAS [Jomier et al. 2009], an open-source (BSD) web-based system for digital data management. MIDAS is a complete framework which provides the essential building blocks for data management while allowing for high customization. MIDAS integrates three main components: a database, a storage engine and a client interface. MIDAS interfaces with several databases through an abstraction layer. Currently MySQL [Oracle Corporation 2011] and PostgreSQL [PostgreSQL Global Development Group 2011] are supported, but we are currently working on extending the system to support NoSQL [Chang et al. 2006] databases. The storage interface is generic and allows to support various storage mechanisms, from regular file systems to parallel
PWService is a web-application that is deployed on the web server and is accessible using a specific URL determined at configuration time. Using JSON-RPC, a simple JSON (JavaScript Object Nota-
148
when available, or by direct copying to a shared storage. One can notice that MIDAS can also initiate the transfer using standard file transfer tools, such as FTP or SCP. Once the data is transfered to the visualization server, MIDAS establishes a direct connection to ParaViewWeb using the Javascript API. Then, MIDAS asks ParaViewWeb to load and render the dataset. Since MIDAS is mainly written in HTML and Javascript, we have decided to use the Javascript render window in MIDAS. This also allows us to run the system on mobile devices not supporting Flash technology.
Figure 3: ParaViewWeb remote rendering pipeline.
tion) based protocol for remote procedure calls, clients can make calls to the PWService in order to start new instances of PWServer, monitor running PWServer instances, and send JSON messages to a PWServer. Messages sent to a PWServer allow for the construction of the visualization pipeline and also to communicate the mouse interactions.
3 Applications 3.1 Interactive Science Publishing In October 2008, the Optical Society of America (OSA) launched the first interactive scientific publishing (ISP) system [The Optical Society of America 2008]. This initiative allows scientists to expand upon traditional research results by providing software for interactively viewing underlying source data. The ISP system enhances standard scientific publishing by adding interactive visualization.
PWServer is a ParaView-based process that can be regarded as a headless ParaView application that can respond to the JSON messages sent from the PWService. The communication between PWService and PWServer is done via a Java Message Service (JMS). The protocol is still JSON-RPC based even though the communication is over JMS. The PWServer is the visualization engine. PWServer can be set up to use MPI to perform parallel data processing and rendering over a cluster or as a single process. The PWServer is responsible for data processing and rendering. For each separate visualization session, a separate PWServer process is spawned. The PWService handles the management of the PWServer instances whether they run locally or on a remote cluster involving MPI internal communications. Table 4 shows the framerates obtained with the different client technologies (Java, Flash and Javascript) and different network speeds.
LAN ADSL Distant networks
Server 100fps 100fps 30fps
Java 50-100fps 30-50fps 5-20fps
Javascript 20-50fps 15-25fps 5-15fps
Flash 20-50fps 15-25fps NA
Using ISP, authors have the ability to create 3-dimensional visualizations of their datasets, add 3-dimensional annotations and measurements and make the datasets available to reviewers and readers. The system has two main components: the archiving system and the visualization software. A customized version of MIDAS provides the data storage, delivers low-resolution datasets for pre-visualization, and in the background serves the full-resolution dataset. The second component, the ISP visualization software, interacts directly with the MIDAS system in order to retrieve stored datasets. Readers of an ISP-enabled manuscript can automatically launch the ISP software by clicking on a web link directly in the PDF. Within ten seconds, a low-resolution dataset is loaded from MIDAS and can be interactively manipulated in 3D via the ISP software.
Figure 4: Rendering framerate for different clients and network speeds for a small 3D image volume (10x10x10) rendered at 600x600
2.3
Integration
Two main challenges arise with the integration of MIDAS and ParaViewWeb. The first challenge is to make the datasets stored in MIDAS available to the visualization engine and the second challenge is to integrate the visualization interface into MIDAS while providing a seamless interface to the user. We have decided to use MIDAS as the main front-end to the system, therefore making ParaViewWeb transparent to the users. In a typical scenario, the user browses the data via the MIDAS web interface and selects the data to visualize. Then, the data is shared with the ParaViewWeb system which renders the data and pushes the final image to MIDAS.
Figure 5: Prototype integration of OSA’s interactive science publishing based on MIDAS with ParaViewWeb. This first version of ISP uses the MIDAS Web API in order to communicate with MIDAS and transfer the dataset to the remote client. However, the main challenge remains the size of the datasets to be visualized. With a traditional client/server setup where the rendering is done on the client, the data has to be sent across the network which usually forces the author to either crop or subsample the original data. By adding ParaViewWeb to the ISP system we are allowing readers to manipulate massive datasets and explore raw data without having to resort to a lower resolution. The remote rendering provides a faster and a more integrated experience. In fact, the data is directly embedded in the HTML article, with no need to
The ParaViewServer currently only loads files via a file system, therefore one way to achieve file sharing is to have MIDAS export the selected dataset via a shared file system, such as Samba, NFS, etc.. The other approach would be to implement a remote loader on the ParaViewServer and use the MIDAS RESTful API to load the data. However, ParaViewWeb and MIDAS are often located on the same internal network and a shared file system is an optimal solution. In this case, when a user click on a dataset to be visualized, MIDAS automatically exports the datasets (or group of datasets) to ParaViewWeb. The export can be done either by symbolic linking,
149
click in the PDF and have a separate application as shown in Figure 5. However the system presents some drawbacks. First, remote rendering assumes that you always have connectivity and, therefore offline rendering is not possible. Second, high quality rendering is sometimes necessary and particularly difficult to achieve via distant rendering. Third and last, the infrastructure needed to support remote rendering is much more expensive compared to client rendering only. For all these reasons, it appears that a hybrid system combining remote and client rendering would allow for the greatest flexibility. We are currently working on defining this technology.
mote sites. Fourth and last, we are investigating the integration of MIDAS with the libraries created from the Collaviz project in order to provide a hybrid system with server-side rendering for large datasets and client-side rendering for low-to-medium size datasets.
The OSA and the NLM have collaborated with Kitware to provide this service. OSA’s MIDAS repository [The Optical Society of America 2008] currently hosts more than 30 ISP manuscripts with over 20GB of associated data. These datasets are made freely available as open-access to the scientific community.
CEI I NTERNATIONAL, 2011. Ensight gold http:///www.ceintl.com/products.
3.2
Portions of this work were supported by DOE SBIR Phase II Award DE-FG02-08ER85143 and NIH STTR Phase II Award 2R42NS059095-03.
References
C HANG , F., D EAN , J., G HEMAWAT, S., H SIEH , W. C., WAL LACH , D. A., B URROWS , M., C HANDRA , T., F IKES , A., AND G RUBER , R. E. 2006. Bigtable: a distributed storage system for structured data. In Proceedings of the 7th USENIX Symposium on Operating Systems Design and Implementation - Volume 7, USENIX Association, Berkeley, CA, USA, OSDI ’06, 15–15.
The Give-A-Scan project
Give A Scan [The Lung Cancer Alliance 2009] is the world’s first patient-powered, publicly available archive of images and clinical data on lung cancer patients. All the data has been donated by patients in order to encourage more researchers to focus on lung cancer and to accelerate progress in the early detection, diagnosis and treatment of lung cancer, which is now the leading cause of cancer deaths worldwide. In 2009, Kitware and the Lung Cancer Alliance developed the Give-A-Scan system based on MIDAS. The system currently hosts a dozen patients and more datasets are currently being curated.
D E C ANDIA , G., H ASTORUN , D., JAMPANI , M., K AKULAPATI , G., L AKSHMAN , A., P ILCHIN , A., S IVASUBRAMANIAN , S., VOSSHALL , P., AND VOGELS , W. 2007. Dynamo: amazon’s highly available key-value store. In Proceedings of twentyfirst ACM SIGOPS symposium on Operating systems principles, ACM, New York, NY, USA, SOSP ’07, 205–220. D UPONT, F., D UVAL , T., F LEURY, C., F OREST, J., G OURAN ´ , G., AND TON , V., L ANDO , P., L AURENT, T., L AVOU E S CHMUTZ , A. 2010. Collaborative Scientific Visualization: The COLLAVIZ Framework. In JVRC 2010 (2010 Joint Virtual Reality Conference of EuroVR - EGVE - VEC).
From this project, we learned that providing data to the research community is essential but the associated metadata is almost as important. For instance, knowing if the given scan corresponds to a male or a female is critical when running studies. The system has to provide an easy way to search and select the datasets with relevant information. We also learned is that visualization plays a big role in selecting the datasets. First, we tried a simple approach by providing an easy way to scroll through low resolution slices of the 3-dimensional volume. While this solution is effective for small datasets, it becomes unmanageable for larger volumes. With the integration of ParaViewWeb into MIDAS, we have been able to provide a quick and easy way for researchers to not only browse but also visualize the data before downloading it. The prototype system has shown huge improvements in terms of users’ experiences and has also opened some new capabilities, such as online volume rendering, a technique often used by clinicians and radiologists.
4
software.
J OMIER , J., AYLWARD , S. R., M ARION , C., L EE , J., AND S TYNER , M. 2009. A digital archiving system and distributed server-side processing of large datasets. In Society of PhotoOptical Instrumentation Engineers (SPIE) Conference Series, vol. 7264 of Society of Photo-Optical Instrumentation Engineers (SPIE) Conference Series. J OMIER , J., BAILLY, A., L E G ALL , M., AND AVILA , R. 2010. An open-source digital archiving system for medical and scientific research. Open Repositories (07). J OURDAIN , S., AYACHIT, U., AND G EVECI , B. 2010. Paraviewweb, a web framework for 3d visualization and data processing. IADIS International Conference on Web Virtual Reality and Three-Dimensional Worlds (07).
Conclusions
L AWRENCE L IVERMORE NATIONAL L ABORATORY, 2011. Visit: Software that delivers parallel interactive visualization. https://wci.llnl.gov/codes/visit.
We have presented in this paper a novel approach to remote rendering by combining two open-source technologies: MIDAS and ParaViewWeb. The integration of a data management system with online visualization allows for a faster and more efficient analysis of massive datasets.
M ORELAND , K., ROGERS , D., G REENFIELD , J., G EVECI , B., M ARION , P., N EUNDORF, A., AND E SCHENBERG , K. 2008. Large scale visualization on the cray xt3 using paraview. O RACLE C ORPORATION, 2011. http://dev.mysql.com/.
We are currently working on developing new features for the system. First, we are improving the current communication between MIDAS and ParaViewWeb and adding new visualization controls such as better transfer function handling for volume rendering and better interactions. Second, we are working on better supporting the data processing workflow. We realize that visualization is only a part of the post-processing pipeline and we would like to add a more streamlined workflow for processing from the convenience of a web browser. Third, we are working on a federated database mechanism, so that MIDAS instances could communicate easily with each other. The idea is to provide an interface for exchanging not only metadata but also visualization information across re-
Mysql database server.
P OSTGRE SQL G LOBAL D EVELOPMENT G ROUP, 2011. Postgresql database server. http://www.postgresql.org/. T HE A PACHE S OFTWARE F OUNDATION, 2011. Apache hadoop. http://hadoop.apache.org/. T HE L UNG C ANCER A LLIANCE, 2009. The give-a-scan project. http://www.lungcanceralliance.org/giveascan. T HE O PTICAL S OCIETY OF A MERICA, 2008. Interactive science publishing (isp). http://midas.osa.org.
150