like data structures and algorithms, has become widely accepted. One of the main ... Implementing the program to be visualized is not considered in this context.
52
Kolin Kolistelut - Koli Calling 2002
Effortless Creation of Algorithm Visualization V. Karavirta, A. Korhonen, J. Nikander, P. Tenhunen Department of Computer Science and Engineering Helsinki University of Technology PO Box 5400, 02015 HUT, Finland {vkaravir,archie,jtn,ptenhune}@cs.hut.fi
1
Introduction
The idea of using visualization technology to enhance the understanding of abstract concepts like data structures and algorithms, has become widely accepted. One of the main obstacles for fully taking advantage of algorithm visualization seems to be the time and effort required to design, integrate and maintain the visualizations. The process of creating software visualizations (SV) is thought to be too laborious to be worthwhile (Hundhausen et al., 2002). Thus, “a future challenge is to create tools and methodologies which will result in the use of SVs by the majority of computer science educators” (Domingue, 2002). Several attempts have been made to introduce a system that levels out the burden of creating new visualizations (Haajanen et al., 1997; Korhonen and Malmi, 2002; LaFollette et al., 2000; Naharro-Berrocal et al., 2002). However, none of these systems has gained wide recognition. Therefore we have surveyed several systems in order to identify why the creation of software visualization is such a laborious process. The users of visualization systems can be divided into two classes. First, there are producers, who use the systems to create visualizations. Second, there are consumers who benefit from the visualizations. By using, for example, Jeliot (Haajanen et al., 1997), it is possible for the consumer to be present and view the visualization while the producer constructs it, but it is not possible to save the visualization for later use. However, in systems like Animal (R¨oßling, 2000) and JAWAA (Pierson and Rodger, 1998), the producer first creates the visualization and it is used later on. There are also systems like Matrix (Korhonen and Malmi, 2002), where both approaches are possible. If the visualization is recorded for later use it should be in some widely–used format. Moreover, the usefulness of a visualization is limited, if consumers need a special viewing program. It is impossible to use such visualizations as parts of Web-Based Learning Environments like ´ (Naps et al., 2000) or integrate them into hypertextbooks as argued by Ross and JHAVE Grinder (2002). Thus, we only cover systems that are capable of delivering visualization in some widely used format such as Java applet or Scalable Vector Graphics. Furthermore, there must be some minimum level of interaction between the consumer and the visualization (R¨oßling and Naps, 2002). Therefore systems that do not offer any control over the visualization have been left out of this study. The paper is organized as follows. Section 2 defines the term effortless and section 3 describes the taxonomy used to characterize the example systems (Animal, JAWAA, Jeliot and Matrix). The evaluation is given in section 4. Finally, section 5 makes conclusions based on the observations and gives some future perspective.
2
Effortless algorithm visualization
In this section we define what we mean by effortless creation of algorithm visualization, i.e., how well does the system support creation of algorithm visualization? This is a highly subjective measure including many factors. We see two categories characterizing the effortlessness of a given SV system: WYSIWYG (What You See Is What You Get) and On-the-fly use. Both of them look at the question from the producer’s point of view.
Kolin Kolistelut - Koli Calling 2002
P08
53
Most people prefer WYSIWYG systems to systems based on textual input. Thus, our first category divides systems into two groups, those who support WYSIWYG and those who do not. Implementing the program to be visualized is not considered in this context. However, if the code must be manually annotated (JAWAA) without a WYSIWYG editor, the system is considered to be non-WYSIWYG. One characteristic that has a great influence on the effort required is the ability to use the system on-the-fly. Let us consider a use case where a lecturer wants to demonstrate the behavior of a binary search tree (BST). With predefined animations it is very hard to adapt to all possible student questions. With animations created on the spot, the lecturer can easily answer “What if” type of questions by animating the various BST operations with different input data. The degree of on-the-fly use can be measured by estimating the effort needed to prepare a new case to be visualized. Thus, we distinguish the systems by ranking the degree of preparation as follows: 1) no prior preparation, 2) requires programming of the algorithm, 3) requires programming and annotation and 4) not supported.
3
Taxonomy
In this section we introduce the criteria used to categorize algorithm visualization systems. Our criteria are derived from the taxonomy of Price et al. (1993). We have selected a subset of the taxonomy (generality and presentation style) that we feel relevant to the matter at hand based on the selected software visualization systems. Since the taxonomy is a bit old, we have extended or modified the meaning of some criteria. Based on our presumptions of criteria and their relations to the effort, we have made three hypothesis that we will introduce in the following. Category generality measures the area of use of the system. There are two subcategories of generality in the taxonomy we are interested in: language and applications. The language criterion tells what programming language the visualization objects must be specified in, if any. The applications criterion, or especially its subcategory speciality, specifies what a particular system is good at visualizing or, in other words, what the system is designed for. Our hypothesis for the relation between generality and effort is the following. “The more general a system is the more effort is needed to create a visualization with it.” The presentation style category describes the appearance of the visualization. We have selected two interesting subcategories: graphical vocabulary and animation. We have extended the original meaning of the graphical vocabulary with the idea of available concepts. It measures the graphical object’s awareness of what it is representing. Our hypothesis regarding graphical vocabulary is: “The more primitive graphical vocabulary a system has the more effort is needed to create a visualization with it.” Animation describes the type of animation provided by a visualization system. Animation has three levels: none, step–wise and smooth. None means that the system is able to create static images. A step–wise animation is a set of still images. In smooth animation transitions between steps of the animation are smooth. Our last hypothesis regarding animations is: “It takes more effort to create smooth animations than to create step–wise animations.”
4
Evaluation
In this section we present the outcomes after applying the criteria described in section 2 and the selected taxonomy represented in section 3. 4.1
Effortless systems
In the following we represent the relative ranking of the example systems. All these systems have aspects that support effortless use in creation of algorithm visualizations.
54
Kolin Kolistelut - Koli Calling 2002
Table 1: Generality System Animal JAWAA Jeliot Matrix
Rank
Language n/a any EJava Java
Speciality any any code and algorithm animation algorithm animation
Table 2: Presentation Style System Animal JAWAA Jeliot Matrix
Graphical vocabulary geometric shapes, list element geometric shapes, tree, graph, array, stack, queue primitive data types, array, stack, queue arrays, lists, trees, graphs
Animation smooth, step–wise step–wise, (smooth) smooth step-wise, smooth
1. Matrix supports both WYSIWYG editing and on-the-fly use with no prior preparation or at most by programming the algorithm only. 2. Jeliot supports both WYSIWYG editing and on-the-fly use with programming. 3. JAWAA, no WYSIWYG editor and on-the-fly use with programming and annotation. 4. Animal supports WYSIWYG editing, but not on-the-fly use. We have ranked on-the-fly use to be a more valuable feature from the perspective of effortless creation. This is because it is more time-consuming to produce each animation instance of an algorithm separately with a WYSIWYG editor (Animal) compared to the hand-coding of the algorithm and producing all the instances by running the algorithm with different input data. However, the major division here is whether 1) a system supports both, WYSIWYG editor and on-the-fly use or 2) only one or none of these. The first two systems (Matrix and Jeliot) belong to the first category and the latter two (JAWAA, Animal) to the other. 4.2
Generality
Generality is measured with two criteria, language and speciality. We have considered a system’s speciality to be more significant indicator of generality than the language. It should be noted, however, that the taxonomy fails to properly categorize systems, such as Animal and Matrix, that allow direct manipulation of the visualization. In both of these the user does not have to have any specific language in mind while creating the visualization. However, this has no effect on the ranking that follows. The evaluation is summarized in Table 1. The most discriminating characteristic is Animal’s and JAWAA’s capability of visualizing (almost) anything. The other systems are only good at visualizing predefined data types. However, since Animal is not restricted to any language while in JAWAA some language must be used, we consider Animal to be more general than JAWAA. Jeliot can visualize and animate almost arbitrary Java code and is therefore more general than Matrix, in which code animation is not fully supported. Therefore, in terms of generality the systems can be ranked as follows: Animal, JAWAA, Jeliot, and Matrix. 4.3
Presentation style
Presentation style, represented in Table 2, is related to the set of artifacts that visualizer can manipulate. It is divided into graphical vocabulary and animation. The graphical vocabulary determines the level of the conceptual abstractions the visualizer can use. Of the included systems Animal has the most simple concepts. The concepts
Kolin Kolistelut - Koli Calling 2002
P08
55
high effort
high effort
Animal
Animal
JAWAA
JAWAA specific
generic
primitive
complex
graphical vocabulary
graphical vocabulary
Jeliot Jeliot Matrix Matrix
low effort
low effort
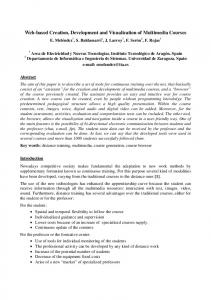
Figure 1: Generality vs. effort
Figure 2: Graphical vocabulary vs. effort
available in Jeliot and JAWAA are more complex, while those available in Matrix are even more complex. We feel that none of the available styles of animation: none, step–wise or smooth – is better than the others, but a system that supports several styles is better than a system that supports only one. Using Animal or Matrix it is possible to create snapshots of an animation, as well as create step–wise or smooth animations. Using JAWAA it is possible to create either step–wise or smooth animations, though it takes more effort to create smooth animation. Jeliot supports only smooth animation.
5
Conclusions
In this paper we have studied four algorithm visualization systems. We have also introduced a taxonomy and presented three hypotheses how this taxonomy relates to the effort needed to create visualizations. 5.1
Generality and effort
In general, systems can be divided to four quadrants as shown in Fig. 1. Animal and JAWAA are generic, high-effort systems, whereas Jeliot and Matrix are specific, low-effort systems. None of the systems identify as specific, high-effort or as generic, low-effort. In our first hypothesis we argued that the more general a system is the more effort is needed to create a visualization with it. The evidence gathered supports this. However, it would be interesting to see systems that qualify to the category of generic, low-effort. 5.2
Presentation style and effort
Our second hypothesis was that the more primitive graphical vocabulary a system has the more effort is needed to create a visualization with it. The graphical vocabulary axis in Fig. 2 is divided into two parts – primitive and complex. In primitive graphical vocabulary we have only simple drawing components, whereas complex graphical vocabulary includes abstractions of data structures. The more complex the graphical vocabulary is, the more abstract concepts are supported. The segment of a line implies the range of covered graphical concepts. Moreover, in Matrix one has the option to expand its graphical vocabulary. For example, it is possible to combine the reference implementations for lists and arrays in order to produce an adjacency list without programming a new concept. The data in the fourfold table (Fig. 2) agrees with our original hypothesis. However, none of the systems extends to the quadrant of primitive graphical vocabulary and low-effort. The question is whether primitive graphical vocabulary always leads to a high effort system?
56
Kolin Kolistelut - Koli Calling 2002
In our last hypothesis we stated that it takes more effort to create smooth animations than to create step-wise animations. This is not true. Our counter example is Matrix – it takes precisely the same effort to create smooth or step-wise animations with it. 5.3
Final remark
As the first two hypothesis imply there are some open research problems that are relevant to the topic at hand. Especially we are interested to see whether it is possible to develop the generic AV systems further toward effortless creation of algorithm visualization. On the other hand, it is also an open question if the current low effort systems could be developed further to be more generic.
References Domingue, J., 2002. Software visualization and education. In: Software Visualization: International Seminar. Springer, Dagstuhl, Germany, pp. 205–212. Haajanen, J., Pesonius, M., Sutinen, E., Tarhio, J., Ter¨asvirta, T., Vanninen, P., 1997. Animation of user algorithms on the web. In: Proceedings of Symposium on Visual Languages. IEEE, Isle of Capri, ITALY, pp. 360–367. Hundhausen, C., Douglas, S., Stasko, J., 2002. A meta-study of algorithm visualization effectiveness. Journal of Visual Languages and Computing 13 (3), 259–290. Korhonen, A., Malmi, L., May 2002. Matrix – concept animation and algorithm simulation system. In: Proceedings of the Working Conference on Advanced Visual Interfaces. ACM, Trento, Italy, pp. 109–114. LaFollette, P., Korsh, J., Sangwan, R., 2000. A visual interface for effortless animation of c/c++ programs. Journal of Visual Languages and Computing 11 (1), 27–48. Naharro-Berrocal, F., Pareja-Flores, C., Urquiza-Fuentes, J., 2002. Redesigning the animation capabilities of a functional programming environment under an educational framework. In: Second Program Visualization Workshop. ACM, HornstrupCentret, Denmark. ´ An environment to actively Naps, T. L., Eagan, J. R., Norton, L. L., March 2000. JHAVE: engage students in web-based algorithm visualizations. In: Proceedings of the SIGCSE Session. ACM, Austin, Texas, pp. 109–113. Pierson, W., Rodger, S., 1998. Web-based animation of data structures using jawaa. In: Proceedings of the 29th SIGCSE Technical Symposium on Computer Science Education. ACM, Atlanta, GA, USA, pp. 267–271. Price, B., Baecker, R., Small, I., 1993. A principled taxonomy of software visualization. Journal of Visual Languages and Computing 4 (3), 211–266. Ross, R. J., Grinder, M. T., 2002. Hypertextbooks: Animated, active learning, comprehensive teaching and learning resource for the web. In: Software Visualization: International Seminar. Springer, Dagstuhl, Germany, pp. 269–283. R¨oßling, G., 2000. The animal algorithm animation tool. In: Proceedings of the 5th Annual SIGCSE/SGCUE Conference on Innovation and Technology in Computer Science Education, ITiCSE’00. ACM, Helsinki, Finland, pp. 37–40. R¨oßling, G., Naps, T. L., 2002. A testbed for pedagogical requirements in algorithm visualizations. In: Proceedings of the 7th Annual SIGCSE/SGCUE Conference on Innovation and Technology in Computer Science Education, ITiCSE’02. ACM, Aarhus, Denmark, pp. 96–100.