on a post test by students that used the hashing tutorial versus students receiving instruction through standard lecture and a textbook. Categories and ... Additional Key Words and Phrases: Algorithm Exploration, Data Structure and Algorithm Vi- ..... Overall, it is important to note that the difference in performance is relatively.
Going Beyond Algorithm Visualization to Algorithm Exploration CLIFFORD A. SHAFFER, Virginia Tech ARPIT KUMAR, IIT Kharagpur MAYANK AGARWAL, Delhi College of Engineering ALEXANDER JOEL D. ALON, Virginia Tech STEPHEN H. EDWARDS, Virginia Tech
While algorithm visualizations have proved valuable to the CS education community, even the better algorithm visualizations today are typically limited to instruction in the mechanics of how a given data structure or algorithm behaves. We present the concept of an “algorithm exploration,” which goes beyond the scope of algorithm visualizations to provide students with an opportunity to explore the relative merits of alternative solutions for a particular problem. As an illustration of what an algorithm exploration might look like, we describe a hashing tutorial that we have implemented. We discuss why algorithm explorations are more difficult to implement than standard algorithm visualizations. Results are presented for an evaluation comparing performance on a post test by students that used the hashing tutorial versus students receiving instruction through standard lecture and a textbook. Categories and Subject Descriptors: E.1 [Data Structures]: ; E.2 [Data Storage Representations]: ; K.3.2 [Computers and Education]: Computer and Information Science Education General Terms: Algorithms, Measurement, Design Additional Key Words and Phrases: Algorithm Exploration, Data Structure and Algorithm Visualizations, Algorithm Animation, Courseware
1.
INTRODUCTION
A key aspect of the pedagogical potential for data structure and algorithm visualizations and animations (hereafter referred to generically as algorithm visualizations or Aves) is their ability to support active learning [Naps et al. 2002]. Unfortunately, many AVs provide only a passive learning experience—being the on-line equivalent of watching a video [Shaffer et al. 2010]. But the better AVs allow students to direct their learning by controlling the information stored in the data structure or processed by the algorithm. A few even require students to participate directly in some way, such as by indicating where in a tree a given record will be inserted [Gustafson and Kjensli 2007; Karavirta et al. 2009] or otherwise requiring the student to intervene. This helps to both build and demonstrate proficiency. The idea that students need to be active participants in the learning experience
Permission to make digital/hard copy of all or part of this material without fee for personal or classroom use provided that the copies are not made or distributed for profit or commercial advantage, the ACM copyright/server notice, the title of the publication, and its date appear, and notice is given that copying is by permission of the ACM, Inc. To copy otherwise, to republish, to post on servers, or to redistribute to lists requires prior specific permission and/or a fee. c 2009 ACM 0000-0000/2009/0000-0001 $5.00
ACM Journal Name, Vol. 1, No. 1, 1 2009, Pages 1–13.
2
·
C.A. Shaffer et al.
fits in with the constructivist approach to learning [Bransford et al. 2000; Dalgarno 1996; Jonassen 1994; Moshman 1982]. Many in the AV community have recognized that active participation needs to be a part of the AV experience [Hansen et al. 2000; Hundhausen and Douglas 2000; Hundhausen et al. 2002]. In this paper we consider ways to go beyond the intent of most current AVs, which is limited to educating students in the mechanical aspects of the behavior of a data structure or an algorithm. We seek to allow students to explore the performance characteristics and relative merits of various design choices within some topic, such as comparing various search trees, hash system designs, or sorting algorithms. We call an artifact that provides this capability an algorithm exploration. 2.
ALGORITHM EXPLORATIONS
Bloom’s taxonomy [Bloom 1956] is a well-known categorization that defines six levels of learning within the cognitive domain. Most AVs available today operate at the lower levels of the taxonomy. When a student watches an animation, he or she hopefully gains knowledge about the subject matter (the lowest level identified by Bloom). When a student controls the input to the data structure, the comprehension level should be reached. Demonstrating an understanding of how the data structure operates (such as by selecting the node in a tree that the student predicts will be affected by an update operation) is at the application level (level three) in Bloom’s taxonomy. Even those few AVs that encourage user interaction to direct the operation of the data structure or algorithm typically do not address other issues such as relative performance of various design choices. We propose that AVs should involve students in more than merely watching and manipulating data structures and algorithms. Ideally, students should be given the chance to explore, compare, and analyze. This can often be done using simulation. When a student is exposed to simulations that allow her to investigate the relative performance of design choices, then she can move from the application and analysis levels of Bloom’s taxonomy to reach elements of the synthesis and evaluation levels. Potentially, using a simulation in this way can lead to a qualitatively different educational experience than is provided by more traditional AVs [de Jong 2006]. Our conception of an algorithm exploration uses simulation to enhance AVs in ways that allow students to investigate not only how an algorithm or data structure works, but also how it performs in terms of its space or time efficiency. The subject of the exploration should have a sufficiently rich design space such that there are meaningful design choices to be made by the students, where such choices will result in some detectable difference in quality or performance. The goal is to involve students in more than merely watching and manipulating data structures and algorithms. For example, an algorithm exploration on balanced search trees could go beyond showing the result of inserting a record into the tree, or even showing how the insert operation is performed (which are important initial steps when learning about search tree structures). It could also allow users to investigate how changing the insert routine to keep the tree balanced, as in BST variants like AVL or Splay Trees, will affect performance. A hashing AV could do more than show how various hash ACM Journal Name, Vol. 1, No. 1, 1 2009.
Going Beyond Algorithm Visualization
·
3
functions and collision resolution policies operate. A hashing algorithm exploration could allow students to use simulations to see the degradation in performance as the hash table fills up, or compare the performance of different collision resolution methods. A key aspect of algorithm explorations is the idea that students make design choices, and then use simulations automatically generated by the system to discover the (non-obvious) results. While there exist AVs that give the user some sense of the relative runtime performance for several sorting algorithms [Gosling et al. 2001], for example, this alone does not seem to provide much scope for “exploration.” A successful algorithm exploration must have a sufficiently rich design space to make the “exploration” part meaningful. It is also necessary to help students avoid getting lost in the design space with no landmarks or compelling questions to answer [de Jong 2006]. In the words of Robert Pinker [Pinker 2007], “Exploration without guidance is too chancy and takes too long. Guidance without exploration is just another form of direct instruction that relies more on memorization than reasoning.” The problem is that students might have many choices that they can make, but without goals, it becomes an empty exploration exercise. Thus, the algorithm exploration must be set up with sufficient guidance involved, perhaps in the form of a set of questions to answer. 3.
EXPLORING HASHING
The topic of hashing has many features that make it suitable for an algorithm exploration. It is an intrinsically important concept that is widely used in industry. It is based on a simple and compelling idea, and yet it is surprisingly difficult to implement a satisfactory hashing system since there are many details and unexpected nuances. There are many choices for a hash function. This fact is fairly easy for students to grasp, even if the reasons why a given hash function is good or bad are not so clear to them. In contrast, the fact that there are also many choices for a collision resolution method does not occur to the typical student without prompting (the typical student will believe that linear probing is the only mechanism for collision resolution until told otherwise, and even then will have difficulty understanding that it performs relatively poorly). The combination of multiple hash functions and multiple collision resolution methods gives scope for exploration, especially when compounded by the wide range of possibilities for key distributions and the subtleties involved in the space/time tradeoffs regarding size and load factors for the hash table. In addition, there are a myriad of interesting details involved. The question “What is the probability that two people in your class share a birthday?” directly relates to hashing. Define X to be the number of records that collide at the slot in a hash table that has the greatest number of collisions for a given collection of records, with X calculated as the average over many runs. Will X grow as the table size and number of records to be hashed grows in proportion? And how well does quadratic probing do with respect to hitting all the slots of the table during its probe sequence? These and many other questions could potentially be explored. As mentioned earlier, it is not enough to throw students into a “large and interesting” design space. They must be guided, in the sense of providing meaningful questions to answer or problems to solve [de Jong 2006; Pinker 2007]. How then ACM Journal Name, Vol. 1, No. 1, 1 2009.
4
·
C.A. Shaffer et al.
can we best provide students with a meaningful, constructivist-based exploration for this body of knowledge? We could conceive of a rich AV that lets the student set many parameters such as the hash function, collision resolution method, table size, and distribution of incoming keys. They could then be given measures of the resulting performance on various metrics. They could even be given convenient mechanisms for comparing different points in the design space, with the implicit task of “Find the best hash system.” This is initially the approach that we considered in designing an exploration for hashing. But this lead us to an exploration that was so vague and open ended that it was not compelling. Most AVs avoid teaching the associated material about a data structure or algorithm, and just demonstrate its behavior. Developers might believe that this design allows for maximum course flexibility, since it appears to add a dynamic visualization to the existing instructional content, without competing with the textbook or instructor regarding how to teach that content. In practice, that often fails since the textbook might present the algorithm or implementation details in a way slightly incompatible with the AV, leading to confusion for the students. At best this approach requires the instructor to “fit” the AV into their existing materials. This need to fit AVs into the existing content is one of the leading deterrents to using AVs that instructors report [Naps et al. 2002; Shaffer et al. 2011]. We believe that instructors will therefore find it easier to include an AV into their course when it provides a complete “instructional unit.” We settled on the concept of a “hashing tutorial” that combines the content that would typically be presented in a textbook along with a series of AVs that support the actual algorithm exploration. This solved the “fitting in” problem since it presented a complete standalone treatment for the topic of hashing. It also intimately connects the content to the exploration activities. Compared to a textbook or lecture, the end result is closer to a guided tour through a museum or historical site, where visitors can stop and play with the artifacts at points along the way. 4.
A HASHING TUTORIAL
Our hashing tutorial [Shaffer et al. 2008] includes traditional material covered in many data structures courses. The tutorial begins with a brief discussion of the concept of hashing and collision. One of the first activities in the tutorial is a small exercise that lets the student see the (surprisingly high!) probability of a collision, even when relatively few values are inserted into a relatively large hash table. This exercise is shown in Figure 1. Next, the student learns about various hash functions. A separate AV appears where each hash function is discussed. The student is encouraged to try each one out. Students can enter a series of key values and see where they would be stored in the hash table. Figure 2 illustrates one such example. The series of AVs that demonstrate the hash functions (and later the various collision resolution policies for closed hashing) are all customized versions of one more-general AV. In its full form, students can select a hash function and a collision resolution policy. The versions used to explore each hash function and collision resolution policy are constrained to just the one under study. Users can therefore ACM Journal Name, Vol. 1, No. 1, 1 2009.
Going Beyond Algorithm Visualization
Fig. 1.
·
5
Exploring the probability of a collision.
Fig. 2. The main hashing AV. The user may select a hash function, a collision resolution method, table size, and the keys to be inserted.
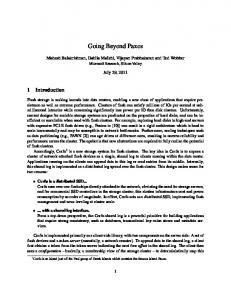
focus on the specific content being covered at that point. This allows the student to first build their knowledge base of hash functions. At the end of the section, students are exposed to the general form of the AV, allowing them to choose among any of the hash functions for a more open-ended comparison. The final step in the discussion of hash functions is the opportunity to compare their relative performance. Figure 3 shows the applet for this task. It lets students examine the distribution of slots hit in the table for a specified key distribution and hash function. The applet allows students to select the hash function, the table size, how many records are inserted, and the distribution from which the keys are generated. In Figure 3, we see performance for a uniform distribution of key values and a hash function that simply computes the modulus of the key value by the hash table size. When 100 records are inserted into a table with 100 slots, about 1/3 of the slots are empty (meaning that about 1/3 of the records collided with another record), about 1/3 of the slots contain one record, and less than 10% of the slots contain more than two records. The worst pile up has about 5 records in ACM Journal Name, Vol. 1, No. 1, 1 2009.
6
·
C.A. Shaffer et al.
Fig. 3. Examining the distribution of collisions. This histogram shows the fraction of table slots that receive the indicated number of records.
a slot in this example. By exploration, students can see the effect of changing the hash function and the other parameters of interest. For example, switching to an exponential decay distribution for the key values generates a plot where far more slots are unused, far fewer slots have one or two records, and there are a decreasing but visible number of slots with three to nine records. Another view shows students that a uniform random key distribution and a simple modulus hash function will give every slot in the table equal probability of use (a desirable property). Further exploration will reveal that this is not true for other key distributions (and as a consequence, this is not generally a good hash function). The next major topic in the tutorial begins an investigation into how to deal with collisions. We begin by discussing the difference between open hashing (a given slot in the table may contain a chain of records that hash to that slot), bucketing (a modified form of open hashing that provides a “bucket” of multiple slots associated with a given address in the hash table), and closed hashing (all records are stored in slots in the hash table). Students insert records into hash tables implemented using each technique, to visualize the behavior. The next section in the exploration tutorial discusses various approaches to classic collision resolution in closed hashing. For each collision resolution method, variations on the main AV (Figure 2) allows students to examine their behavior. We then provide the student with an applet for showing the performance of the various collision resolution methods as the table fills (see Figure 4). The last section in the tutorial discusses deleting records from a hash table. The most general form of the base hashing AV allows students to try out any combination of the available hash functions and collision resolution methods. ACM Journal Name, Vol. 1, No. 1, 1 2009.
Going Beyond Algorithm Visualization
Fig. 4.
5.
·
7
Comparison of performance for collision resolution.
FOCUS ON CONSTRUCTIVISM
There are a number of challenges involved with developing an algorithm exploration. Perhaps the most obvious is that an algorithm exploration is likely to be much larger and more complex than an AV. The typical AV can be developed by a single student programmer in a few months. Actually, if one discounted the user interface design and pedagogical effectiveness testing, the typical AV can be implemented in a week or two, but creating a pedagogically effective AV requires far more than simple programming effort. Nonetheless, AVs are often good subjects for semester projects at the undergraduate level. In contrast, the hashing tutorial described here is about an order of magnitude more complex than our base AV that allows students to try a variety of hash functions and collision resolution methods. Even though the foundation for the text on hashing was already available to us [Shaffer 2001], designing, implementing, testing, and making consistent all of the applets involved in this tutorial required a team of several student programmers working over several semesters. This level of investment might deter many AV implementers from moving up to developing algorithm explorations. A greater concern in algorithm exploration design is keeping true to constructivist learning principles. Recall that simply wandering through a multidimensional space is not pedagogically useful exploration. An effective algorithm exploration must walk a fine line between providing enough guidance to students on the one hand, while still providing the opportunity for meaningful exploration on the other. In our experience, this is an extremely difficult balance to strike even when we consciously strive toward this goal. Over the many months involved in developing an algorithm exploration, we found that it is far too easy to lose sight of constructivist principles, and err too far to one side or the other. For example, we found that it is easy to come up with a “neat” AV that lets students explore some aspect, and then neglect to provide sufficient scaffolding in the form of guiding activities. It is even easier ACM Journal Name, Vol. 1, No. 1, 1 2009.
8
·
C.A. Shaffer et al.
to give students tasks that require no exploration, as this is the default mode of presentation for most instructors (ourselves included). We find in our own efforts some instances where we felt that we did a good job of providing the appropriate balance between guidance and exploration, and other instances where we did a poor job. As an example, Figure 1 shows a small exercise that allows the student to pick a hash table size and a number of records to insert. The applet will then calculate and present the probability that at least one collision will occur. The text provides a suggestion that students “try it out” and then follows up with a pair of specific questions that require students to try different values. While this is a small point in the overall tutorial, we feel that this gives a reasonable balance between guidance and exploration for this particular situation. In contrast, our initial versions of the tutorial did not adequately push students to try out the various hash functions or collision resolution methods. As another example, Figure 5 shows an AV that demonstrates the poor performance of quadratic probing for collision resolution. A desirable feature of a collision resolution method is that its probe sequence will eventually visit every slot in the hash table. Here, students select a table size and are then shown which slots will be visited over the life of the probe sequence when the record hashes to slot zero in the table. When a student uses the applet in Figure 5, he or she can select various table sizes and see the resulting slots that will be visited by quadratic probing. The goal is for students to reach a deeper understanding of the fact that, for most table sizes, only a small fraction of the slots will ever be visited. However, we did not initially give sufficient guidance to students to explore this issue through guide questions. Similarly, while many of the hash function sections in the tutorial provide prescriptive goals for students to explore, other sections did not. The section on open hashing, for example, describes the approach and provides an applet, but omitted specific goals or problems for students to pursue in its original design. In other cases, explicit comparison goals could be better supported. For example, while there are sections on both linear probing and linear probing using steps—two closely related concepts—the applets we provided for exploring the more advanced concept do not allow students to see the differing performance of simple linear probing on the same data at the same time. This omission makes it harder for students to connect new concepts to existing ones. It also makes it harder to compare tradeoffs, since only one alternative is viewable at a time. This problem goes beyond simply asking appropriate questions in the text and will require an applet redesign in a future version. The point of these examples is to illustrate how difficult it can be for developers of instructional material, even when attempting to conform to good constructivist practices, to develop engaging material that strikes the right balance between guidance and exploration. One good mechanism to overcome such deficiencies is review by evaluators who are outside of the immediate design team and who have experience recognizing which parts of the material adhere to constructivist practices and which parts do not. ACM Journal Name, Vol. 1, No. 1, 1 2009.
Going Beyond Algorithm Visualization
Fig. 5.
6.
·
9
Visualizing the effectiveness of quadratic probing as a collision resolution method.
EVALUATION
We conducted in-class testing of the hashing tutorial in comparison to standard lecture and textbook presentation of the same concepts. This took place during the Spring 2008 and Spring 2009 semesters. A total of four course sections were involved in the evaluation, with two course sections in each semester. A total of 120 students across these four course sections participated. All course sections met twice per week for 75 minutes at each meeting. Because of curricular changes in our undergraduate program, three of the four course sections were taught in C++, and the forth was taught in Java (the course was converted from C++ to Java, and Spring 2009 involved the first offering of this version of the course, in parallel with a legacy offering in C++). In both semesters, one course section was given a week of lecture and was told to read the textbook material. The other course section spent the equivalent lecture time instead going over the hashing tutorial by themselves or in pairs on their laptops. The material covered was nearly identical, since the textbook used [Shaffer 2001] was the source material for the tutorial text. In Spring 2008, the instructor had little formal interaction with the students while they were working on the tutorial, though he was available for students to ask questions. During Spring 2009, the instructor gave a 5-10 minute “mini lecture” during each class to orient the students about important considerations while using the tutorial. An extensive quiz on the hashing material was used as a post-test instrument in all four groups. Two different forms for the quiz were developed so that the two groups of students in a given semester received different quiz forms. The two quiz forms were carefully constructed to be as equivalent as possible. The quiz forms were reversed between the two semesters, so that the group taking the tutorial got the identical quiz in Spring 2009 as the group hearing the lecture in Spring 2008, and vice versa. A structured rubric was used to score the quiz questions, ACM Journal Name, Vol. 1, No. 1, 1 2009.
10
·
C.A. Shaffer et al.
Table I. Treatment lecture tutorial
Summary of Hashing Quiz Performance Spring 2008 Spring 2009 67.8% (n = 22, s.d. = 20.1) 68.6% (n = 31, s.d. = 19.9) 77.3% (n = 19, s.d. = 10.8) 73.4% (n = 48, s.d. = 13.7)
Table II. Summary of Overall Course Performance Treatment Spring 2008 Spring 2009 lecture 83.3% (s.d. = 9.4) 81.0% (s.d. = 10.7) tutorial 81.3% (s.d. = 5.7) 84.6% (s.d. = 8.5)
and the same grader evaluated all quizzes in all four groups after the courses were completed to maximize consistency. The equivalent question for all for sections was graded together to ensure that scoring across sections, both across time and across treatments, was as even as possible. Table I summarizes the mean scores on the quiz in all four course sections, including the number of students who completed the quiz in each group and the corresponding standard deviation. An analysis of variance shows a significant difference between the two treatment groups (F(1, 118) = 4.37, p < 0.05), with students completing the tutorial averaging higher quiz scores than those who were given the lecture and textbook content. There was not a significant difference between the two years (F(1, 118) = 0.041). Since the treatment groups did not overlap, the analysis is a between-subjects comparison. To check whether quiz score differences might be attributable to general performance differences between the populations, we also compared overall final course scores between the four groups. Table II summarizes the mean cumulative scores earned by each group over all of the assignments and exams in the course. Since some students invariably drop from the course, the cumulative averages for the groups only include students who stayed in the course and completed the final exam at the end of the semester. Only seven students completed the hashing quiz but did not stay in the course and take the final exam—interestingly, but perhaps coincidentally, all were in the lecture treatment (two individuals in 2008, and five individuals in 2009). An analysis of variance found no significant differences among the cumulative averages, either across the two years or between treatment conditions (F(2, 110) = 0.61). This suggests that there were no overall differences in ability between the course sections, and that the treatment groups performed comparably overall in the course. However, the seven students who failed to complete the course after taking the hashing quiz did score significantly lower on the quiz (mean of 55.1%) than the students who took the tutorial (mean of 74.5% across both years, F(1, 72) = 14.1, p < 0.05). The mean of the students who failed to complete the course was also lower than that of the remaining students in the lecture treatment group (mean of 70.3%), although this difference was not as significant (F(1, 52) = 3.74, p ≈ 0.06). Because these seven students did not complete the course, no overall performance measures were available to compare them against the students who did complete the course. However, if they are removed from the analysis, the difference on hashing quiz scores between those in the tutorial group (74.5%) and the lecture ACM Journal Name, Vol. 1, No. 1, 1 2009.
Going Beyond Algorithm Visualization
·
11
group (70.3%) are no longer significant (F(1, 111) = 1.91). Another concern is whether students who took the Java version of the course— the Spring 2009 tutorial treatment group—were different as a population when compared to the remaining three groups who took the C++ version of the course. By comparing their cumulative course scores directly, we found a small, but not statistically significant, difference. The Java students averaged 84.6%, while the C++ students averaged 81.8%, which is not significant at the p < 0.05 level (F(1, 111) = 2.92). On the hashing quiz itself, the Java students averaged 73.4% compared to 77.3% for the C++ students, which is also not significant (F(1, 65) = 1.22). Overall, it is important to note that the difference in performance is relatively modest. The mean quiz score among all students in the lecture treatment group was 68.3% (n = 53, s.d. = 19.8), while the tutorial treatment group averaged 74.5% (n = 67, s.d. = 13.0). The difference in the means is just 6.2 percentage points, or approximately one third of one standard deviation. 7.
FUTURE WORK
We close with descriptions for two algorithm explorations that we are in the process of implementing. The first is a tutorial on Binary Search Trees (BSTs) and its close relatives. The goal is to go beyond showing the result of inserting a record into the tree, or even showing how the insert operation is performed. It will allow students to investigate how changing the insert routine to keep the tree balanced (specifically by using two well-known BST variants, the AVL Tree and the Splay Tree) affects performance. There already exist AVs that include visualizations for BSTs, AVL Trees, Splay Trees, and other search trees (for example [Dittrich et al. 2001; Galles 2006]). The key difference between an algorithm exploration and existing AVs is that an algorithm exploration will allow students to compare the various tree structures, and explore the impact of the different balancing choices. This can be done by letting students conveniently generate large data sets with various characteristics, and then visualize how well these competing data structures perform by various measures. Thus, not only will students see how the data structures work, but they will gain practical knowledge on their relative performance tradeoffs. Most importantly, they will be doing this actively, rather than being passively presented with statistics. They will choose the workload characteristics (size and distribution of data sets, operation mixes such as insert, delete, search), and measures (total operations, nodes examined, average depth of nodes) to explore relative behaviors. Another attractive topic for an algorithm exploration is memory management. One class of memory managers are “sequential fit” allocation schemes that manage requests for (and later deallocation of) arbitrary-length blocks of memory. The memory manager keeps a linked list of available memory blocks, which might become scattered within the memory pool. When a new request for memory is received, some (portion of a) free memory block will be allocated to meet the request if any such block is available. Standard techniques are first fit (give away the first free block in some order that fits), best fit (give away the smallest free block that fits) and worst fit (always give away part of the biggest free block). These allocation schemes have advantages and disadvantages, in part depending on the distribution of sizes for the memory requests. A standard AV would demonstrate ACM Journal Name, Vol. 1, No. 1, 1 2009.
12
·
C.A. Shaffer et al.
the various allocation schemes. An algorithm exploration, on the other hand, would allow students to compare these allocation schemes by varying the workload (the distribution of requests, their number, and request sizes), and then visualizing how these choices affect performance of the various schemes. REFERENCES Bloom, B. 1956. Taxonomy of Educational Objectives: The Cognitive Domain. David McKay Co Inc., Philidelphia, PA, USA. Bransford, J., Brown, A., and Cocking, R. 2000. How People Learn: Brain, Mind, Experience, and School (expanded edition). National Academies Press, Washington, DC, USA. Dalgarno, B. 1996. Constructivist computer assisted learning: theory and technique. In Proceedings of the thirteenth annual conference of the Australasian Society for Computers in Learning in Tertiary Education (ASCILITE), A. Christie, P. James, and B. Vaughan, Eds. 143–154. de Jong, T. 2006. Computer simulations: Technological advances in inquiry learning. Science 312, 5773 (April), 532–533. Dittrich, J.-P., van den Bercken, J., Schafer, T., and Klein, M. 2001. Data structure navigator (DSN). http://dbs.mathematik.uni-marburg.de/research/projects/dsn/. Galles, D. 2006. Data structure visualizations (DSV). http://www.cs.usfca.edu/galles/ visualization/. Gosling, J., Harrison, J., and Boritz, J. 2001. Sorting algorithms demo. http://www.cs.ubc. ca/spider/harrison/Java/sorting-demo.html. Gustafson, B. and Kjensli, J. 2007. Binary treesome 2.0. http://www.iu.hio.no/~ulfu/ AlgDat/applet/binarytreesome2.html. Hansen, S. R., Narayanan, N. H., and Schrimpsher, D. 2000. Helping learners visualize and comprehend algorithms. Interactive Multimedia Electronic Journal of Computer-Enhanced Learning 2. Hundhausen, C. D. and Douglas, S. A. 2000. Using visualizations to learn algorithms: should students construct their own, or view an expert’s? In Proceedings, IEEE Symposium on Visual Languages. IEEE Computer Society Press, Los Alamitos, CA, USA, 21–28. Hundhausen, C. D., Douglas, S. A., and Stasko, J. T. 2002. A meta-study of algorithm visualization effectiveness. Journal of Visual Languages and Computing 13, 259–290. Jonassen, D. 1994. Thinking technology: Towards a constructivist design model. Educational Technology 34, 3 (April), 34–37. Karavirta, V., Korhonen, A., Malmi, L., and St˚ olnacke, K. 2009. Trakla2 binary search tree insertion exercise. http://www.cse.hut.fi/en/research/SVG/TRAKLA2/exercises/BST_ Insert-5.html. Moshman, D. 1982. Exogenous, endogenous and dialectical constructivism. Developmental Review 2, 371–384. ¨ ssling, G., and nine other authors. 2002. Exploring the role of visualization Naps, T. L., Ro and engagement in computer science education. In ITiCSE-WGR ’02: Working group reports from ITiCSE on Innovation and technology in computer science education. ACM, New York, NY, USA, 131–152. Pinker, R. 2007. How do students learn from models? case studies in guided inquiry. Concord Consortium Newsletter 11, 1 (Spring), 14–15. Shaffer, C. 2001. A Practical Introduction to Data Structures and Algorithm Analysis, second ed. Prentice Hall, Upper Saddle River, NJ, USA. Shaffer, C., Agarwal, M., Kumar, A., Weil, C., Jaswa, M., and Alon, A. 2008. Hashing tutorial. http://research.cs.vt.edu/AVresearch/hashing. Shaffer, C. A., Akbar, M., Alon, A. J. D., Stewart, M., and Edwards, S. H. 2011. Getting algorithm visualizations into the classroom. In to appear in SIGCSE ’11: Proceedings of the 42nd SIGCSE Technical Symposium on Computer Science Education. ACM, New York, NY, USA. ACM Journal Name, Vol. 1, No. 1, 1 2009.
Going Beyond Algorithm Visualization
·
13
Shaffer, C. A., Cooper, M. L., Alon, A. J. D., Akbar, M., Stewart, M., Ponce, S., and Edwards, S. H. 2010. Algorithm visualization: The state of the field. ACM Transactions on Computing Education 10, 3 (August), 1–22.
Received Month Year; revised Month Year; accepted Month Year
ACM Journal Name, Vol. 1, No. 1, 1 2009.