EIGENWALKS: WALK DETECTION AND BIOMETRICS FROM SYMMETRY PATTERNS László Havasi
Zoltán Szlávik and Tamás Szirányi
Péter Pázmány Catholic University Faculty of Information Technology Budapest, Hungary
[email protected]
Hungarian Academy of Sciences Analogic and Neural Computing Laboratory Budapest, Hungary {szlavik,sziranyi}@sztaki.hu
Abstract—In this paper we present a symmetry-based approach which can be used to detect humans and to extract biometric characteristics from video image-sequences. The method employs a simplified symmetry-feature extracted from the images. To obtain a useful descriptor of a walking person, we track temporally the symmetries which result from the movements of the person's legs. In a further processing stage these patterns are filtered, then re-sampled using Bezier-splines to generate an invariant and noise-cleaned signature or “feature”. In our detection method the extracted spatio-temporal feature with a large number of dimensions (800) is transformed to a space with a much smaller number of dimensions (3), which we call the “eigenwalks space”; the method uses Principal Component Analysis (PCA) to reduce the dimensionality, and the Support Vector Machine (SVM) method in the eigenspace for recognition purposes. Finally we present a method by which we can estimate the gait-parameters (the beginning and end of a walk-cycle, identification of the leading leg) from the symmetry-patterns of the walking person, without camera calibration, based on two successive detected walk-steps. Keywords-component; pedestrian detection, motion analysis, spline interpolation, PCA, SVM
I.
[2][4][8]) need to process very large amounts of 3D spatiotemporal (XYT) data, and this requires a computationally demanding algorithm [4] that in turn makes the methods impractical for use in real-time. Our extraction method utilizes derived third-level symmetries of the edge-map to detect and track structural changes in video sequences, and uses SVM for pattern classification in an eigenspace with a small number of dimensions. This is the same as the way that the “Eigengait” technique [8] treats the so-called Units of Self-Similarity (USS); it uses PCA to reduce the dimensionality of the featurespace. The resulting space is termed the Eigenwalk space. Our method (under certain not severely restrictive assumptions) can detect pedestrians in real-time, with 97% correct detection. It can furthermore extract biometric information such as walkperiod and identification of the “leading” leg; and also (if the camera is calibrated) stride and cadence. These results have been verified for person-identification [13]; and in the next phase of our project we hope to use the method for personregistration in a multi-camera system [14]. The assumptions we use in the paper are:
INTRODUCTION
The extraction and the tracking of human figures in imagesequences is a key issue for video surveillance and videoindexing applications. This interest is strongly motivated by the need for automated person-identification systems [1]. The process may be broken down into several parts: detection [2], tracking, classification [3] and identification [4][6] of human movement or gait. There are several approaches for each of these sub-problems. A useful and popular approach is based on silhouette analysis [5] with spatiotemporal representation, where a key aim is to achieve a more invariant data representation of the detected object. In [6] the symmetries of the silhouette are utilized as a biometric parameter for personidentification. Other methods focus on the legs [7] and the periodicity of human movement [8][2]. This short summary demonstrates the wide variety of the possibilities and features that can be used for detection and biometrics extraction. In our experiments we find that the exact silhouette of the full body can rarely be extracted from real outdoor videos; and it is also rare that overlapping objects can be successfully separated [12]. We note also that most of the methods referred to (e.g. This work was supported by the NoE MUSCLE project of the EU.
0-7803-9134-9/05/$20.00 ©2005 IEEE
•
The camera is static in position; however the imagemotion can relate to more than one person.
•
The image-capture rate is at least 10Hz.
•
The height of each “target” person is at least 100 pixels.
•
Persons walk more than one step during the sequence.
•
The direction of motion is not directly towards (or away from) the camera; and both legs of the person are visible.
•
However, the motion in the image-sequence can relate to more than one person. II. SYMMETRY EXTRACTION AND TRACKING
Because the camera is in a static position we can use median filtering over time to generate an estimate of the background image, which then enables extraction of foreground images. The moving objects are extracted by using a simple difference of the original image and the estimated background. Subsequently, we apply threshold and
III-289
morphological operations to achieve noise cleaning and mask dilatation. This simple method for silhouette detection is not suitable for all purposes, but is very effective for motion detection. Our aim is not to generate an accurate binary silhouette such as is needed in gait analysis methods; the resulting mask of the detected foreground is used to highlight the edges of moving objects. Symmetry is a basic geometric attribute, and most objects have a characteristic symmetry-map. Our method [9] employs a modified “shock-wave” based method: it calculates symmetries by propagating parallel waves from the ridge. The position of the extracted symmetry axis corresponds, after a number of iterations, to the distance between the collision point and the edge point from both parts. In the practical cases we are considering, we essentially need to extract only vertical symmetries. This restriction has the advantage that it assists in reducing the sensitivity to fragmentation. Sample outputs of the algorithm are shown in Fig. 1. The symmetry operator normally uses the edge map of the original image as its input; we used the Canny edge-detector algorithm to derive the locations of the edges (ridges).
opening to closing. In the following descriptions, one “cycle” denotes two steps. III. REPRESENTATION AND RE-SAMPLING The extracted symmetry-patterns are represented with the upper and lower end points (2 each) of the L2S in each frame. Thus there are four 3D coordinates, which correspond approximately to the “end-points” of the two legs. Temporally these patterns depend both on the frame rate and the walking speed, so a pattern usually contains data from 4-8 frames. Before further analysis the data are normalized with respect to time, to present a more invariant description of the motion; we perform this task with Bezier spline interpolation. This technique has the advantage that it performs two tasks: (i) data is re-sampled in a defined time interval with fixed point count, (ii) noise-filtering is performed on the trajectories, which gives a smoother symmetry-pattern. In our experiments the noisecleaning is critical because in real outdoor scenes these patterns are often damaged. The Bezier spline (B-B spline) (1) is a good choice because the effect of base points is global; so the presence of some damaged points does not cause significant change in the whole trajectory. n r r r (t ) = ∑ Bi ,n (t )Pi i =0
(1)
⎛ n⎞ n−i Bi ,n (t ) = ⎜⎜ ⎟⎟t i (1 − t ) (i = 0,1,..., n ) ⎝i⎠
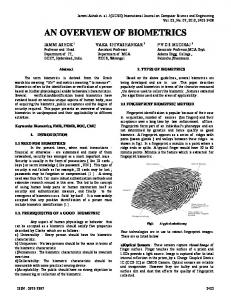
Figure 1. An idealised outline of a walking person, together with the derived Level 1, Level 2, and Level 3 symmetry maps.
As illustrated in Fig. 1, the symmetry concept can be extended by iterative operations. The symmetry of the Level 1 symmetry map is the Level 2 symmetry; and the symmetry of the Level 2 map is the Level 3 symmetry (L3S). The extracted L3Ss for a human target are in practice useful primarily for analysis of images of the legs. However, even the existence of clear symmetries in a single static image does not necessarily provide usable information about the image content; for this, we need to track the changes of the symmetry fragments by temporal comparisons. The symmetry fragments and their radii define an outline that can be used as a mask between successive frames to aid classification of the coherent fragments in successive frames, as illustrated in Fig. 2.
The base points consist of the (x,y) image coordinates of the above-mentioned symmetry patterns, while the z coordinate represents the time (in milliseconds) at which the frame was captured.
Figure 3. Original symmetry-pattern and the trajectories of 9 frames. The input contains severely corrupted data.
This time-extended data representation permits the integrated analysis of data obtained from several cameras where the frame rate is different (e.g. network cameras); the extracted features must be resampled with a continuous timedivision. The result of Bezier spline interpolation of data can be seen in Fig. 4. Figure 2. Masks of the reconstructed symmetries from successive frames; and symmetry-patterns of real-life pedestrian walking-tracks.
The tracking algorithm calculates the overlapping areas between symmetry masks; and as time progresses it constructs the largest overlapping area. The results of temporal tracking can be seen in Fig. 2, where we demonstrate the resulting symmetry-patterns in real-life situations. The first L3S appears when the legs are opening and the last is detected just before the legs are closed; so a symmetry-pattern for the motion of a walking person corresponds to the movement of the legs from
A popular curve interpolation method is that known as NURBS (Non Rational B-Spline). This is an extended B-spline method, and the base points have local effect. However, for our application it has drawbacks: its computation cost is higher than for the Bezier-spline method, and the results may be less good. The results of an 8th-order B-spline processing, on the same input data as before, are shown in Fig. 4. Note that the damaged data gives a less smooth output than the previous method.
III-290
Figure 4. Interpolated trajectories of 100 points: a) B-spline b) B-B spline. The numerically integrated surface of the pattern. (Input data is the same as for Fig. 3.) Figure 5. “Walk” and “non-walk” patterns in the eigenspace.
IV. WALK CYCLE DETECTION Our previous work [9] introduced an algorithm that is able to detect pedestrians from recognition of their characteristic symmetry-patterns, using Kernel Fisher Discriminant Analysis (KFDA technique). Here we present a more established pattern-classification method based on the continuous interpolation of the symmetry-patterns. First the interpolated 3D points are rearranged into a row-vector with dimension 800. It follows from the linearity of the z coordinate, the smooth time-division (time is linearly related to the successive samples), that this coordinate can be omitted: it has no discriminative information-content. After the patterns are centered in both x and y, both coordinates are normalized using a constant chosen such that max(y)= 1 and min(y)= –1; we do this because we have found that the y-size of the patterns varies less than does the x-size. We do not normalize with individual coefficients for x and y, since in that case the informationcontent of the ratio of the x and y values would be lost. A well-known technique for dimension reduction is the PCA method [10][3]. The extracted and manually labeled symmetry-patterns are represented in the input feature vector, which has a large number of dimensions (800 in our case). To find the principal components of the distribution of the feature space we first obtain the mean m and the covariance matrix Σ of the data set. Then we can compute N≤rank(Σ) nonzero eigenvalues and the associated eigenvectors of Σ based on SVD. The eigenvectors associated with a small number of the largest eigenvalues correspond to large changes in training patterns; thus a transformed matrix can be constructed from eigenvectors to project the original data into a parametric eigenspace with a drastically reduced number of dimensions. We considered the space spanned by the 3 most significant eigenvectors that account for 93% of the variation in the training data-set: we call this the Eigenwalk space. Fig. 5 demonstrates the results using the test-set of labeled “walk” and “non-walk” patterns which is described below. In the Fig. 5 we can observe two main groupings of the “walk” patterns; these two groups correspond to the two opposite walking-directions. This drastically reduced number of dimensions is of great assistance in increasing the speed of classification, which is an important factor in real-time applications.
The human patterns lie on a non-linearly shaped manifold in the eigenspace. The classification process is carried out via non-linear classification method, namely Support Vector Machine (SVM) [11] with radial basis kernel function (2).
k ( x , xi ) = e
−
x − xi 2σ 2
(2)
The training data-set, assembled from indoor video sequences, contained 200 “walk” and 400 “non-walk” patterns in the eigenspace. The parameter (σ) was determined in the interval 0.1-2.0; from this an optimal value is 0.4, and the valid-classification rate is 99% with 58 support vectors. The above-described tracking and classification method can detect one step. An obvious limitation of this algorithm is that it is unable to detect direct front-view walks, or cases when the leading leg covers the rear leg, because in these cases the symmetries do not appear. V. LEADING LEG IDENTIFICATION The 2D motion vector on the image plane and the walker’s period can be extracted from the detected patterns directly: we estimate the motion vector with a regression line fitting to the last half trajectory of the lower two points of the pattern. In this section we present a method to determine, from one detected cycle, whether the leading leg is the right or the left one. This is in fact a difficult visual problem in itself. The non-rigid human body during a walking cycle has a useful property which assists us in recognizing the leading leg. Depending on the 3D walk-direction, and on which is the leading leg, one leg or the other practically obscures the visible area between the legs. During one cycle the ratio of the areas and the 2D direction on the image-plane can be used both to estimate the 3D direction and to identify the leading leg. In this section we do not discuss the 3D direction estimation, only the leading-leg identification. During one cycle, the left leg and right leg are in turn in the leading position. The abovedescribed method can detect one step. To connect two successive steps into one walk cycle, we calculate the 2D displacement vector of a detected step, and then search for another step in the estimated 2D position and at a time-point after a forecast walk-period.
III-291
not detect “near-frontal” walkers (motion directly toward camera, or nearly so), nor steps in two special cases where the walker is approaching (table 1, last row), viz.: (i) top left to bottom right, and right leg leading; or (ii) top right to bottom left, and left leg leading. The leading leg identification worked well, with 99% correct identification in cases where the walkcycle was detected correctly. Figure 6. Tracked traces during one cycle comprising two steps. The right leg is marked.
Two cycles can be seen in Fig. 6 with the detected patterns: in (a) and (d) the left leg is leading, while in (b) and (c) it is the right leg. To measure the area between the legs, we used a numerical integral (3) of the surface defined by the interpolated patterns described in section 3. (see Fig. 4.c). r r r r n−1 ⎛ (r (i ) − r (i )) × (r (i + 1) − r (i )) + ⎞ U L U L (3) ⎟ areat ≈ ∑ ⎜ r r r r ⎜ ⎟ i =1 ⎝ (rU (i + 1) − rL (i )) × (rL (i + 1) − rL (i )) ⎠ Table I summarizes the relationship between the leading leg and the ratio of surfaces from two successive patterns: ratio=areat/areat-1 TABLE I. SURFACE DEPENDENCIES ON 2D WALK-DIRECTION AND LEADING LEG (RIGHT, LEFT). 2D Dir
Leg Right Left Right Left Right Left
Ratio >1 >1