Phys Chem Minerals DOI 10.1007/s00269-014-0670-4
Original Paper
Elastic behavior and pressure‑induced structure evolution of topaz up to 45 GPa G. D. Gatta · W. Morgenroth · P. Dera · S. Petitgirard · H.‑P. Liermann
Received: 21 February 2014 / Accepted: 24 March 2014 © Springer-Verlag Berlin Heidelberg 2014
Abstract The behavior of a natural topaz, Al2.00Si1.05O4.00(OH0.26F1.75), has been investigated by means of in situ single-crystal synchrotron X-ray diffraction up to 45 GPa. No phase transition or change in the compressional regime has been observed within the pressure-range investigated. The compressional behavior was described with a third-order Birch–Murnaghan equation of state (IIIBM-EoS). The III-BM-EoS parameters, simultaneously refined using the data weighted by the uncertainties in P and V, are as follows: KV = 158(4) GPa and KV′ = 3.3(3). The confidence ellipse at 68.3 % (Δχ2 = 2.30, 1σ) was calculated starting from the variance–covariance matrix of KV and K′ obtained from the III-BM-EoS least-square procedure. The ellipse is elongated with a negative slope, indicating a negative correlation of the parameters KV and KV′, with KV = 158 ± 6 GPa and KV′ = 3.3 ± 4. A linearized III-BM-EoS was used to obtain the axial-EoS parameters (at room-P), yielding: K(a) = 146(5) GPa [βa = 1/ (3K(a)) = 0.00228(6) GPa−1] and K′(a) = 4.6(3) for the
a-axis; K(b) = 220(4) GPa [βb = 0.00152(4) GPa−1] and K′(b) = 2.6(3) for the b-axis; K(c) = 132(4) GPa [βc = 0.00252(7) GPa−1] and K′(c) = 3.3(3) for the c-axis. The elastic anisotropy of topaz at room-P can be expressed as: K(a):K(b):K(c) = 1.10:1.67:1.00 (βa:βb:βc = 1.50:1.00:1.66). A series of structure refinements have been performed based on the intensity data collected at high pressure, showing that the P-induced structure evolution at the atomic scale is mainly represented by polyhedral compression along with inter-polyhedral tilting. A comparative analysis of the elastic behavior and P/T-stability of topaz polymorphs and “phase egg” (i.e., AlSiO3OH) is carried out.
G. D. Gatta (*) Dipartimento di Scienze della Terra, Università degli Studi di Milano, Via Botticelli, 23, 20133 Milan, Italy e-mail:
[email protected]
S. Petitgirard · H.-P. Liermann Photon Science, Deutsches Elektronen-Synchrotron DESY, Notkestrasse 85, 22607 Hamburg, Germany
G. D. Gatta CNR - Istituto di Cristallografia, Sede di Bari, Via G. Amendola 122/o, Bari, Italy W. Morgenroth Abt. Kristallographie, Institut für Geowissenschaften, Goethe-Universität Frankfurt am Main, 60438 Frankfurt am Main, Germany
Keywords Topaz · High pressure · Single-crystal synchrotron X-ray diffraction · Compressibility · Structure refinement
Present Address: P. Dera School of Ocean and Earth Science and Technology, Hawaii Institute of Geophysics and Planetology, University of Hawaii at Manoa, Honolulu, HI, USA S. Petitgirard Bayerisches GeoInstitut (BGI), University of Bayreuth, 95444 Bayreuth, Germany
P. Dera Argonne National Laboratory, Center for Advanced Radiation Sources, University of Chicago, Argonne, IL, USA
13
Phys Chem Minerals
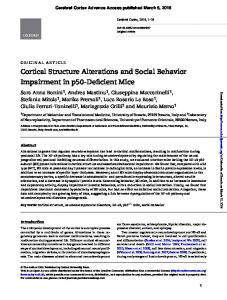
Fig. 1 (Left side) Clinographic view of the crystal structure of topaz, based on the neutron structure refinement of Gatta et al. (2006a). (Right side) A view of the crystal structure of topaz down [100], with Si-tetrahedra shown as closed-faces polyhedra and Al-octahedra rep-
resented as balls and sticks. The compressional “weak zones” along [001] (i.e., “tetrahedra-free zones”, see text for further details) are represented in light orange overlying the crystal structure
Introduction
and Rosenberg 1971; Akizuki et al. 1979; Parise et al. 1980; Ribbe 1982; Barton 1982; Barton et al. 1982; Northrup et al. 1994; Wunder et al. 1993, 1999; Alberico et al. 2003; Chen and Lager 2005; Chen et al. 2005, Gatta et al. 2006a). These studies show that natural topaz, usually with OH/ (OH + F) 10 GPa and to gain a better understanding of the anomalous compressional behavior of topaz, we undertook a single-crystal diffraction study of natural topaz to pressures of 45.3 GPa.
Experimental methods The gem-quality, natural crystal of topaz (Al2.00Si1.05O4.00 (OH0.26F1.75)) used for this study originated from the pneumatolytic-hydrothermal deposit in Ouro Preto, Minas Gerais, Brasil, and was characterized in detail by Gatta et al. (2006a) by single-crystal X-ray and neutron diffraction, polarized infrared spectroscopy, electron microprobe analysis in wavelength dispersive mode, and laser ablation inductively coupled plasma mass spectroscopy. A 100μm2 and 10-μm-thick single-crystal fragment of topaz was loaded in a Boehler–Almax-type Diamond Anvil Cell with an opening of 85° to maximize access to reciprocal space. Three hundred micrometers of diamond culets reduced the 192-μm-thick tungsten gasket to 35 μm, which was consequently drilled with a 160-μm gasket hole using the laser drilling facility at the Department of Crystallography at the University of Frankfurt. The same facility provided gas loading capabilities to fill the gasket hole with Ne as a pressure transmitting medium, in order to create quasi-hydrostatic conditions around the single crystal of topaz. Three ruby spheres were used for fluorescence pressure measurements (Mao et al. 1986). Single-crystal data were collected at GSECARS experimental station 13ID-D of the Advanced Photon Source, Chicago, using the dedicated diamond anvil cell setup. Diffraction data originated from the interaction of the single crystal with a 5(H) × 8(V) μm2 (FWHM) KB mirror focused beam with an energy of 37 keV (λ = 0.3344 Å). The crystal orientation was determined with ω-scan step of 1° and exposure time of 0.5 s per step, while intensity data were collected with ω-scan rotation of 80° and exposure time of 20 s, using a Mar165 CCD (79 × 79 μm2 pixels). Sample to detector distance (SDD) was 200.1 mm. Detector geometry parameters were calibrated with CeO2 standard from NIST
(674b). Since the full opening angle of ±40° could not be covered by the size of the Mar165 CCD at the given SDD, the CCD was offset by ±70 mm and two additional data sets were collected. The data sets were later merged after indexing. Refinement of unit-cell parameters and reduction in intensity data were performed using GSE_ADA as well as RSV as described in detail by Dera et al. (2013). A total of 12 data sets were collected between 6.6 and 45.3 GPa (Table 1) and at room-T. At P > 46 GPa, the gasket partially collapsed and the crystal was irreversibly damaged. The structural refinements (against F) at different pressures were performed with Jana2006 software (Petricek et al. 2006), starting from the structural model previously reported by Gatta et al. (2006b). The neutral X-ray scattering curves of Al, Si, O, and F were used, according to the International Tables for Crystallography C (Wilson and Prince 1999). Hydrogen atoms were not included in the structural model. The refinements were conducted using isotropic displacement parameters for all the atomic sites; displacement parameters for oxygen were restricted to one parameter common to all atoms. Convergence was rapidly achieved for all the high-pressure refinements, with no significant residuals in the difference-Fourier map of the electron density and no significant correlation among the refined parameters in the variance–covariance matrix. Further details pertaining to the structure refinements are listed in Table 1. The refined atomic positions and displacement parameters are listed in Table 2. Bond lengths and other relevant structural parameters are given in Table 3.
Results and discussion In order to compare the elastic behavior based on the results of this study and on the experimental findings by Gatta et al. (2006b), the evolution of the cell parameters normalized to the values at room-P is shown in Fig. 2. No evidence of phase transition or change in the compressional behavior is observed up to the maximum pressure. Normalized unit-cell volume data of this study, along with those of Gatta et al. (2006b) on the same topaz sample, were fitted to a Murnaghan (M-EoS), II- and III-Birch-Murnaghan EoS. The refined EoS parameters at room-P, using the data weighted by the uncertainties in P and V, are as follows: KV = 159(4) and KV′ = 3.0(3) for a M-EoS fit; KV = 149(2) GPa for a II-BMEoS, and KV = 158(4) and KV′ = 3.3(3) for a III-BM-EoS. If we consider the III-BM-EoS fit, the volume compressibility coefficient at room-P is βV = 1/KV = 0.00633(16) GPa−1. The confidence ellipse at 68.3 % (Δχ2 = 2.30, 1σ) was calculated starting from the variance–covariance matrix of KV and K′ obtained from the III-BM-EoS least-square procedure (Angel 2000). The ellipse is elongated with a negative slope, indicating a negative correlation of the parameters KV and
13
Phys Chem Minerals
Table 1 Details pertaining to the data collections and structure refinements of topaz at different pressures P1
P2
P3
P4
P5
P6
P7
P8
P9
P10
P11
P12
P (GPa) (±0.10)
6.62
9.38
11.34
15.27
19.81
26.02
31.49
37.82
41.00
43.84
45.26
45.33
a-axis (Å)
4.579(1) 4.568(1) 4.559(1) 4.525(1) 4.493(1) 4.446(1) 4.414(1) 4.399(1) 4.364(1) 4.363(1) 4.352(1) 4.360(1)
b-axis (Å)
8.751(2) 8.714(2) 8.690(2) 8.636(2) 8.589(2) 8.512(2) 8.464(2) 8.412(2) 8.377(2) 8.356(2) 8.346(2) 8.348(3)
c-axis (Å) V (Å3)
8.269(1) 8.209(2) 8.180(2) 8.089(1) 8.029(2) 7.927(2) 7.869(2) 7.814(2) 7.767(2) 7.763(2) 7.753(2) 7.739(3) 331.4(2) 326.8(2) 324.1(2) 316.1(2) 309.9(2) 300.0(2) 294.0(2) 289.2(2) 284.0(2) 283.0(2) 281.6(2) 281.7(3)
Z Space Group
4
4
4
4
4
4
4
4
4
4
4
4
Pbnm Radiation (Å) 0.3344 N. measured reflec- 1294 tions 0.1348 Rint
Pbnm 0.3344 402
Pbnm 0.3344 1123
Pbnm 0.3344 1055
Pbnm 0.3344 908
Pbnm 0.3344 895
Pbnm 0.3344 822
Pbnm 0.3344 809
Pbnm 0.3344 772
Pbnm 0.3344 771
Pbnm 0.3344 735
Pbnm 0.3344 767
0.1491
0.1473
0.0760
0.0920
0.0811
0.0961
0.1027
0.0804
0.0766
0.0736
0.0526
N. unique reflections 395 N. obs. refl. I> 3σ(I) 370 −6, 6 Range of h, k, l
142 138
338 326
306 293
250 240
247 242
219 213
216 214
216 214
224 219
214 212
219 215
−5, 6
−6, 6
−6, 6
−5, 6
−5, 5
−4, 5
−4, 5
−5, 5
−5, 5
−5, 5
−4, 4
−13, 13 −9, 9
2θ max (°) R1 (obs)
−13, 13 −9, 9 36.7 22.3 0.1334 0.1158
−13, 13 −13, 13 −12, 13 −13, 13 −12, 13 −13, 13 −13, 13 −12, 13 −13, 13 −13, 13
−13, 13 −13, 13 −13, 12 −12, 12 −12, 12 −12, 12 −12, 12 −12, 12 −12, 11 −12, 12 35.9 36.3 35.8 36.2 35.6 35.2 35.9 35.9 36.2 35.9 0.0837 0.0557 0.0534 0.0461 0.0554 0.0451 0.0453 0.0482 0.0511 0.0485
wR (obs)
0.1400
0.1395
0.0853
0.0539
0.0517
0.0486
0.0505
0.0489
0.0469
0.0478
0.0552
0.0486
wR (all)
0.1402
0.1398
0.0962
0.0540
0.0519
0.0487
0.0506
0.0489
0.0469
0.0478
0.0552
0.0486
20
20
20
20
20
20
20
20
20
20
20
N. refined parameters 20
All data were collected at room temperature Rint, R1 (obs), wR (obs), and wR (all) defined according to Jana2006 (Petricek et al. 2006). For technical problems, the data collected at P2 were limited to a 2θmax = 22°, leading to a lower quality of the structure refinement
KV′, with KV = 158 ± 6 GPa and KV′ = 3.3 ± 4. A linearized III-BM-EoS (Angel 2000) was used to obtain the axialEoS parameters (at room-P), yielding: K(a) = 146(5) GPa [βa = 1/(3K(a)) = 0.00228(6) GPa−1] and K′(a) = 4.6(3) for the a-axis; K(b) = 220(4) GPa [βb = 0.00152(4) GPa−1] and K′(b) = 2.6(3) for the b-axis; K(c) = 132(4) GPa [βc = 0.00252(7) GPa−1] and K′(c) = 3.3(3) for the c-axis. The elastic anisotropy of topaz (at room-P) can be expressed as: K(a):K(b):K(c) = 1.10:1.67:1.00 (βa:βb: βc = 1.50:1.00:1.66). The structure refinements at different pressures show that the unit-cell compression reflects polyhedral tilting and contraction. Polyhedral tilting between Al-octahedra (connected by a (F,O)-bridge) can be described by the evolution of the inter-polyhedral Al-(F,O)-Al angle with P. Its value is 140.8(4)° at 6.6 GPa and decreases to 131.4(2)° at 45.3 GPa (Table 3). The Al–O and Si–O bond distances undergo a pronounced shortening within the P-range investigated (Table 3), governing the polyhedral compression. The bulk moduli (at room-P) of the Sitetrahedra and the Al-octahedra, derived by a II-BM-EoS fit, are as follows: K(Al-octah) = 226(13) GPa and K(Sitetrah) = 354(45) GPa. As shown by the evolution of the
13
polyhedral bond distances with P (Table 3), polyhedral distortions that occur in response to the applied pressure are not very pronounced. The elastic anisotropy of topaz (i.e., K(a):K(b):K(c) = 1.10:1.67:1.00) can be explained on the basis of the polyhedral compression, rather than by tilting. According to Gatta et al. (2006b), viewing the crystal structure of topaz down [100], there is an alternation of tetrahedra and octahedra along the c-axis. The different compressibility of the two polyhedra gives rise to “weak zones” (i.e., “tetrahedra-free zones” in light orange overlying the crystal structure in Fig. 1), which are more compressible. The higher compressibility along [001] reflects the pronounced shortening of the O3–O3 distance (i.e., one edge shared by two Al-octahedra in the “weak zone”; Fig. 1; Table 3) and to the octahedral bond distance Al–O3 (Fig. 1; Table 3) with a reduction of 3.0 and 4.3 % between 6.6 and 45.3 GPa, respectively. In contrast, the contraction along [010] is hindered by the stiffer tetrahedra (Fig. 1), as there is no tetrahedra-free zone along [010], where, e.g, the O1– O2 edge contracts by