On the other hand, positive temperature coefficient of conductivity ... eXPRESS Polymer Letters Vol.4, No.4 (2010) 234â243. Available .... In polymer composite systems dielectric relaxation ... presentation, each relaxation process corresponds.
eXPRESS Polymer Letters Vol.4, No.4 (2010) 234–243 Available online at www.expresspolymlett.com DOI: 10.3144/expresspolymlett.2010.30
Electrical response and functionality of polymer matrix-titanium carbide composites C. G. Raptis, A. Patsidis, G. C. Psarras* Department of Materials Science, School of Natural Sciences, University of Patras, Patras 26504, Hellas (Greece) Received 21 December 2009; accepted in revised form 12 February 2010
Abstract. The dielectric response and conductivity of polymer matrix-titanium carbide composites was examined by means of Broadband Dielectric Spectroscopy in the frequency range of 10–1–107 Hz and over the temperature range of 40–150°C, varying the filler content. Dielectric data were analyzed via the electric modulus formalism. Recorded relaxations were attributed to interfacial polarization, glass to rubber transition and local motions of polar side groups. Alternating current conductivity varies up to seven orders of magnitude with both frequency and temperature. Direct current conductivity increases with temperature, although the rate of its alteration does not remain constant in the examined temperature range. In the low temperature region (up to 60°C) increases at a higher rate, while right afterwards approaches rather constant values. Finally, in the high temperature range (above 90°C) conductivity raises again but at a lower rate. This behaviour adds functionality to the composites’ performance and could be exploited in developing self-current regulators. Keywords: polymer composites, dielectric properties, conductivity, titanium carbide
1. Introduction Polymer matrix ceramic filler composites receive, recently, increased attention because of their interesting electrical, electronic and functional properties [1–6]. Integrated decoupling capacitors, acoustic emission sensors, electronic packaging, self-current regulators, self-heating systems, elements for circuit protection, electrostriction artificial muscles or skins and memory switches are some possible applications [1–6]. Moreover, electrical properties such as dielectric permittivity and conductivity can be suitably adjusted by simply controlling the type and the amount of ceramic inclusions. Titanium carbide is an important material for technological applications because of its high melting point, hardness, elastic modulus, electrical conductivity and low coefficient of thermal expansion. Composite systems consisting of a polymer matrix and conductive particles of titanium carbide have been considered as a novel class of smart materials,
because of their ability to switch from negative to positive temperature coefficient of conductivity [7–9]. Negative temperature coefficient of conductivity (NTCC) is useful in applications such as selfcontrolled heaters, current limiters, sensors, thermistors and over current protectors, while it is considered as detrimental in cable engineering [10]. On the other hand, positive temperature coefficient of conductivity (PTCC) is important in electromagnetic shielding and in antistatic materials [11, 12]. Switching, between NTCC to PTCC and vice versa under controlled conditions adds functionality to the performance of the composite systems and by that increases their technological impact. In the present study, polymer matrix – ceramic TiC composites were prepared at different filler concentrations. Their electrical response was examined by means of Broadband Dielectric Spectroscopy (BDS), over a wide temperature range (40 to 160°C) and in the frequency range of 10–1 Hz to 10 MHz.
*Corresponding author, e-mail: G.C.Psarras upatras.gr @ © BME-PT
234
Raptis et al. – eXPRESS Polymer Letters Vol.4, No.4 (2010) 234–243
Dielectric data are analyzed by means of electric modulus and ac conductivity formalisms.
2. Experimental 2.1. Samples preparation Composite specimens were prepared by employing commercially available materials. In particular a low viscosity epoxy resin (Epoxol 2004A, Neotex S.A., Athens, Greece) was used as a prepolymer, with Epoxol 2004B as curing agent, operating at a slow rate, supplied by the same company. Titanium carbide was purchased by Sigma-Aldrich. The mean particle diameter was less than 2 μm. The preparation procedure involved mixing of the resin with the curing agent in a 2:1 [w/w] ratio and then adding, while the polymer system was still in the liquid state, various amounts of the ceramic powder. Stirring at a low rate and degassing the mixtures in a vacuum-oven were also included in the preparation procedure. The content of titanium carbide in the produced specimens was 20, 30, 40 and 50 parts per hundred [phr] of resin and hardener. The initial curing took place at ambient for a week, followed by post-curing at 100°C for 4 hours. The density of the produced samples is listed in Table 1. The morphology of the produced samples was checked for voids and clusters, by means of Scanning Electron Microscopy (Leo Supra 35VP). In all cases, the distribution of the ceramic particles is considered as satisfactory.
varied from ambient to 200°C. Glass transition temperature (Tg) was determined via the point of inflexion of the transition, by employing suitable software supplied by Perkin Elmer. Tg of pure epoxy resin was found to be 56.6°C. Table 1 summarizes glass transition temperature for all the examined systems.
2.3. Dielectric measurements Dielectric measurements were conducted by means of Broadband Dielectric Spectroscopy (BDS) in the frequency range of 0.1 Hz to 10 MHz, using Alpha-N Frequency Response Analyser, supplied by Novocontrol Technologies (Hundsagen, Germany). The dielectric cell was a three terminal guarded system constructed according to the ASTM D150 specifications. The samples being tested were put between metal electrodes and problems arising from possible electrode polarisation were excluded by analysing data by means of electric modulus formalism [3, 13, 14]. Experimental data were obtained by conducting isothermal frequency scans, for each of examined specimens, from ambient to 150°C with a temperature step of 10°C. The amplitude of the applied test voltage was kept constant at 1000 mV, while the mean sample thickness was approximately 3 mm. In the present study, dc conductivity is considered as equal to the value of σ(ω) at f = 0.1 Hz.
3. Results and discussion 2.2. Thermal characterisation A Diamond (Perkin Elmer, Shelton, USA) Differential Scanning Calorimeter operating at a scan rate of 10°C/min was used to characterise thermal transitions of the employed epoxy resin and composite systems. Samples were placed within an aluminum crucible, while an empty aluminum crucible was serving as reference material. Temperature was Table 1. Density and glass transition temperature for all the examined systems Sample Epoxy Epoxy + 20 phrTiC Epoxy + 30 phr TiC Epoxy + 40 phr TiC Epoxy + 50 phr TiC
Density Glass transition temperature, Tg [°C] [g/cm3] 1.046 56.6 1.092 52.1 1.236 51.5 1.362 50.7 1.400 50.5
Figure 1 depicts images from Scanning Electron Microscopy for all the examined composites. As it can be seen the distribution of TiC particles appears to be a homogeneous, while some agglomerates are present even at low concentration of the ceramic filler. The variation of the real part of dielectric permittivity with frequency at 50°C for all the tested systems is depicted in Figure 2. Permittivity diminishes with frequency, because of the inertia of the permanent and induced dipoles to follow the alternation of the alpplied field, reflecting the reduction of polarization. Values of (ε′) increase with filler content, since the composites become more conductive, their heterogeneity raises, charges accumulate at the interfaces of the system and thus interfacial polarization enhances. 235
Raptis et al. – eXPRESS Polymer Letters Vol.4, No.4 (2010) 234–243
Figure 1. Scanning electron microscopy images of the specimens with (a) 20 phr, (b) 30 phr, (c) 40 phr and (d) 50 phr in TiC content
Figure 2. Real part of permittivity versus frequency for all the tested specimens at 50°C
In polymer composite systems dielectric relaxation effects arise from both the polymer matrix and the interaction with the reinforcing phase. In the present study dielectric data were first expressed in terms of real and imaginary part of dielectric per-
mittivity and then transformed via Equation (1) to the electric modulus presentation. Different formalisms, such as dielectric permittivity, electric modulus and ac conductivity, are able to describe electrical phenomena present in composite systems. However, under some circumstances a specific formalism could prove to be more efficient in extracting information concerning the occurring physical mechanisms. In this study, the dielectric response of all the examined systems was investigated via the electric modulus formalism. Arguments for the resulting benefits of the electric modulus presentation have been exhibited and discussed elsewhere [13–15]. Electric modulus is defined as the inverse quantity of complex permittivity, as shown in Equation (1): 1 ε' ε" = 2 +j 2 2 ε'− jε" ε' +ε" ε ε' +ε"2 = M '+ jM "
M* =
236
1
*
=
(1)
Raptis et al. – eXPRESS Polymer Letters Vol.4, No.4 (2010) 234–243
where ε′, M′ and ε″, M ″ are the real and the imaginary parts of dielectric permittivity and electric modulus respectively. Figures 3 and 4 present isothermal scans of the real and imaginary part of electirc modulus for the composites with 20 and 50 phr in TiC particles, at temperatures varying from 40 to 150°C. The existence of a clear ‘step-like’ transition from low to high values of (M′), at moderate frequencies, is evident in Figures 3a and 4a. Two additional transitions are detected in the high and the low frequency region respectively. The latter becomes more evident at high temperatures. All three transitions are related to dipolar relaxations effects occurring in the examined systems, and thus should be accompanied by the formation of dielectric loss peaks in the respective M″ = F(logf) plots. In Figures 3b and 4b loss peaks can be observed in the frequency range where transitions occur. Note that at the high frequency edge a tendency for the formation of the
third peak is recorded. Because of frequency-temperature superposition, loss peaks shift to higher frequencies as the temperature is raised. Shift rate of the main peak, in the intermediate frequency zone, appears to be constant in the temperature interval from 50 to 100°C, while at higher temperatures peak shift rate diminishes with the simultaneous increase of the loss modulus maxima. Figure 5 depicts comparative plots of the real and imaginary part of electric modulus as a function of frequency, for all the examined composites, at 150°C. The presence of, at least, two relaxation processes is evident. Loss maxima of the relaxation process recorded in the intermediate frequency region diminish monotically with filler concentration. The Cole-Cole plots of all the examined specimens, at 150°C, are presented in Figure 6. In the Cole-Cole presentation, each relaxation process corresponds to a semicircle, which might appear completed or even uncompleted. In Figure 6, two distinct semi-
Figure 3. Real (a) and imaginary (b) part of electric modulus versus frequency for the specimen with 20 phr in TiC content
Figure 4. Real (a) and imaginary (b) part of electric modulus versus frequency for the specimen with 50 phr in TiC content
237
Raptis et al. – eXPRESS Polymer Letters Vol.4, No.4 (2010) 234–243
Figure 5. Real (a) and imaginary (b) part of electric modulus versus frequency for all the tested composites at 150°C
Figure 6. Cole-Cole plots for all the tested specimens at 150°C
circles are clearly formed, in the low and intermediate frequency zone, while in the high frequency edge the initiation of a third semicircle is evident. In the low frequency range, traces of the small semicircle (inset of Figure 6) pass from the origin of the graph, implying that this is the slowest relaxation process present in the examined systems. Assigning dielectric relaxation processes to specific physical mechanisms is not an easy procedure and presupposes experience and an overall inspection of the dielectric performance. Aforementioned remarks lead to the following assignment of dielectric processes. Ascending frequency, at constant temperature, the recorded relaxation processes are attributed to Interfacial Polarization (IP) known also as Maxwell-Wagner-Sillars (MWS) effect, glass to rubber transition (α-mode) of the polymer matrix and local rearrangements of polar side groups of the main polymer chain (β-mode). Interfacial polarization is present in heterogeneous systems, and its origin is attributed to the accumulation of mobile charges at the interface of the composite system. Charges at the polymer matrix/TiC parti-
cles interface form large dipoles, which attempt to align themselves parallel to the applied field. However, induced dipoles exhibit inertia in following the alternation of the applied field, and thus the resulting relaxation process is characterised by enhanced relaxation time and recorded at low frequencies and high temperatures. The temperature dependence of electric modulus loss index (M″), at constant frequency, for all the examined systems is presented in Figure 7. The main dielectric loss peak, which is recorded in the dielectric spectra of all specimens in the intermediate frequency region, is now formed in the vicinity of 55°C for the unfilled epoxy resin, and a few degrees lower in the case of the composite systems, at f = 0.1 Hz in Figure 7a. In dielectric loss versus temperature spectra is a rule of thumb to determine glass transition temperature from the position of the relative loss peak (α-relaxation process) at constant frequency equal to 0.1 Hz [16–19]. Derived value for glass transition temperature, via DSC measurements, of pure polymer matrix (56.6°C) appears to be very close with the position of loss peak in Figure 7a, supporting further the assignment of this process to glass to rubber transition of the epoxy resin. At temperatures near Tg, polymer acquire sufficient thermal energy, allowing large parts of macromolecular chains to relax simultaneously in a cooperative motion and thus giving rise to α-relaxation process. As already stated the corresponding peak of composite systems in Figure 7a, is formed at slightly lower temperatures and appears not to vary with the filler content. In polymer matrix/ ceramic filler composites variation of glass transition temperature between pure polymer and com238
Raptis et al. – eXPRESS Polymer Letters Vol.4, No.4 (2010) 234–243
Figure 7. Imaginary part of electric modulus as a function of temperature, for all the tested specimens, at (a) f = 0.1 Hz and (b) f = 1 MHz
posite systems have been observed and reported [20–22]. These variations have been attributed to interactions between polymer matrix/ceramic filler and to the wetting level of inclusions. Figure 7b depicts the variation of loss modulus index with temperature, at 1 MHz. The presence of a weak relaxation mechanism becomes evident via the formation of a broad peak, which maxima diminish with filler content. This is a fast relaxation process, characterised by a sort relaxation time, which is attributed to rearrangement of polar side groups of the polymer chain (β-mode). It is also evident in the spectrum of pure matrix and becomes weaker with filler content, indicating that ceramic particles may exert restrictions on local motions. Figure 8 presents the temperature dependence of loss peak position, or in other words the relaxation rate, for both IP and α-relaxation processes. Because of the frequency and temperature superpo-
sition, loss peaks shift to higher frequencies when temperature is raised (Figures 3 and 4). However, peak shift rate varies from process to process, although in some cases this rate is constant and the relative process appears to be temperature independent [23]. Interfacial polarization follows Arrhenius type behaviour, described by Equation (2): ⎛ E ⎞ f max = f 0 exp⎜⎜ − A ⎟⎟ ⎝ k BT ⎠
where EA is the activation energy of the process, f0 pre-exponential factor, kB the Boltzmann constant and T the absolute temperature. Peak shift rate of α-relaxation process is not constant and can be described via Vogel-Fulcher-Tamann equation, which considers that relaxation rate increases rapidly at lower temperatures because of the reduction of free volume. The following relation expresses VFT equation (Equation (3)): ⎛ AT0 f max = f 0 exp⎜⎜ − ⎝ T − T0
Figure 8. Loss peak position as a function of the reciprocal temperature for the IP and α-relaxation processes, for all the examined systems
(2)
⎞ ⎟⎟ ⎠
(3)
where f0 is a pre-exponential factor, A a constant being the measure of activation energy, T0 the Vogel temperature or ideal glass transition temperature and T the absolute temperature. Values of activation energy for IP process calculated via linear regression of Equation (2) for all the examined systems, as well as fitting parameters for α-mode determined via Equation (3), are listed in Table 2. It should be noted that activation energy of the IP (MWS) process increases with TiC content, with the only exception of the specimen with 30 phr titanium carbide. The increase of activation energy 239
Raptis et al. – eXPRESS Polymer Letters Vol.4, No.4 (2010) 234–243
Table 2. Values of activation energy, calculated via Equation (2), for the IP process, and fitting parameters of Equation (3) for α-mode Sample Epoxy Epoxy + 20 phr TiC Epoxy + 30 phr TiC Epoxy + 40 phr TiC Epoxy + 50 phr TiC
α-mode T0 [K] 285 280 278 277 271
A 2.1 1.7 1.6 1.3 1.3
IP/EA [eV] 0.485 0.511 0.369 0.525 0.660
signifies enhanced heterogeneity. The maximum value of the parameter T0, for the α-mode, corresponds to the unfilled epoxy, and then decreases gradually with filler content, being in qualitative accordance with the results of Figure 7a. Finally, the parameter A diminishes systematically with filler content, indicating that the required amount of thermal energy for the agitation of α-relaxation process decreases with TiC concentration. Recalling Figure 7a, it seems that the reduction of both activation energy (via parameter A) and glass transition temperature in the composite systems, compared to the corresponding values of pure polymer matrix, is in accordance with the M ″ = F(θ) data. This behaviour could be considered as indirect indication for the existence of weak interactions between ceramic filler and polymer macromolecules, and at the same time for moderate adhesion of TiC particles by the matrix. The dispersion of ac conductivity with frequency and temperature for the systems with 20 and 50 phr in TiC particles is depicted in Figure 9. Alternating current conductivity has been calculated from the dielectric loss, according to Equation (4):
σ AC = ε 0 ωε′′
(4)
where ε0 = 8.854·10–12 F/m is the permittivity of free space, (ε″) the permittivity loss index and ω the angular frequency of the applied field. The examined systems exhibit a strong dispersion of ac conductivity with frequency and temperature approaching seven orders of magnitude. At low frequencies σAC remains constant or tends to acquire constant values. At higher frequencies becomes strongly frequency dependent, varying approximately as a power of the frequency. When the frequency of the applied field is low, charge carries are forced to drift over large distances addressing difficulties because of the insulating nature of the matrix. On the other hand, when the frequency of the applied field is high the mean displacement of the charges is significantly reduced and at the same time the transport rate between adjacent conductive sites is raised leading to enhanced conductivity. The formed peaks in the intermediate frequency zone are attributed to the presence of dielectric relaxation processes. Finally, the influence of temperature is more evident in the low frequency region. Variation of ac conductivity with frequency at low and high frequencies is in accordance with Equation (5), which is also known as the ‘ac universality law’ [24], which is expressed mathematically as: σ AC = σ DC + Kωs
(5)
where σDC is the ω → 0 limiting value of σAC and K, s parameters depending on temperature and filler content [25]. Deviations occurring in the intermediate frequency region are attributed to the unsuit-
Figure 9. Ac conductivity versus frequency for the specimens with (a) 20 phr and (b) 50 phr in TiC content, at various temperatures
240
Raptis et al. – eXPRESS Polymer Letters Vol.4, No.4 (2010) 234–243
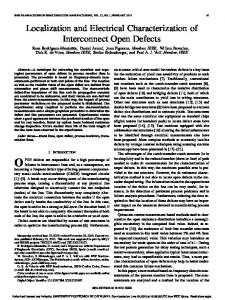
ability of ‘ac universality law’ to describe dielectric phenomena. Analogous deviations in different type polymer matrix composites have been reported in the past [26, 27]. Figure 10a presents the influence of temperature upon dc conductivity. Extrapolation of ac conductivity to zero frequency enables the evaluation of dc conductivity. In this study, dc conductivity is considered as equal to the value of σ(ω) at the lowest measured frequency (f = 0.1 Hz). Up to 60°C, a temperature very close to Tg, conductivity increases with temperature (dσ/dθ > 0) indicating a typical insulating or semiconductive behaviour. At intermediate temperatures, higher than the glass transition temperature of the matrix, conductivity stops increasing approaching a plateau, which extends to a range of 30°C (almost from 60 to 90°C). The thermal expansion of the polymer matrix and the consecutive disruption of conductive paths could be considered as responsible for this behaviour. At higher temperatures conductivity raises again. In this temperature range, polymer’s mobility is further increased. Transport of charges is facilitated since they are subjected to higher thermal activation and the enhanced mobility of macromolecules allows the formation of new conductive paths. The dependence of conductivity on the reciprocal temperature for all the examined systems is depicted in Figure 10b. The temperature dependence of conductivity in insulators and semiconductors follows the Equation (6) [28, 29]:
where σ0 is a pro-exponential factor, EA the activation energy of the process, kB the Boltzmann constant and T the absolute temperature. Assuming, at first approximation, that data can be described by Equation (6) in the regions of low and high temperatures, the activation energies of the occurring processes at these two ranges can be evaluated. Obtained values for each of the examined systems are listed in Table 3. As it can be seen, at temperatures well above Tg, conduction process appears to be easier, and is characterised by smaller activation energies. Finally, charge transport process in the low temperature range requires increased amount of thermal agitation for its own onset. In the examined set of composites no NTCC effect was observed. However, the variation of the curvatures in the σDC = F(T) plots for all composite specimens, at the same temperature range (60–90°C), and the existence of a common point of inflexion at 80°C offer functionality to the composites performance. The latter is related to the possibility to tune the conductivity of the composites via controlling temperature, without any external adjusting device or circuit. This behaviour could be proved very useful in developing self-current regulating systems. Under this point of view more research should be
⎡ E ⎤ σ(T ) = σ 0 exp ⎢− A ⎥ ⎣ k BT ⎦
Epoxy Epoxy + 20 phr TiC Epoxy + 30 phr TiC Epoxy + 40 phr TiC Epoxy + 50 phr TiC
Table 3. Values of activation energy, calculated via Equation (6), for the conduction processes at low and high temperatures Sample
(6)
EA [eV] (40–70°C) 1.540 1.287 1.369 1.175 1.306
EA [eV] (80–150°C) 0.531 0.525 0.500 0.477 0.661
Figure 10. Dc conductivity as a function of (a) temperature and (b) reciprocal of temperature for all the tested systems
241
Raptis et al. – eXPRESS Polymer Letters Vol.4, No.4 (2010) 234–243
[3] Kontos G. A., Soulintzis A. L., Karahaliou P. K., Psarras G. C., Georga S. N., Krontiras C. A., Pisanias M. N.: Electrical relaxation dynamics in TiO2-polymer matrix composites. Express Polymer Letters, 1, 781–789 (2007). DOI: 10.3144/expresspolymlett.2007.108 [4] Chanmal C. V., Jog J. P.: Dielectric relaxations in PVDF/BaTiO3 nanocomposites. Express Polymer Letters, 2, 294–301 (2008). DOI: 10.3144/expresspolymlett.2008.35 [5] Patsidis A., Psarras G. C.: Dielectric behaviour and functionality of polymer matrix-ceramic BaTiO3 composites. Express Polymer Letters, 2, 718–726 (2008). DOI: 10.3144/expresspolymlett.2008.85 [6] Wang F., Zhou D., Gong S.: Dielectric behavior of TiC-PVDF nanocomposites. Physica Status Solidi Rapid Research Letters, 3, 22–24 (2009). DOI: 10.1002/pssr.200802232 [7] Liu Y., Oshima K., Yamauchi T., Shimomura M., Miyauchi S.: Temperature-conductivity characteristics of the composites consisting of fractionated poly(3-hexylthiophene) and conducting particles. Journal of Applied Polymer Science, 77, 3069–3076 (2000). DOI: 10.1002/1097-4628(20000929)77:143.0.CO;2-B [8] Sung Y. K., El-Tantawy F.: Novel smart polymeric composites for thermistors and electromagnetic wave shielding effectiveness from TiC loaded styrene-butadiene rubber. Macromolecular Research, 10, 345–358 (2002). [9] El-Tantawy F.: New double negative and positive temperature coefficients of conductive epdm rubber TiC ceramic composites. European Polymer Journal, 38, 567–577 (2002). DOI: 10.1016/S0014-3057(01)00208-7 [10] El-Tantawy F.: Joule heating treatments of conductive butyl rubber/ceramic superconductor composites: A new way for improving the stability and reproducibility? European Polymer Journal, 37, 565–574 (2001). DOI: 10.1016/S0014-3057(00)00134-8 [11] Kataoka M., Masuko T.: PTC characteristics of (TiC/polyethylene) conductive composites in relation to their particle-filled structures. Electrical Engineering in Japan, 152, 1–9 (2005). DOI: 10.1002/eej.20115 [12] Ghosh P., Chakrabarti A.: Conducting carbon black filled EPDM vulcanizates: Assessment of dependence of physical and mechanical properties and conducting character on variation of filler loading. European Polymer Journal, 36, 1043–1054 (2000). DOI: 10.1016/S0014-3057(99)00157-3 [13] Tsangaris G. M., Psarras G. C., Kouloumbi N.: Electric modulus and interfacial polarization in composite polymeric systems. Journal of Materials Science, 33, 2027–2037 (1998). DOI: 10.1023/A:1004398514901
carried out on this topic in order to clarify the occurring physical mechanisms.
4. Conclusions Based on the experimental data of dielectric behaviour and conductivity of the tested epoxy resin/TiC composites, the following conclusions can be drawn. – Ascending frequency, at constant temperature, the recorded processes are attributed to interfacial polarization, glass to rubber transition of the polymer matrix and local motions of polar side groups. – Decreasing of Tg in polymer composites is attributed to enhancement in cooperative segmental mobility resulting from weak interactions between polymer chains and TiC particles and to the moderate adhesion level of the inclusions by the matrix. – All systems exhibit strong dispersion of ac conductivity (up to 7 orders of magnitude) with frequency and temperature. – Direct current conductivity of the composites is temperature dependent and, in general, increases with temperature. In the low temperature range conductivity alters with temperature at a higher rate, while in the intermediate zone appears to remain constant, and in the high temperature region conductivity increases again, but at lower rate. Tuning conductivity with temperature offers functionality to the composite systems, which could be exploited in high tech applications.
References [1] Chahal P., Tummala R. R., Allen M. G., Swaminathan M.: A novel integrated decoupling capacitor for MCM-L technology. IEEE Transactions on Components Packaging and Manufacturing Technology Part B-Advanced Packaging, 21, 184–193 (1998). DOI: 10.1109/96.673707 [2] Dias C. J., Igreja R., Marat-Mendes R., Inacio P., Marat-Mendes J. N., Das-Gupta D. K.: Recent advances in ceramic-polymer composite electrets. IEEE Transactions on Dielectrics and Electrical Insulation, 11, 35–40 (2004). DOI: 10.1109/TDEI.2004.1266314
242
Raptis et al. – eXPRESS Polymer Letters Vol.4, No.4 (2010) 234–243
[14] Psarras G. C., Manolakaki E., Tsangaris G. M.: Electrical relaxations in polymeric particulate composites of epoxy resin and metal particles. Composites Part A: Applied Science and Manufacturing, 33, 375–384 (2002). DOI: 10.1016/S1359-835X(01)00117-8 [15] Psarras G. C., Gatos K. G., Karahaliou P. K., Georga S. N., Krontiras C. A., Karger-Kocsis J.: Relaxation phenomena in rubber/layered silicate nanocomposites. Express Polymer Letters, 1, 837–845 (2007). DOI: 10.3144/expresspolymlett.2007.116 [16] Hedvig P.: Dielectric spectroscopy of polymers. Adam Hilger, Bristol (1977). [17] McCrum N. G., Read B. E., Williams G.: Anelastic and dielectric effects in polymer solids. Wiley, London (1967). [18] Ngai K. L.: Test of expected correlation of polymer segmental chain dynamics with temperature-dependent time-scale shifts in concentrated solutions. Macromolecules, 24, 4865–4870 (1991). DOI: 10.1021/ma00017a023 [19] Korzhenko A., Tabellout M., Emery J. R.: Influence of a metal-polymer interfacial interaction on dielectric relaxation properties of polyurethane. Polymer, 40, 7187–7195 (1999). DOI: 10.1016/S0032-3861(99)00055-5 [20] Grohens Y., Brogly M., Labbe C., David M-O., Schultz J.: Glass transition of stereoregular poly(methyl methacrylate) at interfaces. Langmuir, 14, 2929–2932 (1998). DOI: 10.1021/la971397w [21] Grohens Y., Hamon L., Reiter G., Soldera A., Holl Y.: Some relevant parameters affecting the glass transition of supported ultra-thin polymer films. The European Physical Journal E: Soft Matter and Biological Physics, 8, 217–224 (2002). DOI: 10.1140/epje/i2001-10088-4
[22] Hartmann L., Gorbatschow W., Hauwede J., Kremer F.: Molecular dynamics in thin films of isotatctiv poly(methyl methacrylate). The European Physical Journal E: Soft Matter and Biological Physics, 8, 145– 154 (2002). DOI: 10.1140/epje/i2001-10073-y [23] Soulintzis A., Kontos G., Karahaliou P. K., Psarras G. C., Georga S. N., Krontiras C. A.: Dielectric relaxation processes in epoxy resin-ZnO composites. Journal of Polymer Science Part B: Polymer Physics, 47, 445–454 (2009). DOI: 10.1002/polb.21649 [24] Jonscher A. K.: Universal relaxation law. Chelsea Dielectric Press, London (1996). [25] Tsangaris G. M., Psarras G. C., Manolakaki E.: DC and AC conductivity in polymeric particulate composites of epoxy resin and metal particles. Advanced Composites Letters, 8, 25–29 (1999). [26] Psarras G. C., Manolakaki E., Tsangaris G. M.: Dielectric dispersion and ac conductivity in – iron particles loaded – polymer composites. Composites Part A: Applied Science and Manufacturing, 34, 1187– 1198 (2003). DOI: 10.1016/j.compositesa.2003.08.002 [27] Psarras G. C.: Hopping conductivity in polymer matrix-metal particles composites. Composites Part A: Applied Science and Manufacturing, 37, 1545– 1553 (2006). DOI: 10.1016/j.compositesa.2005.11.004 [28] Psarras G. C.: Charge transport properties in carbon black/polymer composites. Journal of Polymer Science Part B: Polymer Physics, 45, 2535–2545 (2007). DOI: 10.1002/polb.21278 [29] Psarras G. C.: Conduction processes in percolative epoxy resin/silver particles composites. Science of Advanced Materials, 1, 101–106 (2009). DOI: 10.1166/sam.2009.1015
243