Electromagnetic Simulation and Design of Complex, Planar Bus Bars for Multi-Level, High Power Converters Didier Cottet, Ivica Stevanović Corporate Research ABB Switzerland Ltd. 5405 Baden-5-Dättwil, Switzerland Email:
[email protected]
Abstract–In this paper, a state-of-the-art electromagnetic PEEC simulator is used in combination with task specific modeling methods to simulate a complex, planar bus bar of an actual multi-level, high power converter. The task specific modeling method proposed consists of defining the exact objective of the simulation and to make use of the bus bar’s typical AC and DC impedance characteristics in terms of inductance and resistance when defining the mesh. This way, the simulation effort is significantly reduced, thus allowing efficient layout changes based on simulated current densities and magnetic field patterns. For the critical commutation loop of the case study bus bar used in this work, the stray inductance was reduced by about 15 % with only minor layout modifications and minimal simulation effort. Keywords–inductance; magnetic field; mesh density; peec
I.
INTRODUCTION
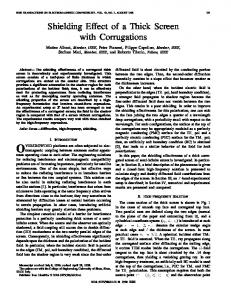
Bus bar simulation studies found in literature are typically focusing on terminal-to-terminal stray inductances for circuit simulations [1]-[4], layout analysis for stray inductance reduction [5]-[9], and bus bar macro modeling for use in system-level simulations [10]-[14]. In most cases, only selective simulations of relatively small bus bars are performed, thus reducing modeling and computation effort in order to demonstrate the principles. In this paper we take a look at larger, more complex bus bar structures, such as often used in actual multi-level (3 to 5 levels), high power (0.5 to 5 MW) converters (Fig. 1). The bus bar shown is used for interconnection of a high number of IGBT power modules in one multi-level AC-DC phase leg. Three such phase legs are forming one three-phase inverter, hence a complete AC-DCAC converter contains six such bus bars. The objective of this work is to be able to perform the simulation and design tasks with reasonable computing effort on standard desktop computers, thus meeting typical product development conditions. This is achieved by two means: 1) use of modern, state-of-the-art electromagnetic simulation tools, and 2) application of task specific bus bar modeling techniques.
978-1-4244- 9373-9/12/$26.00 ©2012 IEEE
The simulation tool used in this work is based on the partial element equivalent circuit (PEEC) simulation method [15]. Recent advances have allowed significant acceleration of PEEC solvers, by either applying numerical improvements such as the reluctance matrix method [16], or by supporting modern multi-core, 64 bit CPU technologies. The solver used in this paper has been implemented at Luleå University of Technology [17], [18]. With fast solvers, one might be tempted to just create an ‘all-in-one’ type model with a fine enough mesh and performing all design relevant simulations on that model. Such a model would however again become large and computationally demanding, thus inefficient for design purposes. Instead we propose using dedicated model complexities and mesh densities, adapted to specific design tasks, but all based on the same parameterized model. The design tasks discussed here consist of analyzing • • • •
stray inductances Lσ, path resistances R, magnetic field patterns H, and current density distributions J.
The creation of the bus bar macro models for use in system level circuit simulations is not scope of this work. The paper first describes the problem investigated in Section II and then explains the different task specific modeling methods in Section III. Section IV discusses the simulation results and Section V finally draws the conclusions. I.
PROBLEM DESCRIPTION
The PEEC method has been proven in many publications to be well suited for bus bar type structures [1], [13], [14]. However, for larger problems, the computation time and memory demands often turned out to become prohibitively large. Different approaches have therefore been presented in literature allowing to use PEEC simulations in bus bar design.
(a)
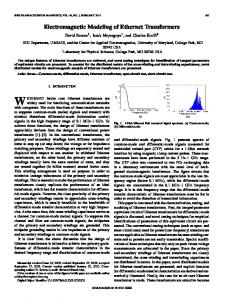
(Ltransition). The resistance has a constant DC and low frequency value (RDC/LF) up to where skin and proximity effects start, and a frequency dependent, increasing high frequency resistance (RHF). In this work we focus on the frequency range below the bus bar’s self-resonances (Here, the self-resonances of the bus bar have been simulated to start at about 60 MHz). For verification purposes, Fig. 2(a) and Fig. 2(b) also include reference measurements performed with an Agilent 4294A impedance analyzer with open/short calibration. Note: An offset of LOS = -25 nH was applied to the inductance measurement curves to compensate for the residual inductance of the shorting element used for the calibration. The bus bar’s IGBT terminals were shorted using copper bar elements as shown in Fig. 3. In order to quickly implement model variants, we suggest using parameterized models with structured meshes. The relevant model parameters are conductor thicknesses, conductor gaps, conductor width and length, and the mesh densities in planar (Fig. 4(a)) and cross sectional (Fig. 4(b)) current flow directions. Besides the discretization number m, also a non-uniformity ratio r is used to vary the mesh density towards edges and corners. 320 Measurement
300
Simulation, m=0
280
(b)
II.
TASK SPECIFIC MODELING
Fig. 2 shows the typical impedance characteristics in terms of inductance and resistance that apply to the majority of bus bars used in power electronics [10], [11]. The inductance has a constant DC and low frequency value (LDC), an essentially constant AC value (LAC) and a transition range
Inductance [nH]
A common solution is to divide the system into numerically smaller thus solvable sub-systems and to then recombine the partial solutions at system level, also known as the divide-and-conquer method [12], [13]. However, in [13] for example, the bus bar was characterized by its long straight 3-level bars (11 meters total length with plus, neutral and minus potentials) with 18 large capacitors distributed along the bus bar, representing an inline arrangement of repetitive identical structures. In such an arrangement, the individual structures have negligible coupling and are therefore predestined for the divide-and-conquer approach. In the multi-layer bus bar investigated in this work, almost all bar elements are strongly coupled to each other, therefore prohibiting the divide-and-conquer method and obliging to include the entire bus bar into one model.
Simulation, m=2, r=4
240
Simulation, m=4, r=2
220 200 180 160
LDC
Ltransition
LAC
140 120 1.E+01
1.E+02
1.E+03 1.E+04 Frequency [Hz]
1.E+05
1.E+06
1.E+05
1.E+06
(a) 0.009 0.008
Measurement Simulation, m=0
0.007 Resistance [Ohm]
Figure 1. Actual photograph (a) and corresponding PEEC model (b) of the case study multi-layer bus bar.
Simulation, m=2, r=2
260
Simulation, m=2, r=2
0.006
Simulation, m=2, r=4
0.005
Simulation, m=4, r=2
0.004 0.003
RDC/LF
RHF
0.002 0.001 0.000 1.E+01
1.E+02
1.E+03 1.E+04 Frequency [Hz]
(b) Figure 2. Simulated inductances (a) and resistances (b) with different mesh densities, compared to measurements.
(a) Planar mesh. (a)
(b) Various thickness meshes (m=0, m=2/r=2, m=2/r=4, m=4/r=2). Figure 4. Planar mesh with controllable corner and edge densities (a) and thickness mesh with controllable discretization (b).
(b) Figure 3. Model (a) and actual photograph (b) of the short circuit elements at the IGBT module terminals.
A.
Modeling for inductance extraction
The curves in Fig. 2(a), show that the thickness mesh has almost no impact on the extraction of the stray inductances. If stray and mutual inductances are the only result expected from simulations, a 2D mesh with no thickness discretization (m = 0 in Fig. 4(b)) provides almost identical results as with denser thickness mesh. B.
Modeling for resistance extraction
The curves in Fig. 2(b) show a clear mesh dependency for higher frequencies. This means that for DC and low frequency results, the coarse mesh (m = 0) is sufficient. For higher frequencies however, a larger, non-uniform discretization (m = 2, r = 4) provides significantly better results. It is actually the thickness of the outermost mesh layer that determines the frequency range up to which the results are accurate. A useful first approximation to determine this thickness is the classical equation for skin depth calculation ߜൌට
ଶ
ఠఓఙ
.
(1)
Strictly speaking, this equation is only valid for circular conductor cross sections. An improved model for rectangular cross sections has therefore been presented in [19]. However, for the wide and thin bus bar plates used here and with the strong proximity effects applying, numerical verification of the mesh is preferred. C.
Current densities and magnetic field patterns
The magnetic field patterns around the bus bars are determined by the actual current flow in the bus bar conductors. Analysis of the current paths and densities, and the resulting magnetic field patterns allows detecting inductive loops and determining critical layout elements where design changes can be applied to remove those loops. The frequency characteristic of the stray inductance (LDC and LAC) indicates that basically only two current paths exist. If the design task is to reduce the stray inductances, the current densities and magnetic field patterns at DC and AC, simulated with the coarse mesh (m = 0) provide sufficient accuracy (Fig. 5). For the case where a quantitative analysis of the magnetic field pattern is done (i.e. coupling into gate unit electronics), local mesh refinements (planar and crosssectional) is needed where high current densities and hence high magnetic field strength have been found. Current density distributions are typically also used to identify current crowding, which can potentially lead to
TABLE I. MESH CHARACTERISTICS FOR TASK SPECIFIC SIMULATION MODELS WITH MEASURED COMPUTATION EFFORT QUANTITIES
Unknowns
Memory [GB]
Time/freq [secs]
Coarse mesh, m = 0
7’922
0.18
22
RDC extraction
Coarse mesh, m = 0
7’922
0.18
22
RHF extraction
Fine cross section mesh, m = 2, r = 4
33’272
2.7
198
Lσ optimization using J distribution and H-field distribution
Coarse mesh, m = 0
7’922
0.18
22
H-field pattern analysis
Coarse mesh with local refinement
8’581
0.19
34
Current density J hot spots analysis
Coarse mesh with local refinement
8’581
0.19
34
Bus bar simulation tasks
Model mesh characteristics
Lσ extraction
thermal hot spots due to Joule losses. In this case, the quantitative numerical accuracy is important since we want to determine whether a hot spot is not just a numerical singularity and whether the actual current density value and the resulting power loss is critical for the design or not. Therefore, a much denser meshing (planar and crosssectional) is required, but only locally, for the hot spot under investigation. The rest of the model can remain coarsely meshed (i.e., m = 0). Therefore, the complexity of the bus bar model is only slightly increased. D.
sparsification was chosen such as to keeping the introduced error below 2 % compared to the exact solution. Nontheless, the results clearly show the differences in memory and time usage for the different model variants.
Modeling summary
The model variants for the different simulations tasks introduced in this section are listed in table I. For each task the table summarizes the relevant model mesh characteristics and the resulting number of unknowns in the model. It can be seen that a fine meshed model with large number of unknowns is only needed if the high frequency resistance of the full commutation path is of interest. In all other cases, models with significantly smaller number of unkowns are sufficient. III.
(a)
SIMULATIONS AND RESULTS
The measured computation effort quantities for the different task specific modeling techniques and meshing characteristics discussed are shown in table I. The numbers listed are for simulations performed on a desktop computer with an Intel i5 Dual-Core 2.5 GHz CPU and 8 GB RAM. It is important to remember that the PEEC solver used is applying a reluctance matrix sparsification algorithm [16] and a sparse direct solver [20]. The simulation time and memory therefore also depend on the achieved matrix sparsification, which depends on the actual model mesh characteristics and the simulation parameter settings. In above cases, the
(b) Figure 5. Current density distributions (a) and magnetic field vectors (b).
Using above simulation models, the actual bus bar design was analysed with the goal to further reduce the loop inductance between the two main terminals P and M, where the converter’s DC-link capacitors are connected. The circles in Fig. 5(a) point out the high current densities in the bus bars (not to be confounded with the high current densities at the IGBT module terminals), which indicate presence of high inductive regions. The field pattern shown in Fig. 5(b) confirms that there is in fact higher magnetic field strength next to the high current density region (close to terminal M). Fig. 6 shows the minor design changes applied based on the above analysis, with the requirement not to change the bus bar boundaries (IGBT modules and DC-link terminal locations, mounting holes, etc.). The resulting improved loop inductance is shown in Fig. 7. A reduction of about 27 nH or 15 % was achieved with just a few simulations using a rather coarse mesh, thus fulfilling the objective of this work.
IV.
CONCLUSION
In this paper, we have shown that with state-of-the-art electromagnetic simulators in combination with carefully prepared, task specific models, bus bar designs can be prepared in very efficient ways, compatible with real product development environments. To do so, it is first important to distinguish the different design tasks, and then to prepare simulation models specifically for these tasks. In most cases (i.e. analysis of stray inductances, magnetic field patterns and current density distributions), a coarse mesh is sufficient allowing for very fast simulations. In case of high frequency resistance analysis, however, a denser mesh is required thus slowing down the simulation time and increasing the memory need by about one order of magnitude. The method was verified by applying these simulations on a complex, planar, multi-layer bus bar as typically used in multi-level power converters. With few fast simulations only, the initial bus bar layout was modified and the critical commutation inductance reduced by about 15 %. V.
ACKNOWLEDGMENT
The authors would like to thank Danesh Daroui and Jonas Ekman from Technical University of Luleå, Sweden, for providing the PEEC solver. VI.
Figure 6. Design changes (circles) for lower stray inductance, applied after analysis of the simulation results.
320
J.-L. Schanen, E. Clavel, J. Roudet, “Modeling of low inductive busbar connections,” in IEEE Industry Applications Magazine, September/October 1996, pp. 39-43.
[2]
Y. Rong, Z. Zhengming, Z. Yulin, “Modeling of busbars in high power neutral point clamped three-level inverters,” in IEEE Tsinghua Science and Technology, vol. 13, issue 1, February 2008, pp. 91-97.
[3]
Z. Wang, G. Chen, “Study on planar busbar regarding stray inductance minimization and oscillation suppression for high power converters,” in Proc. International Conference on Sustainable Power Generation and Supply, 6.-7. April, 2009, pp. 1-7.
[4]
L. Yuan, H. Yu, X. Wang, Z. Zhao, “Design, simulation and analysis of the low stray inductance bus bar for voltage source inverters,“ in Proc. International Conference on Electrical Machines and Systems, ICEMS, 20.-23. August 2011, pp. 1-5.
[5]
A. Abrishamifar, R. Lourakzadegan, R. Esmaili, M. Arefian, “Design and construction of a bus bar for spike reduction in an industrial inverter,” in Proc. 1st Power Electronic and Drive Systems and Technologies conference, Teheran, Iran, 17.-18. February, 2010, pp. 13-17.
[6]
J.-M. Guichon, J. Aimé, J.L. Schanen, C. Martin, J. Roudet, E. Clavel, M. Arpillière, R. Pasterczyk, Y. Le Floch, “Busbar design: how to spare nanohenries?”, in Proc. 41st Industrial Application Conference, Tampa, USA, 8.-12. October, 2006, pp. 1865-1869.
[7]
F. Zare, G.F. Ledwich, “Reduced layer planar busbar for voltage source inverters,” in IEEE Transactions on Power Electronics, vol. 17, no. 4, July 2002, pp. 508-516.
[8]
J.-M. Guichon, E. Atienza, E. Clavel, J. Roudet, V. Mazauric, “Automatic design of busbars considering electrical criteria,” in Proc. IEEE Transmission and Distribution Conference and Exposition, Atlanta, USA, 28. October – 2. November, 2001, pp. 653-658.
Improved design
280 260
Inductance [nH]
[1]
Original design
300
240
LAC = 206 nH
220 200 180
LAC = 179 nH
160
ΔL = ~15 %
140 120 1.E+01
1.E+02
1.E+03 1.E+04 Frequency [Hz]
1.E+05
Figure 7. Original and reduced, simulated loop inductances.
REFERENCES
1.E+06
[9]
R.J. Pasterczyk, C. Martin, J.-M. Guichon, J.-L. Schanen, “Planar busbar optimization regarding current sharing and stray inductance minimization,” in Proc. European Conference on Power Electronics and Applications, Dresden, Germany, 2005, pp. 1-9
[10] M. Jones, A.W. Kelley, “Wideband circuit model for bus bar impedance,” in Proc. 15th IEEE Conference on Applied Power Electronics, APEC, New Orleans, USA, 6.-10. February, 2000, pp. 839-845. [11] M. Besacier, J.-L. Schanen, J. Roudet, P. Suau, J.C. Crébier, „PSpice – Compatible electrical equivalent circuit for busbars,“ in Proc. 15th IEEE Conference on Applied Power Electronics, APEC, New Orleans, USA, 6.-10. February, 2000, pp. 846-851. [12] M. Paakkinen, D. Cottet, “Simulation of the non-idealities in current sharing in parallel IGBT subsystems,” in Proc. IEEE Applied Power Electronics Conference and Exposition, Austin, TX, USA, Feb. 24-28, 2008, pp. 211–215. [13] I. Stevanović, D. Cottet, B. Wider, D. Daroui, and J. Ekman, “Modeling of large bus bars using PEEC method and circuit level simulators,” in Proc. 12th IEEE Control and Modeling for Power Electronics (COMPEL), Conference, Boulder, USA, 28-30 June, 2010, pp.1-7. [14] V. Ardon, J. Aime, O. Chadebec, E. Clavel, J.-M. Guichon, E. Vialardi, “EMC modeling of an industrial variable speed drive with an adapted PEEC method,” in IEEE Transactions on Magnetics, vol. 46, no. 8, August 2010, pp. 2892-2898. [15] A.E. Ruehli, “Equivalent circuit models for three dimensional multiconductor systems,” IEEE Transactions on Microwave Theory and Techniques, MTT-22(3), pp. 216-221, March 1974. [16] T.-H. Chen, C. Luk, H. Kim and C.C.-P. Chen, “Inductwise: Inductance-wise interconnect simulator and extractor. In Proc. of the IEEE Int. Conf. on Computer Aided Design, pp. 215-220, CA, USA, 2002. [17] A.E. Ruehli, G. Antonini, J. Esch, A. Mayo, J. Ekman, and A. Orlandi, “Non-orthogonal PEEC formulation for time and frequency domain EM and circuit modeling,” IEEE Transactions on Electromagnetic Compatibility, 45(2), pp. 167–176, May 2003. [18] D. Daroui, I. Stevanović, D. Cottet, and J. Ekman, “Bus bar simulations using the PEEC method,” in Int. Review of Progress in Applied Computational Electromagnetics (ACES2010), Tampere, Finland, Apr. 21-25, 2010. [19] R. Faraji-Dana, Y. Chow, “Edge condition of the field and a.c. resistance of a rectangular strip conductor,” in IEE Proceedings, vol. 137, no. 2, April 1990, pp. 133-140. [20] A. Gupta and Y. Muliadi, “An experimental comparison of some sparse direct solver packages. In Proc. of Parallel and Distributed Processing Symposium, CA, USA, 2001.