Key Words: Calcification, electron-beam computed tomography, coronary artery disease, natural history, arteriosclerosis. Revision submitted 9 July 1999, and ...
European Heart Journal (2000) 720–732 doi:10.1053/euhj.1999.1881, available online at http://www.idealibrary.com on
Review Electron-beam computed tomography for detection of early signs of coronary arteriosclerosis R. Erbel, A. Schmermund, S. Mo¨hlenkamp, S. Sack and D. Baumgart Department of Cardiology, Division of Internal Medicine, University Clinic Essen, Germany
Introduction Cardiovascular mortality is still the leading cause of death in the western world. Whereas a steady decline is observed in countries like the Netherlands, eastern European countries have experienced an increase[1]. Economic barriers to effective treatment alone are unlikely to explain the mortality changes observed, according to Sans et al.[12]. Most deaths from cardiovascular disease occur outside the hospital, and lead to a fatality rate of 40–60% in Europe[3]. Twenty years ago, in 1978 the inventor of coronary angiography F. N. Sones stated: ‘One third of the patients die due to complications of coronary artery disease, before the physicians know that the patient is ill’. The most important aim, he saw, was the identification of patients at risk[4]. Brown and Goldstein have described the major challenge for the future in cardiology: ‘The aim should be the development of a noninvasive method, for identification of coronary artery disease at its earliest stage’[5]. Based on the data of the World Health Organisation MONICA project, it has recently been pointed out that two thirds of the patients with acute myocardial infarction die within the first 28 days after the event. Only a strategy of primary risk reduction will substantially reduce cardiovascular mortality, as in-hospital treatment will only help a limited number of patients[3]. During the last decade new imaging modalities — transoesophageal echocardiography, magnetic resonance tomography, spiral computed tomography, electron beam computed tomography — have been introduced which have improved the diagnostic capabilities of the non-invasive imaging of coronary arteries. Key Words: Calcification, electron-beam computed tomography, coronary artery disease, natural history, arteriosclerosis. Revision submitted 9 July 1999, and accepted 22 July 1999. Correspondence: Raimund Erbel, MD, Professor of Internal Medicine and Cardiology, Department of Cardiology, Division of Internal Medicine, University Essen, Hufelandstr. 55, 45122 Essen, Germany. 0195-668X/00/090720+13 $35.00/0
Coronary imaging techniques are separated into direct and indirect imaging techniques. Indirect methods include selective coronary angiography, magnetic resonance angiography, contrast-enhanced electron beam tomography angiography, and synchrotron radiation angiography. All methods visualize the coronary artery lumen but not the diseased coronary artery vessel wall[6]. In the early stages of coronary arteriosclerosis, vessel size enlargement compensates for plaque formation up to 50% of its size, which has been called coronary artery remodelling[7]. Indirect methods are therefore not able to visualize early signs of coronary arteriosclerosis[8]. When the plaque area exceeds 45–50% of its final size indirect methods become positive[7,9,10]. Direct techniques are those visualizing non-calcified and calcified plaque formation within the coronary artery vessel wall. Intravascular ultrasound has become the gold standard for this approach[11]. Magnetic resonance imaging has not been used in a standardized and widely applicable fashion. Promising first results have been presented for visualization of lipid-rich plaques of peripheral arteries[12]. Electron beam computed tomography is currently the technique of choice for the assessment of calcified lesions, and is described below.
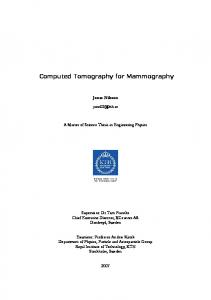
Electron beam computed tomography The design of the electron beam is what distinguishes electron beam computed tomography from other computed tomography technologies. As in other computed tomography scanners, the cathode is the source of the electron beam, which produces X-rays by striking a tungsten target, i.e. the anode. However, in electron beam computed tomography, the distance between the cathode and anode is approximately 3 m (Fig. 1). There are no mechanical moving parts. The electron beam is steered by an electromagnetic deflection system to sweep around the tungsten target. As opposed to moving the X-ray tube, the electron beam is moved before producing the X-ray beam. The tungsten target is centred below the patient. A stationary detector ring is centred above to measure the transmissions which have passed through � 2000 The European Society of Cardiology
Review
Data acquisition system
Magnetic focus and deflection coils Electron gun
721
Detectors
Electron beam
X-ray beams
Patient couch Vacuum drift tube X-ray collimators Target rings
Figure 1 Schematic drawing of the electron beam computed tomography scanner system. There are no moving mechanical parts. Electrons generated by the electron gun are accelerated up to nearly light velocity and electro-magnetically steered around the semicircular tungsten target rings, where X-ray beams are produced and directed through the patient. The fan-shaped X-rays are then taken up by detector rings located above the patient. The distance between cathode and anode (target rings) measures approximately 9 feet. For measurements of coronary calcification, only one of the four target rings is activated. (Modified from McCollough CH and Morin RL. The technical design and performance of ultrafast computed tomography. Radiol Clin N Am 1994; 32: 521–36.) the patient. Owing to further design features, heating problems are avoided, and a high scan frequency of up to 17/s is possible. The target rings are semicircular, forming a 210� arc below the patient. The detector system above the patient forms a 216� arc. This construction accounts for the non-symmetrical geometry of the electron beam computed tomography scanner, as opposed to the symmetrical design of conventional computed tomography. To allow uninhibited passage of the X-ray through the patient despite the overlap of target and detector rings, these are placed in slightly different planes. This configuration is called ‘cone beam geometry’. It yields an inferior image quality when compared to conventional computed tomography. However, the short scan acquisition times and the high scanning speed of electron beam computed tomography are unattained and appear crucial for cardiac imaging. The electron beam computed tomography scanner can be operated in various scanning modes. Up to 12 levels, covering approximately 12 cm, can be scanned in one series if all four target rings are employed (‘multi-slice mode’). However, the data and images discussed in the following sections are based on a mode employing only one target ring as X-ray source. It is called the ‘singleslice mode’, offers the best available spatial resolution, and is preferred for coronary artery imaging. Scan acquisition time measures 100 ms, and slice thickness usually 3 mm. The in-plane resolution of the images varies according to the field of view. Pixel size ranges from 0·35�0·35 mm to about 0·60�0·60 mm. The examination for analysis of coronary calcification is performed using contiguous slices 3 mm thick.
Patients are supine, and after localization of the main pulmonary artery, 32–40 slices caudad through the apex of the heart are obtained with electrocardiographic triggering at 80% of the RR interval. The presence of coronary calcification is evaluated at all levels. Total examination time is 3–4 min. In addition, 15–20 min for evaluation of calcification and calculation of the Agatston score[13] is needed as explained below. The grey-scale values contained in each pixel are defined with reference to the value for water and are called Hounsfield units (HU). Air attenuates the X-ray less than water, and bone attenuates it more than water, so that in a given patient, Hounsfield units may range from �1000 (air) through 0 (water) to approximately +1000 bone (bone cortex). The threshold for calcified lesions is usually set at a computed tomography density of 130 HU, because this value has been shown to provide sufficient differentiation from the surrounding tissue and blood[13]. To be defined as calcification, the hyperattenuating focus of >130 HU needs to comprise an area of at least two adjacent pixels (i.e. 0·52 mm2 with a 5122 pixel matrix and 26 cm field of view).
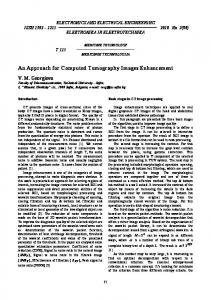
Electron beam tomography imaging Calcification within a plaque formation is visualized as a high density lesion (Fig. 2). The threshold of 130 HU has been widely accepted as signifying calcification[13–16]. In order to quantify the extent of calcification, the maximum computed tomography density of each lesion is determined and classified in four categories according to Agatston et al.[13]: 1=130–199 HU; 2=200–299 HU; 3=300–399 HU; 4=d400 HU. Eur Heart J, Vol. 21, issue 9, May 2000
722
R. Erbel et al.
Figure 2 Demonstration of the normal electron beam computed tomogram visualizing the left main artery and the left anterior descending coronary artery without any signs of increased density (left panel). Positive electron beam computed tomogram (right panel) with extensive calcification of the left anterior descending coronary artery and diagonal branches.
Figure 3 Calculation of the Agatston score. Calcification is defined by a hyperattenuating lesion of at least 2–4 adjacent pixels with a computed tomography density >130 HU. The Agatston score takes into account the area of this lesion and the maximum computed tomography density. An attenuation number is used as in the following: 1=130–199; 2=200–299; 3=300–399; 4= >400 HU. For each lesion, the area is multiplied by the attenuation factor to generate the score. In the example, the attenuation number of 3 is multiplied with the area of 8 mm2 yielding an Agatston score of 24. This ‘density factor’ is multiplied with the area of the hyperattenuating lesion exceeding 130 HU[13]. The example in Fig. 3 shows that a single lesion with a computed tomography density of 313 HU occupying an area of 8 mm2 yields a score of 24 according to Agatston et al. Calcifications can be analysed for separate coronary segments (e.g. according to the classification of the American Heart Association) and summed up for Eur Heart J, Vol. 21, issue 9, May 2000
each artery to yield a total score[17]. In a histopathological comparative study, the Agatston scoring system has been established as an accurate measure of coronary mural calcification[14]. Recently, it has been shown that the analysis of the volume of lesions exceeding 130 HU yields better reproducibility than the Agatston score[18–20]. This is related to the simplified categorization of computed tomography density values in the Agatston score, which results in vastly different scores for lesions with a maximum density of 299 or 301 HU. Electron beam computed tomography enables the physician to detect, localize and quantify the extent of calcification in the coronary artery tree. Even lesions in the distal segment of the right and left coronary artery can be visualized (Fig. 4). Inter-scan variability (reproducibility) may depend on breathing and diaphragmatic motion artefacts, improper ECG gating, imaging artefacts, and the size and localization of calcification in the arterial tree. The median variability between scans showing intermediate and high quantities of calcification is only about 10%[18,19]. This has been achieved by the introduction of a new, volumetric analysis algorithm for optimized precision, but also simply by considering the area of calcification rather than the computed tomography density weighting factor[19,20]. Imaging artefacts increase with a decreased densityto-noise ratio and are frequently observed at the diaphragmatic surface of the heart in the trajectory of the distal right coronary artery. In the more proximal segments of the right coronary artery, characteristic streaking artefacts caused by motion blurring are seen in some cases. Experienced observers can clearly separate hyperattenuating foci in the trajectory of the arteries from extracoronary calcifications or artefacts. If small artefacts are found in the trajectory of the arteries themselves, they cannot generally be identified as such and are regarded as calcification. If the aim is to enhance
Review
723
Figure 4 Visualization of coronary calcification in the proximal mid and distal part of the right coronary artery up to the posterior descending coronary artery. The inferior wall of the heart lies adjacent to the diaphragm. reproducibility, one can consider only foci of a certain size, unlikely to represent an artefact, usually d8 mm2. Regardless of the protocol chosen, it is of utmost importance to be consistent. Standardization and the possibility for others to reproduce and test the algorithm are primary objectives for each scoring method.
Pathological–anatomical correlations The development of coronary arteriosclerosis is divided into five stages according to Stary et al.[21]. Although intermediate Type III lesions can contain calcification, the latter is more prominent in plaque formation of Type IV (atheroma) and Type V (fibroatheroma)[22]. Electron beam computed tomography is able to detect these early plaque formations as studies correlating electron beam computed tomography and pathology have shown[14,23–25]. By subdividing the coronary artery tree into the left main, left descending, left circumflex, and right coronary artery, the number of lesions which were calcified correlated highly when analysed by histomorphology or electron beam computed tomography[14]. Calcification is a specific sign of coronary arteriosclerosis according to Blankenhorn[26]. In addition the amount of calcification is directly and linearly correlated to the total burden of plaque formation[24].
Comparison between electron beam computed tomography and intravascular ultrasound In order to validate the accuracy of electron beam computed tomography, a comparison with the gold standard for detection of calcified and non-calcified lesions with intracoronary ultrasound was performed[15]. It could be demonstrated, that even single lesions in patients with normal coronary angiograms which were detected by intracoronary ultrasound, could be visualized by electron beam computed tomography (Fig. 5). However, with intravascular ultrasound, only those
lesions located within the segment studied by this catheter-based method could be visualized. Calcifications in side branches and distal lesions, which were not reached by the catheter, were not detected. Meanwhile these results have been confirmed by others[27]. Thus, electron beam computed tomography can be regarded as a very accurate method for the detection of coronary calcification. It is superior to intravascular ultrasound, as it is not limited to segments of the coronary artery tree reached by the catheter.
Comparison between coronary angiography and electron beam computed tomography A number of studies have been published concerning the diagnostic accuracy of electron beam computed tomography in comparison to coronary angiography for the detection of significant coronary artery disease, i.e. luminal narrowing of more than 50% diameter stenosis. Values for sensitivity of 85–100% and for specificity of 45–66% were demonstrated[28–31], which did not meet the initial hopeful expectations. It has to be taken into account that a close correlation cannot be expected, because electron beam computed tomography images the coronary artery wall, whereas coronary artery angiography visualizes the arterial lumen: a cross-sectional imaging technique is being compared with a contour method. Coronary plaques do not necessarily produce luminal narrowing. The relationship between coronary plaque formation and luminal narrowing is determined in part by arterial remodelling, which often compensates for increasing plaque burdens[7]. It must be kept in mind that angiography and electron beam computed tomography evaluate two facets of atherosclerotic plaque disease, i.e. luminal narrowing and the calcified plaque itself. But, due to the detection of even small coronary lesions, the negative predictive value of electron beam computed tomography ranges between 70–100%[31]. Accordingly, a negative electron beam Eur Heart J, Vol. 21, issue 9, May 2000
724
R. Erbel et al.
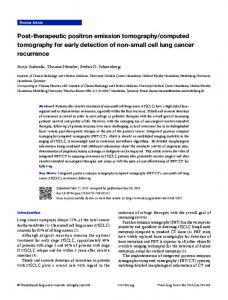
Figure 5 Comparison of coronary angiography, electron beam computed tomography and intravascular ultrasound in a patient with a normal angiogram but demonstration of atherosclerotic lesions by intravascular ultrasound. In the proximal left anterior descending coronary artery, electron beam computed tomography detects a calcified lesion also shown by intravascular ultrasound, whereas a non-calcified lesion further distally is only detected by intravascular ultrasound. computed tomography suggests a low likelihood of a high grade coronary stenoses. In an attempt to predict the presence of coronary stenoses more precisely, Rumberger et al.[32] calculated the Agatston scores that yielded a 90% specificity for variable degrees of angiographic luminal disease (Fig. 6). For example, a score exceeding 27 gave a 90% specificity for at least a 20% or greater coronary stenosis, whereas a score exceeding 371 gave a 90% specificity for at least a 70% or greater coronary stenosis. The same calculations were also done to obtain 95% specificities. In essence, this approach would allow the threshold of coronary calcification to be adjusted to be regarded as ‘significant’ in the clinical scenario. A low threshold would ascertain that almost all patients with significant coronary artery disease are identified. If it were desirable to avoid false–positive results, a higher threshold would demonstrate a better specificity.
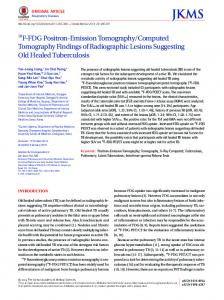
Natural history of coronary arteriosclerosis Pathological anatomical studies have demonstrated that coronary lesion formation starts in the first 2 cm of the left and the proximal right coronary arteries[25,33–35]. Analysis of the distribution of calcification in patients with normal or nearly normal coronary angiograms demonstrated that this pattern can also be found by electron beam computed tomography (Fig. 7). The highest number of calcified lesions is found in the proximal left anterior descending coronary artery, and to a lesser degree, in the proximal right and left circumflex coronary arteries. Calcification in the mid segments of the left anterior descending coronary artery, the left Eur Heart J, Vol. 21, issue 9, May 2000
circumflex artery and in the left main artery are less frequent and indicate more advanced stages of the disease[36]. Patients with suspected coronary artery disease but normal coronary angiograms usually show an electron beam computed tomography score in the range of 0–100. As the disease extends, the Agatston score increases in patients with three-vessel disease and main stem stenoses, reaching 400 and more[36]. But scores up to 4000 have been found in coronary artery disease with long-term hypertension and diabetes mellitus, and up to 9000 in patients with renal failure on dialysis.
Ageing During life, variable amounts of coronary artery calcification develop. In an electron beam computed tomography study of young subjects with a mean age of 33 years, Mahoney et al. found a prevalence of calcification in 31% of males and 10% of females[37]. These findings support the fluoroscopy studies of Loecker et al.[38] and the above mentioned pathological–anatomical studies of Stary et al.[21], who showed that coronary calcification starts early. Already at this young age the difference in the development of coronary artery disease between male and female exists. The percentage of patients with calcification is increasing after age 30–40 years[39] (Table 2). Positive electron beam computed tomograms were found in 18% aged between 30 and 33 and in 79% between 60 and 70 years. Using this information, normograms have been developed for men and women[39,40], which can be used to classify the electron beam computed tomogram of an individual patient (Table 3).
Review
725
1·0
0·9
Sensitivity (Se) or Specificity (Sp)
0·8
0·7
0·6
Optimal score = 58
0
20
40
60
80
100
120
140
160
1·0
0·9
0·8
0·7
0·6
Optimal score = 123
0
20
40
60 80 100 120 EBCT Coronary calcium score
140
160
Figure 6 Use of the electron beam computed tomography-derived Agatston score to predict the probability of angiographically proved obstructive disease. Depending on the threshold chosen, the specificity for the likely severity of coronary stenoses varies. For example, a score exceeding 27 gave a 90% specificity for at least a 20% or greater coronary stenosis, whereas a score exceeding 371 gave a 90% specificity for at least a 70% or greater coronary stenosis. Thus, one might adjust the threshold of coronary calcification regarded as ‘significant’ according to the clinical scenario. A low threshold would ascertain that almost all patients with significant coronary artery disease are identified. If it were desirable to avoid false positive results, a higher threshold would demonstrate a better specificity. (Modified from Rumberger et al.[32].) =sensitivity for _40% stenosis; =specificity for _40% stenosis; =sensitivity for _70% stenosis; =specificity for _70% stenosis.
Determinants of coronary calcification It is well established, that non-modifiable and modifiable risk factors are responsible for the development of coronary arteriosclerosis, including age, sex, family history as well as high levels of cholesterol, smoking, hypertension, diabetes mellitus and other factors[41–45]. In the study by Mahoney et al., body mass index, systolic blood pressure and decreased high-density lipoprotein (HDL) were the most powerful predictors of calcification of the coronary arteries detected by electron beam computed tomography[37]. In a multivariate regression analysis in a group of patients studied at our institution, the strongest association between risk factors and calcification was seen for age, sex, the ratio of total
cholesterol to HDL cholesterol, and fibrinogen, whereas the correlations for low-density lipoprotein (LDL) cholesterol, lipoprotein(a), apolipoprotein A1, B, diabetes mellitus, and family history as well as body mass index were not significant[46]. With an increasing number of risk factors, the electron beam computed tomography score increases. In this respect, electron beam computed tomography appears to measure the effect of cardiovascular risk factors on coronary arteriosclerosis in a fashion very comparable with the standard method for assessment of coronary anatomy, selective coronary angiography (Fig. 8)[46]. Further prospective studies are necessary to establish risk factors which underlie the development of coronary calcification and arteriosclerosis in an unselected, general population. Eur Heart J, Vol. 21, issue 9, May 2000
Presence of calcification (%)
726
R. Erbel et al.
80
RCA
50
pr. mid dst. 38 30 30
LM
33
LAD pr. mid dst. 60
pr. mid dst. 40
38
9 0
LCX
14 0
Figure 7 Distribution of coronary artery calcification in patients with early signs of arteriosclerosis and normal coronary angiograms. Most calcifications are found in segment 6 of the proximal left anterior descending coronary artery, whereas lesions appear less frequently in the proximal right and left circumflex coronary artery and the mid part of the left anterior descending coronary artery as well as the left main coronary artery. RCA=right coronary artery; LM=left main artery; LAD=left anterior descending coronary artery; LCX=left coronary circumflex artery; pr.=proximal; mid=mid; dst=distal.
of cardiac risk. Receiver operating characteristic (ROC) curve analysis has demonstrated an area under the curve of 0·91 for an Agatston score of more than 160 compared to 0·77 for the traditional risk factor assessment according to the National Cholesterol Education Program (NCEP)[49]. These studies have been criticized, because they are clearly not conducted in an unbiased cohort of asymptomatic participants. It is possible that some symptomatic persons were included, and the effect of self-referral of participants must also be considered. Conversely, it is also possible that the demonstration of calcification by electron beam computed tomography induced lifestyle changes in many patients and accordingly may have influenced outcomes[51,52]. Therefore, further unbiased prospective studies have to be undertaken in order to assess the true predictive value of electron beam computed tomography. Nevertheless, the currently available data already indicate that the prognostic judgement of the physician can be improved by electron beam computed tomography.
Acute coronary syndromes Prognostic value of coronary calcification detected by electron beam computed tomography Meanwhile three major studies have been published which have assessed the prognostic value of electron beam computed tomography[47–50]. In a multicentre cooperative study, more than 400 symptomatic patients were followed for up to 4 years with regard to the end-points death and myocardial infarction and the results compared to coronary angiography[47]. An Agatston score of more than 100 was found to be highly predictive of a poor prognosis compared to an Agatston score below 100. These results were very comparable to coronary angiography, showing a coronary luminal narrowing of 50% diameter stenosis as a separation point[47]. Secci et al. followed asymptomatic elderly subjects. Electron beam computed tomography predicted the combined end-point of death, myocardial infarction, and revascularization with an odds ratio around 3[48]. It was not as predictive as expected for ‘hard events’ alone, probably because patients already at higher risk had been selected. Arad et al. in their study of 1193 patients with a mean follow-up of 1·5 years, demonstrated that an Agatston score of more than 100 yielded an odds ratio of more than 25, and an Agatston score of more than 160 an odds ratio of more than 34 for the prediction of death, non-fatal myocardial infarction, and revascularization[49]. The study was further extended, and recently the 3·5 year follow-up data were presented[50]. It could be demonstrated that for death and non-fatal myocardial infarction, a 24-fold increased risk was present when the Agatston score exceeded 100. On the other hand, a negative Agatston score predicted an excellent prognosis. Most important is the comparison with other risk factors for the traditional assessment Eur Heart J, Vol. 21, issue 9, May 2000
Acute coronary syndromes include patients with unstable angina, acute myocardial infarction, and sudden coronary death. Differences in opinion exist as to whether or not calcification is associated with vulnerable and ruptured plaques, is a sign of stable or unstable lesions, and/or predicts the presence of plaque rupture[53–57]. Intravascular ultrasound studies have shown that in the neighbourhood of ruptured plaques, which are leading to myocardial infarction, calcification is found in 80% of the patients[58]. In the presence of calcification, high wall stress can lead to rupture, as intravascular ultrasound studies after PTCA have shown[59]. We have evaluated the electron beam computed tomography in 118 patients with acute coronary syndromes[60]. In 110 patients, angiographically moderate or severe coronary artery disease was present, and calcifications were found in 96% of these patients. In eight patients, only minimal arteriosclerotic disease was found, and the electron beam computed tomogram was positive in only one patient. Intravascular ultrasound demonstrated isolated plaque formation with rupture, coronary thrombosis based on fatty streaks, and nonarteriosclerotic mechanisms such as myocardial bridging and spasm as the cause of the acute event[60]. While overall accuracy of electron beam computed tomography was still more than 90% in this study, it should be kept in mind that extensive coronary plaque formation leads to acute coronary syndromes. Accordingly, even though a referral hospital population was examined in the above named investigation, the detection of calcification by electron beam computed tomography can generally be expected in most patients with acute coronary syndromes. Because plaque rupture can occur in very early stages of plaque formation, starting with Type II according to Stary et al.[21], and because alternative mechanisms are possible in rare cases, not all imaging
Review
727
1·0 Area = 0·83 ± 0·03
0·9
0·8
0·7
Sensitivity
0·6
Area = 0·81 ± 0·03
0·5
0·4
0·3
0·2
0·1
0·0
0·1
0·2
0·3
0·4 0·5 0·6 1 – Specificity
0·7
0·8
0·9
1·0
Figure 8 Receiver operating characteristic (ROC) curve analysis comparing the overall risk score to coronary angiography (i.e. no or non-obstructive disease vs significant angiographic disease, ) and calcium score quintiles (i.e. the lower 2 quintiles vs the upper 3 quintiles, ). The overall risk score was derived by weighting a number of cardiovascular risk factors according to their value for predicting anatomic coronary artery disease and computing a score representing the overall risk represented by these factors. The sensitivity of the risk score with reference to coronary angiography or calcium score was plotted as a function of (1-specificity) (equivalent to the ‘false positive rate’) in order to determine individual (x,y) pairs with different risk scores. The areas under the curve for coronary angiography and calcium score were calculated as mean�SE. An area under the curve of 0·5 would represent a random distribution, whereas a value of 1 would indicate perfect discrimination. Overall risk was equally well detected by angiography and electron beam computed tomography. (Modified from Schmermund et al.[46].) techniques will always be able to visualize the underlying pathology of acute coronary syndromes. It is still a matter of debate whether patients with acute coronary syndromes can be separated from patients with no or atypical symptoms on the basis of the electron beam computed tomography-derived Agatston score. Prospective trials in unselected patients are underway to determine more precisely the clinical usefulness of predicting acute coronary syndromes by electron beam computed tomography.
Progression and regression of coronary arteriosclerosis As the method is non-invasive, very patient friendly follow-up studies can easily be performed. Two studies
have demonstrated that the progression of calcification is more prominent in symptomatic than asymptomatic patients[61,62]. Baseline scores in patients without symptoms were lower than in patients with symptoms. Taking this difference into account, a nearly linear progression of calcification has been observed, with an increase in the Agatston score of about 14–25%/year in asymptomatic and 30–50% in symptomatic patients[61,62]. These changes are well beyond the variability of the test itself in symptomatic patients, whereas for the asymptomatic group, longer time intervals may need to be observed. The progression of calcification in unselected, healthy adults in the general population appears to be in the order of 24%[63]. As the method is non-invasive, it might provide an ideal tool for follow-up studies investigating the effect of various medications on the progression of Eur Heart J, Vol. 21, issue 9, May 2000
728
R. Erbel et al.
coronary arteriosclerotic disease. A first study has recently been published by Callister et al.[18]. The authors found an association between the progression of calcified lesions and LDL cholesterol values achieved by drug treatment. A cut point seemed to be at an LDLcholesterol level of 120 mg . dl �1. Another application might be that for the first time, the physician might have a diagnostic tool to demonstrate the ageing of the patients using a non-invasive and easily useable technique[64,65]. We have pointed out that calcification may indeed represent the biological age of the coronary arteries[64]. In a recent editorial, Grundy has extended this concept by suggesting that calcification might be used instead of age in risk assessment algorithms[65]. Non-invasive tracking of the progression and regression of coronary disease by analysing coronary calcification appears to be possible. Further standardization is necessary in order to decrease the inter-scan variability and also to allow inter-institutional comparison of the tests.
Recommendations for electron beam computed tomography scanning Based on the current knowledge, the American Heart Association/American College of Cardiology Committee[66] has made the following statements: A positive electron beam computed tomogram This can be regarded as indicating the presence of coronary arteriosclerosis and an increased risk of future cardiac events in the presence of a high Agatston score. A negative electron beam computed tomogram This is usually found in patients with a normal coronary angiogram and is combined with a good prognosis for the next 3–5 years. Arteriosclerosis is unlikely. Indications for electron beam computed tomography In the work-up of patients with chest pain, particularly atypical chest pain but non-conclusive diagnostic tests, a positive electron beam computed tomogram can confirm the presence of coronary artery disease. The screening of asymptomatic patients is discouraged, as not enough data are available in order to advise the physician how to interpret the electron beam computed tomography results. Follow-up studies of patients by electron beam computed tomography outside of controlled clinical trials are not advised at the moment, as insufficient data are available.
Interpretation of electron beam computed tomography scans For the interpretation of scan results, it is particularly important to consider the high negative predictive value Eur Heart J, Vol. 21, issue 9, May 2000
of the test[67]. A negative scan is consistent with no or at most minimal atherosclerosis. Owing to the linear relationship between the extent of coronary atherosclerosis and the amount of coronary calcification, multivessel disease is hardly ever seen in the presence of a negative scan[31]. On the other hand, calcium scores exceeding 80–100 are highly consistent with at least nonobstructive coronary disease. The presence of moderate, although non-obstructive coronary disease can engender an adverse, long-term prognosis[68,69]. Thus, the presence of moderate calcium scores in an otherwise asymptomatic individual suggests that further evaluations, including careful identification and aggressive treatment of modifiable risk factors, may be prudent[67]. Individuals with calcium scores >400–500 have advanced plaque disease and a high likelihood of obstructive coronary lesions. Besides strict measures regarding modifiable risk factors, they should probably be considered for further evaluations directed to determining the potential for ischaemia. It cannot be overemphasized, however, that these thresholds apply to a population with intermediate likelihood of coronary artery disease and aged approximately 45–65 years. In younger individuals, and in particular in females, lower threshold values need to be considered. In older individuals, even relatively high calcium scores may be acceptable. This must be determined by a knowledgeable physician on the basis of all the available clinical information. It is very helpful to consult normograms such as provided by Callister et al. (Table 3)[40], because this allows for stratification of calcium scores according to percentile values. Generally, scores in the upper 25%, and especially in the upper 10%, are considered clinically significant[67]. Unfortunately, normograms in an unselected, strictly asymptomatic population have not been published to date.
Alternative methods for assessing coronary calcification Conventional and spiral (helical) computed tomography are more widely available than electron beam computed tomography but have until recently not received much interest regarding the assessment of coronary artery calcification. In an early report, 47 patients (mean age 57 years) were examined by fluoroscopy and conventional computed tomography, with conventional computed tomography visualizing calcifications in 62% of the coronary arteries with angiographically obstructive lesions and fluoroscopy in only 53%[70]. Another investigation of conventional computed tomography found a sensitivity of 65% and a specificity of 97% for the detection of angiographically obstructive lesions in the major coronary arteries of 108 patients[71]. Because spiral computed tomography allows for sub-second scan acquisition times, it offers theoretical advantages over conventional computed tomography. Indeed, a recent preliminary report in 51 males (mean age 61 years) has suggested that at least for moderate to extensive
Review
729
Table 1 Comparison of electron beam computed tomography (EBCT) and histological sections of the major coronary arteries. The percentage of sections with calcification either on electron beam computed tomography or histology are shown and the correlation coefficient between Agatston calcium scores and histomorphometric areas of calcification. (Table on the basis of data from Mautner GC, Mautner SL, Froehlich J, Feuerstein IM, Proschan MA, Roberts WC, Doppman JL (1994) Coronary artery calcification: assessment with electron beam CT and histomorphometric correlation. Radiology 192: 619–623)
Total number of sections Calcified EBCT Histomorphometry Correlation coefficient (r)
Table 2
Left main coronary artery
Left anterior descending coronary artery
Left circumflex coronary artery
Right coronary artery
119
1647
921
1611
39 (33%) 39 (33%) 0·91
340 (21%) 344 (21%) 0·95
226 (25%) 203 (22%) 0·94
395 (25%) 394 (24%) 0·95
Age- and sex distribution of Agatston calcium scores in an asymptomatic population (Janowitz et al. 1993)[39] Asymptomatic males
Asymptomatic females
Age (years)
Number
Prevalence of coronary calcification
Mean Agatston calcium score
Age (years)
Number
Prevalence of coronary calcification
Mean Agatston calcium score
0–29 30–39 40–49 50–59 60–69 70–79 80–89
73 283 534 312 65 32 5
11% 21% 44% 72% 85% 94% 100%
0·5�0·35 8�2·1 28�4·5 140�18·3 239�46 425�74·6 468�161·9
0–29 30–39 40–49 50–59 60–69 70–79 80–89
17 63 124 117 56 45 4
6% 11% 23% 35% 67% 89% 100%
0·06�0·05 2�1·3 11�4·1 63�45·0 122�36·6 243�49·5 249�68
Table 3 The normal distribution of Agatston calcium scores in a cohort of patients referred by primary care physicians for an electron beam computed tomography scan as reported by Callister et al.[40]. The percentile allocation provides important information regarding the significance of individual scores and should be used in addition to the absolute score value Percentile Men 25th 50th 75th 90th Women 25th 50th 75th 90th
35–39
40–44
45–49
50–54
55–59
60–64
65–69
70+
0 0 4 22
0 0 11 51
0 5 46 160
0 18 125 350
6 46 204 457
35 152 416 989
33 103 616 1100
60 247 616 1452
0 0 1 7
0 0 0 6
0 0 2 16
0 0 12 78
0 0 22 128
0 3 102 248
0 15 101 327
10 103 375 876
amounts of coronary artery calcification, non-gated spiral computed tomography yields very similar information compared with the gold standard, electron beam computed tomography[72]. Double-helix computed tomography with scan acquisition times in the order of 500 ms has been shown to have a high sensitivity (91%) for the detection of angiographically obstructive lesions[73], and has been evaluated in a number of clinical
settings for the assessment of suspected coronary artery disease[74,75]. Very recently, prototypes of multi-row spiral computed tomography scanners have become available which allow for scan acquisition times of approximately 250 ms. It is conceivable that these machines will in the future be widely used for cardiac applications. However, currently the speed of electron beam computed tomography is still unattained, and, Eur Heart J, Vol. 21, issue 9, May 2000
730
R. Erbel et al.
more importantly, the new techniques have not been validated as thoroughly as electron beam computed tomography.
Clinical implications The non-invasive, direct visualization of coronary arteriosclerosis by electron beam computed tomography can be used in patients with risk factors at a young age to detect coronary arteriosclerotic disease in a preclinical stage. Thus, primary prevention can be changed into secondary prevention in the presence of calcification. Electron beam computed tomography represents a new method for analysing the natural history of coronary artery disease. In symptomatic patients, the extent of the disease as well as the degree of coronary artery luminal narrowing can be estimated. In addition to risk factor assessment, the analysis of electron beam computed tomography is helpful for estimating the individual risk of a patient. Electron beam computed tomography is a new method for use in clinical pharmacological studies. Death, non-fatal myocardial infarction, revascularization, calcification and the progression of calcification can be used as new end-points. Before these aspects can be accepted for assessment, further large prospective unbiased studies need to be performed.
References [1] Fox R. Trends in cardiovascular mortality in Europe. Circulation 1997; 96 3817–21. [2] Sans S, Kesteloot H, Kromhout D. The burden of cardiovascular diseases mortality in Europe. Task Force of the European Society of Cardiology on Cardiovascular Mortality and Morbidity. Statistics in Europe. Eur Heart J 1997; 18 1231–48. [3] Chambless L, Keil U, Dobson A et al. Population versus clinical view of case fatality from acute coronary heart disease — results from the WHO Monica project 1985–1990. Circulation 1997; 96 3849–59. [4] Sones FM Jr. The society for cardiac angiography. Cathet Cardiovasc Diagn 1978; 4 233–4. [5] Brown MS, Goldstein JL. 1985 nobel laureates in medicine. J Investig Med 1996; 44 14–23. [6] Schmermund A, Baumgart D, Go¨ rge G, Seibel R, Gro¨ nemeyer D, Erbel R. Non-invasive visualization of coronary arteries with and without calcification by electron beam computed tomography. Herz 1996; 21 118–26. [7] Glagov S, Weisenberg E, Zarins CK, Stankunavicius R, Kolettis GJ. Compensatory enlargement of human coronary arteries. N Engl J Med 1987; 316 1371–5. [8] Deverex R, Aldermann M. Role of preclinical cardiovascular disease in the evolution from risk factor exposure to development of morbid events. Circulation 1993; 88 1444–55. [9] Ge J, Erbel R, Gerber T, Go¨ rge G, Koch L, Haude M, Meyer J. Intravascular ultrasound imaging of angiographically normal coronary arteries: a prospective study in vivo. Br Heart J 1994; 71 572–8. [10] Gerber TC, Erbel R, Go¨ rge G, Ge J, Rupprecht HJ, Meyer J. Extent of atherosclerosis and remodeling of the left main coronary artery determined intravascular ultrasound. Am J Cardiol 1994; 73 666–71. [11] Erbel R, Go¨ rge G, Kearny P et al. Intravaskula¨ re Sonographie bei koronarer Herzkrankheit. Dtsch med Wschr 1995; 120: 847–54. Eur Heart J, Vol. 21, issue 9, May 2000
[12] Toussant JF, LaMuraglia GM, Southern JF, Fuster V, Kantor HL. Magnetic resonance images lipid, fibrous, calcified, hemorrhagic and thrombotic components of human atherosclerosis in vivo. Circulation 1996; 94: 932–8. [13] Agatston AS, Janowitz WR, Hildner FJ, Zusmer NR, Viamonte M Jr, Detrano R. Quantification of coronary artery calcium using ultrafast computed tomography. J Am Coll Cardiol 1990; 15: 827–32. [14] Mautner SL, Mautner GC, Fro¨ hlich J, Feuerstein IM, Proschan MA, Roberts WC. Coronary artery disease: prediction with in vitro EBCT. Radiology 1994; 192: 625–30. [15] Baumgart D, Schmermund A, Go¨ rge G et al. Comparison of electron beam computed tomography with intracoronary ultrasound and coronary angiography for the detection of coronary atherosclerosis. J Am Coll Cardiol 1997; 30: 57–64. [16] Erbel R, Schmermund A, Baumgart D et al. Elektronenstrahltomographie: nicht-invasive Diagnostik der koronaren Atherosklerose. Dt A } rztebl 1998; 95: A-1092–A-1098. [17] Schmermund A, Baumgart D, Adamzik M et al. Comparison of electron-beam computed tomography and intracoronary ultrasound in detecting calcified and non-calcified plaques in patients with acute coronary syndromes and no or minimal to moderate angiographic coronary artery disease. Am J Cardiol 1998; 81: 141–6. [18] Callister TQ, Raggi P, Cooil B, Lippolis NJ, Russo DJ. Effect of HMG-CoA reductase inhibitors on coronary artery disease as assessed by electron-beam computed tomography. N Engl J Med 1998; 339: 1972–8. [19] Callister TQ, Cooil B, Raya SP, Lippolis NJ, Russo DJ, Raggi P. Coronary artery disease: improved reproducibility of calcium screening with an electron beam CT volumetric method. Radiology 1998; 208: 807–14. [20] Mo¨ hlenkamp S, Kriener P, Baumgart D, Lange S, Gro¨ nemeyer D, Erbel R. Reproducibility of coronary calcium measurements by electron beam CT as a prerequisite to study the natural course of coronary atherosclerosis (Abstr). Eur Heart J 1998; 19 (Abstr Suppl): 370. [21] Stary HC, Chandler AB, Dinsmore RE et al. A definition of advanced types of atherosclerotic lesions and a histological classification of atherosclerosis: a report from the committee on vascular lesions of the council on atherosclerosis, American Heart Association. Circulation 1995; 92: 1355–74. [22] Stary HC. The sequence of cell and matrix changes in atherosclerotic lesions of coronary arteries in the first forty years of life. Eur Heart J 1990; 11 (Suppl E): 3–19. [23] Sangiorgi G, Rumberger J, Severson A et al. Arterial calcification and not lumen stenosis is correlated with atherosclerotic plaque burden in humans: a histologic study of 723 coronary artery segments using non-decalcifying methodology. J Am Coll Cardiol 1998; 31: 126–33. [24] Rumberger JA, Simons DB, Fitzpatrick LA, Sheedy PF, Schwartz RS. Coronary artery area by electron beam computed tomography and coronary atherosclerotic plaque area. A histopathologic correlative study. Circulation 1995; 92: 2157–62. [25] Mautner GC, Mautner SL, Fro¨ hlich J et al. Coronary artery calcification: assessment with electron beam CT and histomorphometric correlation. Radiology 1994; 192: 619–23. [26] Blankenhorn DH. Coronary arterial calcification: a review. Am J Med Sci 1961; 242: 41–9. [27] Wortmann AK, Leber AW, Achenbach S, Moshage W, Daniel WG. Comparative study of intracoronary ultrasound and electron beam computed tomography on the detection of coronary calcified and non-calcified lesions (Abstr). Eur Heart J 1998; 19 (Abstr Suppl): 126. [28] Tanenbaum SR, Kondos GT, Veselik KE, Prendergast MR, Brundage BH, Chomka EV. Detection of calcific deposits in coronary arteries by ultrafast computed tomography and correlation with angiography. Am J Cardiol 1989; 63: 870– 972.
Review
[29] Rumberger JA, Sheedy PF, Breen JR, Schwartz RS. Coronary calcium, as determined by electron beam computed tomography, and coronary disease on arteriogram: effect of patient’s sex on diagnosis. Circulation 1995; 91: 1363–7. [30] Kaufmann RB, Moll PP, Sheedy PF, Rumberger JA, Schwartz RS. Quantification of coronary artery calcium by electron beam computed tomography for determination of angiographic coronary artery disease in younger individuals. J Am Coll Cardiol 1995; 25: 623–32. [31] Budoff MJ, Georgou D, Brody A et al. Ultrafast computed tomography as a diagnostic modality in the detection of coronary artery disease. A multicenter study. Circulation 1996; 93: 898–904. [32] Rumberger JA, Sheedy PF, Breen JF, Schwartz RS. Electron beam computed tomography calcium score cutpoints and severity of associated angiographic lumen stenosis. J Am Coll Cardiol 1997; 29: 1542–8. [33] Montenegro MR, Eggen DA. Topography of atherosclerosis in the coronary arteries. Lab Invest 1968; 18: 586–93. [34] Nauth HF, Hort W, Hubinger R. Untersuchungen u¨ ber die Lokalisation sklerotischer Vera¨ nderungen in den Koronararterien und ihren großen epikardialen A } sten. Z Kardiol 1979; 68: 832–8. [35] Fox B, James K, Morgan B, Seed A. Distribution of fatty and fibrous plaques in young human coronary arteries. Atherosclerosis 1982; 41: 337–47. [36] Schmermund A, Bailey KR, Rumberger JA, Reed JE, Sheedy PF II, Schwartz RS. An algorithm for non-invasive identification of angiographic three-vessel and/or left main coronary artery disease in symptomatic patients on the basis of cardiac risk and electron beam computed tomographic calcium scores. J Am Coll Cardiol 1999; 33: 444–52. [37] Mahoney LT, Burns TL, Stanford W et al. Coronary risk factors measured in childhood and young adult life are associated with coronary artery calcification in young adults: the muscatine study. J Am Coll Cardiol 1996; 27: 277–84. [38] Loecker TH, Schwartz RS, Cotta CW, Hickmann JR Jr. Fluoroscopic coronary artery calcification and associated coronary disease in asymptomatic young men. J Am Coll Cardiol 1992; 19: 1167–72. [39] Janowitz WR, Agatston AS, Kaplan G, Viamonte M Jr. Differences in prevalence and extent of coronary calcium detected by ultrafast computed tomography in asymptomatic men and women. Am J Cardiol 1993; 72: 247–54. [40] Callister TQ, Raggi P, Lippolis NJ, Russo DJ. Coronary artery calcium scores on electron beam computed tomography: A normogram for 1628 patients (Abstr). J Am Coll Cardiol 1999; 33 (Suppl A): 415A. [41] Wilson PWF, D’Agostino RB, Levy D, Belanger AM, Silbershatz H, Kannel WB. Circulation 1998; 97: 1837–47. [42] Neaton JD, Wentworth D. Serum cholesterol, blood pressure, cigarette smoking and death from coronary heart disease. Overall findings and differences by age for 316 099 men. Multiple risk factor intervention trial research group. Arch Intern Med 1992; 152: 56–64. [43] Anderson KM, Castelli WP, Levy D. Cholesterol and mortality 30 years of follow-up from the Framingham study. JAMA 1987; 257: 2176–80. [44] Pyorala K, De Backer G, Graham I, Poole-Wilson P, Wood D, on behalf of the Task force. Prevention of coronary artery disease in clinical practice. Recommendations of the Task Force of the European Society of Cardiology, European Atherosclerosis Society and European Society of Hypertension. Eur Heart J 1994; 15: 1300–31. [45] Grundy SM, Bilheimer D, Chait A et al. Summary of the second report of the national cholesterol education program (NCEP) expert panel on detection, evaluation and treatment of high blood cholesterol in adults (adult treatment panel II). JAMA 1993; 269: 3015–23. [46] Schmermund A, Baumgart D, Go¨ rge G et al. Measuring the effect of risk factors on coronary atherosclerosis: coronary calcium score vs angiographic disease severity. J Am Coll Cardiol 1998; 31: 1267–72.
731
[47] Detrano R, Hsiai T, Wang S et al. Prognostic value of coronary calcification and angiographic stenoses in patients undergoing coronary angiography. J Am Coll Cardiol 1996; 27: 285–90. [48] Secci A, Wong N, Tang W, Wang S, Doherty T, Detrano R. Electron beam computed tomography coronary calcium as a predictor of coronary events. Comparison of two protocols. Circulation 1997; 96: 1122–9. [49] Arad Y, Sparado LA, Goodman K et al. Predictive value of electron beam computed tomography of the coronary arteries. 19-month follow-up of 1173 asymptomatic subjects. Circulation 1996; 93: 1951–3. [50] Arad Y, Sparado LA, Goodman K, Liedo A, Sherman S, Guerci AD. 3, 6 years follow-up of 1136 asymptomatic adults undergoing electron beam CT of the coronary arteries (Abstr). J Am Coll Cardiol 1998; 32: 210A. [51] Wong ND, Detrano RC, Diamond G et al. Does coronary artery screening by electron beam CT motivate potentially beneficial lifestyle behaviors? Am J Cardiol 1996; 78: 1220–3. [52] Hundley WG, Grayburn PA. Utility of screening for coronary artery calcium. Am J Cardiol 1996; 78: 1265–6. [53] Cheng GC, Loree HM, Kamm RD, Fishbein MC, Lee RT. Distribution of circumferential stress in ruptured and stable atherosclerosis: a structural analysis with histopathological correlation. Circulation 1993; 87: 1179–87. [54] Demer LL, Watson KE, Bostrom K. Mechanism of calcification in atherosclerosis. Trends Cardiovasc Med 1994; 4: 45–9. [55] Farb A, Burke AP, Tang AL et al. Coronary plaque erosion without rupture into a lipid core. A frequent cause of coronary thrombosis in sudden coronary death. Circulation 1996; 93: 1354–64. [56] Burke AP, Farb A, Tashko G, Liang YH, Virmani R. Is calcification a marker of stable or unstable coronary plaques? (Abstr). Circulation 1998; 98 (Suppl): I-655. [57] Schmermund A, Schwartz RS, Adamzik M et al. Sudden cardiac death as the first manifestation of ischemic heart disease in persons under age fifty: can extent of calcification predict presence of plaque rupture? (Abstr). J Am Coll Cardiol 1999; 33 (Suppl A): 301A. [58] Bocksch WG, Schartl M, Beckmann SH, Dreysse S, Paeprer H. Intravascular ultrasound imaging in patients with acute myocardial infarction: comparison with chronic stable angina pectoris. Cor Art Dis 1994; 5: 727–35. [59] Fitzgerald PJ, Ports TA, Yock PG. Contribution of localized calcium deposits to dissection after angioplasty. An observational study using intravascular ultrasound. Circulation 1992; 86: 64–70. [60] Schmermund A, Baumgart D, Go¨ rge G et al. Coronary artery calcium in acute coronary syndromes. A comparative study of electron beam computed tomography, coronary angiography and intracoronary ultrasound in survivors of acute myocardial infarction and unstable angina. Circulation 1997; 96: 1461–9. [61] Janowitz WR, Agatston AS, Viamonte M Jr. Comparison of serial quantitative evaluation of calcified coronary plaque by ultrafast computed tomography in persons with and without obstructive coronary artery disease. Am J Cardiol 1991; 68: 1–6. [62] Mo¨ hlenkamp S, Pump H, Baumgart D et al. The progression of coronary atherosclerosis is accelerated in patients with obstructive coronary artery disease in comparison to nonobstructive coronary artery disease, evaluation by electron beam computed tomography (Abstr). Eur Heart J 1998; 19 (Abstr Suppl): 126. [63] Maher JE, Bielak LF, Raz JA, Sheedy PF II, Schwartz RS, Peyser PA. Progression of coronary artery calcification: A pilot study. Mayo Clin Proc 1999; 74: 347–55. [64] Erbel R, Schmermund A, Baumgart D et al. Schlusswort: Electron-beam computed tomography. Noninvasive diagnosis of coronary arteriosclerosis. Dtsch A } rztbl 1998; 95: 2853–4. [65] Grundy SM. Age as a risk factor: you are as old as your arteries. Am J Cardiol 1999 83: 1455–7. Eur Heart J, Vol. 21, issue 9, May 2000
732
R. Erbel et al.
[66] Wexler L, Brundage B, Crouse J et al. Coronary artery calcification: pathophysiology, epidemiology, imaging methods, and clinical implications. A statement for health professionals from the American Heart Association. Circulation 1996; 94: 1175–92. [67] Rumberger JA, Brundage BH, Rader DJ, Kondos G. Electron beam computed tomographic coronary calcium scanning: a review and guidelines for use in asymptomatic persons. Mayo Clin Proc 1999; 74: 243–52. [68] Proudfit WL, Bruschke VG, Sones FM Jr. Clinical course of patients with normal or slightly or moderately abnormal coronary arteriograms: 10-year follow-up of 521 patients. Circulation 1980; 62: 712–17. [69] Emond M, Mock MB, Davis KB et al. Long-term survival of medically treated patients in the Coronary Artery Surgery Study (CASS) Registry. Circulation 1994; 90: 2645–57. [70] Rienmu¨ ller R, Lipton MJ. Detection of coronary artery calcification by computed tomography. Dynam Cardiovasc Imaging 1987; 1: 139–45.
Eur Heart J, Vol. 21, issue 9, May 2000
[71] Masuda Y, Naito S, Aoyagi Y et al. Coronary artery calcification detected by CT: clinical significance and angiographic correlates. Angiology 1990; 41: 1037–47. [72] Knez A, Becker C, Becker A et al. New generation computed tomography scanners are equally effective in determining coronary calcium compared to electron beam CT in patients with suspected CAD (Abstr). Circulation 1998; 98 (Suppl I): I-655. [73] Shemesh J, Apter S, Rozenman J et al. Calcification of coronary arteries: detection and quantification with doublehelix CT. Radiology 1995; 197: 779–83. [74] Shemesh J, Tenenbaum A, Fisman EZ et al. Absence of coronary calcification on double-helical CT scans: predictor of angiographically normal coronary arteries in elderly women? Radiology 1996; 199: 665–8. [75] Shemesh J, Stroh CI, Tenenbaum A et al. Comparison of coronary calcium in stable angina pectoris and in first acute myocardial infarction utilizing double helical computerized tomography. Am J Cardiol 1998; 81: 271–5.