When the beam is traveling parallel to a set of planes, backscattering is reduced. ..... a large) a stan- dard image is seen, for a collimated beam (d large, a small) a channeling ..... scanned rays pass through one point on the optic axis and a limiting aperture to .... center of the screen and focused with the final lens at a medi-.
Electron channeling patterns in the scanning electron microscope David C. Joy, Dale E. Newbury, and David L. Davidson
Citation: Journal of Applied Physics 53, R81 (1982); doi: 10.1063/1.331668 View online: https://doi.org/10.1063/1.331668 View Table of Contents: http://aip.scitation.org/toc/jap/53/8 Published by the American Institute of Physics
Articles you may be interested in Diffraction contrast and Bragg reflection determination in forescattered electron channeling contrast images of threading screw dislocations in Journal of Applied Physics 104, 124906 (2008); 10.1063/1.3042224 Secondary electron emission in the scanning electron microscope Journal of Applied Physics 54, R1 (1983); 10.1063/1.332840 Rapid misfit dislocation characterization in heteroepitaxial III-V/Si thin films by electron channeling contrast imaging Applied Physics Letters 104, 232111 (2014); 10.1063/1.4883371 Simulation and analysis of electron channeling contrast images of threading screw dislocations in Journal of Applied Physics 105, 093520 (2009); 10.1063/1.3110086 Electron channeling contrast imaging of atomic steps and threading dislocations in Applied Physics Letters 90, 234101 (2007); 10.1063/1.2746075 Characterization of encapsulated quantum dots via electron channeling contrast imaging Applied Physics Letters 109, 062101 (2016); 10.1063/1.4960643
Electron channeling patterns in the scanning electron microscope DavidC. Joy Bell Telephone Laboratories, Murray Hill, New Jersey 07974
Dale E. Newbury National Bureau 0/ Standards, Washington, DC 20234
David L. Davidson Southwest Research Institute, San Antonio, Texas
(Received 20 August 1980; accepted for publication 10 May 1982) This article provides a comprehensive review of the theory, practice, and application of electron channeling patterns in the scanning electron microscope. An atlas of indexed channeling maps for the bcc, fcc, diamond cubic, and hcp systems is included with a bibliography of 240 references containing all known published work on electron channeling for crystallographic studies in the SEM. PACS numbers: 07.80.
+ x, 61.16.Di
I. INTRODUCTION
The majority of contrast effects observed in the scanning electron microscope (SEM) are concerned with effects such as its surface topography or bulk chemical composition which are independent of the crystallography of the specimen. But in this paper we shall discuss a contrast mechanism in which visible effects are derived directly from the crystal structure of the specimen. Electron channeling patterns (ECP) are caused by a variation in the signal resulting from changes in the angle between the incident beam and the crystal lattice of the specimen. This effect is independent of, but may be superimposed on, the usual variation of the secondary and backscattered signals with the incident angle to the local surface normal. It will be shown that these make it possible to determine the crystalline orientation and symmetry of the sample, and that such features of the lattice as tilt and grain boundaries, and in some cases even individual defects, have been imaged and identified. A brief outline of the theory of this contrast is given below, and a mathematical treatment is given in Sec. II of this article. II. THEORETICAL ASPECTS OF ECP A. Simple theory of ECP
The probability of an electron being backscattered (that is, deflected through an angle of greater than 90°) depends on how close it approaches the nucleus of the atom that is scattering it. In the case of an amorphous material, irrespective of the direction from which the electron approaches the surface, the packing density of atoms will look the same and so the chance of the electron approaching close enough to a nucleus to be backscattered will remain constant. In the case of a crystalline material, however, the certain angles of incidence the electron will be moving parallel to the crystallattice ~lanes [see Fig. l(a)]. In such conditions the packing denSIty ?f the atoms will appear to be reduced because they ar: ~Il lt~ed up, and consequently the backscattering proba.bIllty Will fall. We can therefore predict, on this simple partIcle model, that the backscattering from a crystal will show modulations at angles of incidence related to the lattice structure. R81
J. Appl. Phys., Vol. 53, No.8, August 1982
While this model is instructive, it is not very easy to apply it rigorously when the incident energy of the electron is low ofthe order of kilovolts. The wave nature of the electron is more significant in that regime, and the channeling effect can be considered as a diffraction ofthe electron by the lattice. However, since an electron is both a wave and a particle, the two explanations are complementary and the choice is one of convenience. In terms of the wave model, the electron flux from the incident beam traveling through the crystal lattice can be mathematically represented as a number of standing waves, known as Bloch waves, each of which has the periodicity of the lattice. These Bloch waves are sets of plane waves propagating through the crystal from the top surface with their wave front parallel to the surface normal. The square of the amplitude of a Bloch wave at any point then represents the probability of finding an electron there, or in a macroscopic sense the local current density. In the very simplest case [Fig. lIb)] the current traveling in the specimen can be resolved into just two Bloch waves. The first, the type II wave, has its intensity maxima lying half way between the lattice planes while the other, the type I wave, has its maxima on the lines of atom centers making up the lattice planes. The electrons in the type II wave will, on the average, only interact weakly with the lattice because of their distance from it, and as a consequence, this wave is not strongly backscattered. The electrons in the type I wave, on the other hand, have a high probability of being found in close proximity to the nuclei, and this wave is therefore strongly backscattered. The ratio of Bloch wave II to Bloch wave I is determined by the angle between the incident beam and the lattice. Since the incident current is constant, the sum of the intensities in the two Bloch waves must also be constant, but the ratio of these intensities can vary and thus the backscattering will change. When the incident angle (as defined in Fig. 2) e is such that Braggs condition for a lattice spacing of d is satisfied, i.e., 2dsin
e =A,
where A is the electron wavelength, then the two waves are of equal intensity. However, for an incident angle () < () (where ()B is the Bragg angle) the intensity of wave I is great;
0021-8979/82/080R81-42$02.40
© 1982 American Institute of Physics
R81
I
i / / .' !!
/
f
/ TOTAL YAlllATION
I
IIICMAIIIU 9
• • • •
• • -- -- -- •• •• •• • • • • • • • • • - -• • • • • -• --• • •
• •
(a)
• • • • • • • • • • •
-- ..-. - --
• • • • • • • • • • • • • • • • •• • • •• • • • • 6, • • • .\ •
-
-I·
. - --
ICAIIB RAY
8 I
-
e. -- -+--8> 8 r
8> 8. - _•.&.0',,1--- --8
-
i '"....z
1.20 COMPUTER
1.15
For an imperfect crystal containing defects, elastic scattering occurs among all Bloch waves: dlj(z) = dLi(z) - p/li(z)dz,
(5)
where dL j(z) is the net scattering from all other Bloch waves to wavej. Spencer, Humphreys, and Hirsch (1972) use Eqs. (2), (3), and (5) to calculate the backscattered intensity exiting the crystal surface due to Bloch wave j:
I~(O) =
_l_[potJj(O)
1 + pat
+ (pi -
po) r'lj(z)dz
Jo
(6)
+p0i'V(Z)dZ].
To overcome the difficulty that the crystal thickness for a bulk crystal, the authors take a limiting t = t B beyond which negligible backscattering occurs. They assume tB = 0.4RB' where RB is the Bethe range, this having been found to give the best agreement with experiment. To get the total backscattered intensity, Eq. (6) is summed over all Bloch waves: t-+ 00
Is(O) = LI's(O)
= ~pOt + L(pi 1
J
+P f
j
pO) I'IJ(z)dz.
Jo
(7)
For perfect crystals, LJ(z) = 0 and Ji(z) is given by Eq.
000
222
333
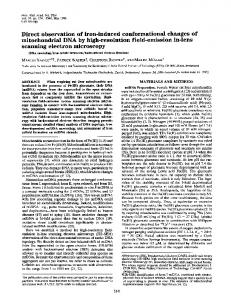
FIG. 5. Comparison of computer calculated and experimental profiles for silicon (Ill) channeling pattern at 20 kV, assuming, t = 211m.
diffraction. Sandstrom, Spencer, and Humphreys (1974) further developed this theory to account for energy losses suffered by the beam electrons. Results from the work of Spencer, Humphreys, and Hirsch (1972) are shown in Fig. 5. The comparison between the calculated channeling profile for (111 I-type reflections in silicon with measurements shows good correspondence, and the theory correctly predicts the effective absence of the (111) line in silicon, the low contrast being because the term (pi - pO) is close to zero. C. Properties of ECP Several important deductions can be made from the theory relative to the properties of channeling contrast. 1. Angular width of channeling lines
Schulson (1971) used a two-beam simplification of the Hirsch and Humphreys theory (1970) to deduce the angular width of channeling lines 2 Wg
(1 ):
2 2W = - II
The backscattering coefficients JI are calculated from a generalized version of the phonon scattering theory of Hall and Hirsch (1965): .
[I
2 2)2 L L C ~"C ih = -17'-(e mZIi 2
nNe
h
XL exp [21Ti(ii -
II
exp( -
Mh -
g)
h
g)'FJ
],
(10)
(12)
Sglgl'
where Sg is the extinction distance for the reflection g. Since IghkJ I = lId hkJ , Eq. (12) predicts that the channeling lines become sharper as the indices in a family hkl increase. This sharpening in the higher order lines is clearly seen in the calculation of the copper 220 systematics by Spencer, Humphreys, and Hirsch (1972), Fig. 6. In the case of the general theory where more than two beams are considered, the width given by Eq. (12) is not quite correct, but the difference is smalL
J
(11)
where n is the atomic volume, Ne is the number of atoms in the unit cell, e, m, and Ii are the charge, mass, and wavelength of the electron, Z is the atomic number, h, is Planck's constant, C~ and C~ are constants for thejth Bloch wave, exp( - M h _ g) is the Debye-Waller factor for the reflection (h - g), and exp [ ] is the structure factor familiar from x-ray R84
J. Appl. Phys., Vol. 53, No.8, August 1982
2. Behavior of channeling contrast with specimen thickness
Figure 7 shows the calculated contrast as a function of crystal thickness for silicon with a beam energy of20 ke V. As the crystal thickness is increased, the contrast, defined as (I max - I min)1I max for the (220) reflection changes as follows: 56.5% (50 nm); 45% (100 nm); and 17.4% (500 nm). The decrease in contrast as the thickness increases arises principally from an increase in the background. Calculations such Joy, Newbury, and Davidson
R84
(a)
0.168
of" ~
1.0
'" >Iiii 0.166
z
w
I-
z
0.6 ( b)
0.164
220
FIG. 6. Computed channeling profile for (220) systematics in copper at 20 kV.
as these confirm the important result that channeling contrast is mostly formed in a thin layer near the crystal surface, corresponding to no more than two extinction distances. For 20-keV electrons in silicon, this thickness is about 100 nm. 3. Channeling contrast as a function of the energy of collection of backscattered electrons
Calculations such as those of Fig. 7 reveal that the channeling contrast is generated in a thin surface layer where the beam electrons have lost little of their initial energy, whereas the background is formed mainly from events from deeper
7.3
~ ...J
* ~
7.2
7.1
o FIG. 8. Comparison of computed channeling profiles for (220) systematics in copper at Eo = 20 keY as a function of the energy E of the electrons collected. In (a) a window of electrons 100 eV wide below the incident energy is accepted while in (b) all electrons are accepted.
layers where electrons are expected to have lost more energy. Thus, we expect that in the spectrum of backscattered electron energy, the channeling contrast will reside in the high energy region. Computed channeling profiles for copper at 20 ke V considering (a) an energy acceptance window from Eo to E o-l 00 e V and (b) backscattered electrons of all energies show a strong effect of energy selection on channeling contrast (Fig. 8). Although the total signal is lower by a factor of sixty for the energy window, the contrast is 42% compared to 1.6% for the full energy spectrum. Wells (1971) has demonstrated experimentally that energy filtering can significantly increase the magnitude of channeling contrast.
20
15
"0
'"E
10
Z
4. Behavior of channeling contrast with beam energy
::> £Ii
a::
~ co t-1
5
o FIG. 7. Variation of the backscattered channeling intensity with thickness for a (220) systematic row in silicon at 20 keY. Note that the modulations in the signal remain about constant in level, but the mean signal level rises so the contrast falls with increasing thickness. R85
J. Appl. Phys., Vol. 53, No.8, August 1982
The behavior of channeling contrast as a function of beam energy can be predicted from Eq. (9). The background, given by pOt I( 1 + pOt) is expected to be independent of beam energy: pO from Eq. (10) is proportional to A 2 or 1/E 2 and t = t B for bulk crystals is proportional to E 2. Indeed, the measured background coefficient is found experimentally to be nearly independent of beam energy (Heinrich 1966). The channeling contrast superimposed on this background is given by J-l -'p, which varies as 1/E, sinceJ-l is proportional to 1/ E and p is proportional to 1/E 2. The net variation of all of these terms is 1/E, hence, channeling contrast is expected to vary as the reciprocal of the beam energy. Joy, Newbury, and Davidson
R85
III. ELECTRON OPTICAL CONSIDERATIONS A. Basic requirements 1. Collimation of the electron beam It has been shown in Secs. I and II that electron chan-
neling patterns come about as a result of changes in the angle of incidence between the electron beam and the crystal lattice. The contrast produced is a function of the angle of inc idence, and it is therefore important that this angle be clearly defined. This means that the electron beam must be collimated, so that it has a unique angle of incidence, rather than in the more usual form of a convergent beam. The amount of collimation will depend on the angular resolution of the pattern which is to be observed. No contrast at all will be observed for a beam cone angle at the specimen of the same order as the Bragg angle, that is typically about 40 mrad at 30 kY. Clearly, at a beam divergence of this magnitude each component of the incident beam will generate a pattern which is displaced in angle relative to those of its neighbors, and the result of adding together a large number of such patterns will simply be to produce uniform contrast and no channeling detail. As the convergence angle is reduced, these overlapping effects become less severe and contrast becomes visible when the cone angle falls to about one fifth of a typical Bragg angle, that is, 10 mrad or so at 30 kY. At this value only the major, low order bands of the pattern would be visible. However, if the cone angle is reduced still further the angular resolution of the detail on the pattern improves and the narrow, high order lines start to become visible. For most purposes, at 30 k Y a divergence of 3 mrad produces patterns of adequate quality, but for the best possible discrimination of detail a value of 0.5 mrad is desirable. For other operating voltages these values will scale proportionally to the Bragg angles. 2. Beam current
It was also shown in Sec. II that the signal contrast produced by the channeling effect on a bulk sample was low, a typical value being only 5%. In order to be able to see a contrast of this level above the inherent shot noise of the electron beam, a relatively high incident current is necessary, the actual value required depending on the scan time (e.g., see Goldstein et al. 1975). With a fairly long recording time, such as would be used for photographic purposes, an incident current of 10- 9 A is sufficient, but for visual scan rates a current in excess of 10- 8 A is required. 3. Spatial resolution
The production of a channeling pattern therefore requires both a collimated beam and an adequate value of incident beam current. In satisfying these requirements we also determine the spatial resolution (that is, the diameter of the incident beam) of the microscope. This is because of the fundamental constraint on any electron-optical system imposed by the brightness of the electron source used. For a source of brightness B (A/cm 2/str.), the incident current on to the specimen IBis given by 2
2
IB=2.5d a B(A),
(l3)
where d is the probe diameter in centimeters, and a is the RS6
J. Appl. Phys., Vol. 53, No.8, August 1982
d
201.
1,..
-2 10 radians
lOp
50J.i
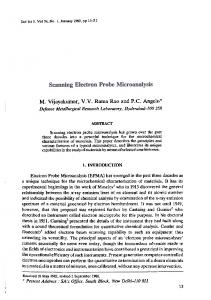
FIG. 9. Changes observed in the image of a single crystal of silicon as the beam divergence a and the probe diameter d are varied so as to keep the beam current fixed at 10 nA. For a focused beam ( d small, a large) a standard image is seen, for a collimated beam (d large, a small) a channeling pattern is observed.
beam semiangle of divergence in radians. For any fixed operating voltage, the brightness B is a constant of the electron source, therefore only two of the three quantities I B' a, and d can be chosen independently. To observe a channeling pattern, a minimum value of IB is necessary; thus it can be seen that the angular resolution of the pattern (that is, the beam cone angle a) can only be improved at the expense of the spatial resolution (which is determined by the probe diameter d). This effect is shown in Fig. 9 where the microscope has been adjusted so as to keep the incident current fixed at 10 nA while the beam divergence and probe diameter are varied. As the conditions are progressively varied from (a) to (d) the beam divergence 2a is reduced in order to improve the angular detail visible on the pattern. To keep IB constant, it is therefore necessary to select larger probe sizes. Thus, Fig. 9(a) is a standard micrograph showing topographical contrast, but as the conditions are changed to those of Fig. 9(d) the micrograph resolution deteriorates until no topographical contrast remains, while the angular resolution of the pattern improves until sharp lines are seen. 4. Angular scanning
It is clear that to produce a pattern the angle of incidence of the beam must change, during the course of a scan raster, through at least ± 20 8 , this angle being sufficient to display the band (of width 20 8 ) and the first higher order lines. Depending on how this change of angle is allowed to occur, we produce either standard wide area channeling patterns or selected area channeling patterns. Since the other electron-optical conditions are somewhat differently optimized in the two cases, we will consider the detailed setting up of the instrument for either mode of operation separately. B. Wide area ECP
Historically, the first observation of an electron channeling pattern was made by simply running the instrument Joy, Newbury, and Davidson
RS6
at its lowest magnification under conditions closely resembling those used for micrograph generation (Coates 1967). Consider the case where a large single crystal of some material is being viewed, with the microscope working at low magnification. If the working distance is Wand the magnification is M, then M = L I( W.2 tan (}),
¢l =DIs, where ¢l is the angle subtended by a point in the focused spot at the aperture, and tf;=Llu, where t/! is the angle subtended by the source at the aperture and where D is the diameter of the final aperture, L is the diameter of the crossover image from the previous lens, u is the distance of the crossover from the final lens, and s is the distance of the specimen from the final lens. If the microscope is set up to produce a high resolution micrograph, then the crossover diameter L before the final lens is very small, so J. Appl. Phys., Vol. 53, No.8, August 1982
LENS APERTURE DIAMETER D
(14)
whereL is the linear dimension of the viewing screen and eis the semiangle through which the scanning beam sweeps relative to the optic axis. For typical modern instruments using double deflection scan systems, and a working distance of the order of 1 cm, the scan angle is of the order of ± 8° for an indicated magnification of X 20. This angle is more than large enough to enable the incident beam to satisfy several orders of Bragg reflections during the period of its scan raster. Thus, provided that the whole scanned area is of the same orientation and that the other beam conditions are suitable, a channeling pattern will be obtained by simply running the microscope at its lowest magnification. If the magnification is increased, the scan angle will fall and less of the pattern will be visible. The same effect also occurs when the accelerating voltage of the microscope is lowered. On most instruments the scan circuits are compensated so that the magnification (and hence the scan angle) remains constant with changes in the operating voltage. But since the Bragg angle varies as the electron wavelength the width of bands on the screen will increase as (Eo) - 1/2, where Eo is the accelerating voltage. With the microscope operating in this way it is necessary that the entire scanned area be of the same orientation if a simple pattern is to be produced. There is thus no requirement for any spatial resolution if only a pattern is required. Consequently a large probe diameter can be used. It was shown in the preceding section that the three beam variables I B , d, and a are mutually dependent through the brightness equation. For a fixed value of the incident beam current, the product of a and d is constant, hence a large value of d must be used if a Iowa for high angular resolution is required. However, there are many different ways of operating the microscope so as to produce a collimated beam and some are much more efficient than others. Figure 10 shows three possible ways of operating the final, probe-forming lens of the SEM. In Fig. lO(a) the lens is being operated in the normal way for micrograph operation, so forming a focused beam onto the sample surface. The beam convergence angle 2a is the sum of two contributions (Schulson and van Essen 1969):
RS7
CROSSOVER FROM PREVIOUS LENS, OIAMETER L
SPECIMEN (o )
(b)
(c)
FIG. 10. Three possible ray paths for the probe forming lens of an SEM and their effect on the beam divergence. In la) the lens is focused on to the specimen, in (b) the lens is switched off, and in (c) it is weakly excited.
u is very small also, typically a few micro radians. But the focusing action of the lens will make ¢l large, since D is normally of the order of 100 flm and s is about 1 cm. Thus ¢l = 10- 2 rad, and with such a divergence the pattern quality would be very poor. Some improvement could be made by reducing the diameter of the final aperture to, say, 30 fl, while at the same time increasing the probe size to maintain the same beam current. In this case a pattern of adequate angular resolution can be obtained together with a probe of reasonable diameter, and this set of operating conditions can be used to produce the channeling contrast micrographs discussed in Sec. VI, or in cases where it is desired to produce a channeling pattern while retaining some spatial resolution, e.g., when studying offsets across a boundary in a crystal. The simplest approach to obtaining a pattern of high angular resolution is that shown in Eq. 10(b) in which the final lens has been switched off. This was the original method used by Coates (1968a,b) to enhance the patterns. In this case, using the same notation as above, the contributions to the divergence are ¢l
=
Diu
and tf;=Llu, and the value achieved will be considerably less than before since u>s. Typically, a value of 10- 3 rad is attainable. This approach has the merit of being very easy to use and of giving patterns of good quality. However, no control of the beam divergence is available, and switching off the lens can sometimes produce uneven image illumination due to residual magnetization in the pole piece, or to misalignments in the previous lenses. The probe diameter will be about the same as the diameter of the final aperture, that is, of the order of a hundred micrometers or more, and so only the largest surface detail will be imaged. Because the condensor lenses can be weakened without affecting the spatial resolution, significantly high incident beam currents can be obtained. The optimum technique is that shown in Fig. lO(c) where the final lens is on, but only excited to about 20% ofits normal current. If the excitation is adjusted so that the previous crossover is at the focal point of the final lens, then
¢l
=
0, Joy, Newbury, and Davidson
RS7
and
tP =
L /u = L If,
wherefis the focal length of the lens. By controlling the size of the crossover and the excitation of the final lens, the divergence can be varied over a range of values, with a minimum angle of < 10- 4 rad being possible. Because the beam is being collimated by the lens, the limit is set only by the source size. However, the brightness relation still applies and very small values of a will lower the incident current. In this case also the probe diameter is of the same order as the final aperture size. Depending on whether or not any spatial resolution is required, a wide area channeling pattern can therefore be obtained by limiting the beam divergence with an aperture, or by collimating it with a lens, and relying on the normal scan action to sweep the beam through a sufficient range of angles to make the pattern contrast visible. For many applications this method of producing channeling patterns is adequate, particularly as it allows for the rapid assessment of large single crystals with a visual indication of the position and magnitude of any crystallographic boundaries. However, there are many applications for which the prime requirement is the ability to generate the pattern from a small, selected area of a sample, and this is obviously not possible in any technique relying on the beam scanning through a large angle. Thus special techniques must be employed, and these are discussed in the following section.
c. Selected-area channeling patterns It would be possible to produce a channeling pattern from a small, selected area of a sample if the change in angle of incidence of the beam relative to the lattice could be obtained without any lateral motion of the probe occurring. In each case the parameters of the electron beam at the surface will need to be the same. There are several ways in which this can be achieved, and each of the possible approaches is discussed below. The problem is to obtain both sufficient angular resolution to produce an acceptable pattern and a fine enough probe to attain the required spatial resolution. The conditions used are those shown in Fig. lO(a), in which the final lens is used to produce a focused probe, but the beam convergence angle is limited by the choice of aperture. At 30 kV, a properly operated thermionic gun having a brightness of B = 3 X 10⁴ A/cm" str is capable of putting 10- 9 A into a I-pm-diam probe with a beam divergence of 3 X 1O-~ rad, and these conditions are suitable for the production of high quality patterns. The precise way in which they are achieved depends on the technique employed, and the details will now be considered.
Coates 1967; Brunner and Erlewein 1978) and they offer the advantages of simple electron optics and a large maximum angle of rock. The major problem is in the accuracy with which the point of interest can be held stationary under the beam. In a purely mechanical stage an accuracy of about 1 pm per degree of rock can be achieved with care, giving a minimum selected area of 10 pm for a reasonable rocking angle. Computer controlled rocking stages would appear to be able to offer higher accuracy, but this has not been done at the present time. 2. Double deflection beam rocking systems
The most common form of scan geometry in modern SEMs for topographic imaging is the double deflection method [see Fig. 1I (a)]. In this system, there are two sets of scan coils driving from the same scanning waveform. The first deflects the beam away from the optic axis through some angle; the second set of coils then deflects the beam through a larger angle in the opposite sense so that it once more crosses the optic axis. As a result of this action, all the scanned rays pass through one point on the optic axis and a limiting aperture to control beam divergence can conveniently be put in this plane without restricting the scan action in any way. Normally this point is well above the surface of the sample so as to produce a large raster area for any given scan angle. Clearly, if the sample could be moved up to this position, then the beam would remain stationary on the surface of the sample while rocking its angle of incidence through the course of each raster. This is the condition required to generate a selected area channeling pattern. In practice, the strength of the second scan coil is reduced, and in this way the scan crossover point can be brought to any vertical distance below the lens. This technique is simple to apply since the necessary condition can be obtained by either shunting the lower scan coils with a suitable parallel resistor so as to reduce the current passing through them or by using a separate set of auxiliary scan coils placed below the final aperture. If the normal scan coils are used, then the final aperture must be large enough to allow the full range of scan angles to pass through. Depending on the specimen distance
I /
>
"
]
["ON"
]
["ON"
]
\. ['OFF"
]
. . ["OFF"
:
I
(c)
r
(d)
FIG. II. Ray optics for normal double deflection scanning (a), and for single deflection scanning Ib)-Id). Note how the crossover point of the scanning moves as the excitation of the final lens is changed, giving a rocking beam condition for one setting of the lens. Joy, Newbury, and Davidson
RBB
and the angle of rock required, this may mean that the aperture has an opening as large as several millimeters in diameter. In that case the convergence cone angle of the beam must be controlled by an aperture placed at a suitable point further back up the column. Alternatively, a set of auxiliary scan coils placed below the lens can be used to scan the rays back through a point on the specimen surface. In this arrangement the final aperture can still be used to control the beam divergence. Normal micrograph operation can then be restored by returning the scan coils to their normal strength in the first case, or turning off the auxiliary coils in the second case. Double deflection rocking beam techniques have been used on several types of instrument (van Essen and Schulson 1969; Schulson et al. 1969; Davidson 1976) and can be found on several commercial microscopes including JEOL JSM-35 and U3, and on the ETEC Autoscan series. The chief drawback to the method is that the minimum area attainable is not very small, a value of 50 pm for a scan angle of 10° being typical. The reason for this is that the double-deflection scan system is essentially mimicing the action of a lens in the sense that the point from which the scan action starts and the final crossover are like the conjugate object and image points of the lens, although unlike a lens only one ray bundle is passing through the system at anyone time. The scan system thus
(d)
(b)
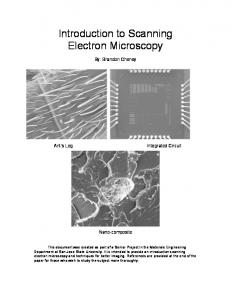
FIG. 12. Setting up the single deflection rocking beam condition. (a) Micrograph of a 16 I'm repeat copper grid placed on a silicon wafer recorded at X 500 in normal (double scanning) mode (bHf). The appearance of the grid observed in single scanning mode at X 20 as the final lens excitation is varied. In (e) the beam is rocking inside one grid square producing a channeling pattern from the silicon beneath. Note the change from barrel to pincushion distortion after passing through the rocking point. R89
J. Appl. Phys., Vol. 53, No.8, August 1982
displays all the normal aberrations of a probe forming lens and in particular that of spherical aberration. This aberration arises because rays traveling at a large angle to the optic axis are deflected more strongly than are rays moving more nearly parallel to the optic axis. As a result, the high angle rays are brought to a "focus" at a point nearer to the lens than the par-axial rays. Consequently, the crossover point is extended into a disc ofleast confusion, this being the circle of minimum diameter through which all the ray bundles pass. The diameter of this circle is given as 1I2·Cs ·8 3, where 8 is the semi-scan angle and Cs is the coefficient of spherical aberration of the deflection coil. Typically, the scan coil assemblies in SEMs are not precision devices with the result that the effective value of Cs is 10-20 cm. Since 8 is of the order of 0.1 rad, the minimum selected area is thus 50-100 pm in diameter. Although this is considerably smaller than the area needed to generate standard wide area channeling patterns, it is too large for many applications. Significant improvements can only be made by reducing C, or 8. Lowering the scan angle produces a rapid improvement in the area selected because of the cubic dependence of the aberration on this angle. However, too small an angle makes the identification and indexing of a pattern very difficult. Cs can be lowered by improving the design of the scan coils, and recent work on the design of precision scanning systems for electron lithography applications indicates that perhaps a factor of two or three could be achieved. Alternatively, a dynamic correction system could be employed to correct for the effects of the aberration. But in practice the best performance that might be achieved does not compare with the results possible using the approach described below and double reflection beam rocking techniques have therefore not been widely used. 3. Deflection focus systems
The limitations of the double deflection optics for generating selected area channeling patterns are mitigated by a technique due to van Essen, Schulson, and Donaghay (1970, 1971). The starting point is once again the double deflection scan system shown in Fig. 11(a). If the lower scan coil is switched off, as in Fig. 11 (b), then the ray bundle deflected by the upper set of coils will continue to diverge from the optic axis until they eventually enter the field of the final lens. The normal focusing action of the lens will bend the ray bundle back towards the optic axis [Figs. II(c) and II(d)]. Since all the scanned rays originate from one point, the lens will focus them in such a way that they pass through the conjugate point on the optic axis again. The distance of this crossover point from the lens will be determined by the focal length of the lens and the distance of the object (in this case the scan point) from the lens. By adjusting the strength ofthe lens, the point through which all the scanned rays are rocking can obviously be brought to the surface of the specimen [Fig. II(b)] and the beam will then be rocking about the surface normal as is required for the selected area channeling pattern mode. When adjusted in this way, the point from which the scanned rays originate and the rocking point on the specimen surface have been made conjugate. However, for norJoy, Newbury, and Davidson
R89
mal micrograph operation the lens is adjusted so that the surface is conjugate with the crossover image produced by the preceding lens so that a focused probe is produced. Since the change from rocking beam operation to normal micrograph operation can be accomplished by simply switching the lower set of scan coils back on, it would be necessary to refocus the lens on switching modes if both a focused micrograph and a correctly adjusted channeling pattern condition was to be achieved. This difficulty can be overcome by making the focus point of the previous lens coincide with the scan point. One adjustment of the lens will then give a focused probe, in micrograph mode, and a rocking beam on the surface in SACP mode. The way in which these conditions are experimentally obtained can be seen from a consideration of Fig. 11 and the corresponding sections of Fig. 12. As the strength of the lens is varied in the deflection focus mode, the crossover point of the scan moves relative to the specimen surface and consequently, on the display screen, a variation in the effective magnification of the image can be seen. As the crossover point moves towards the surface the magnification will increase and, ideally, reach infinity at the exact rocking condition, leaving only the desired channeling contrast. In the micrograph mode, on the other hand, the strength of the lens is adjusted so as produce the best image focus. In order to satisfy these two conditions simultaneously, the following procedure is adopted. A suitable feature is brought to the center of the screen and focused with the final lens at a medium magnification (say X 500). The lower scan coils are then switched off, the "magnification" is set to the lowest value so as to generate a large angle of rock, and the image is again observed [Figs. 12(a} and 12(b}]. In general, a high magnification image of the same area will be seen because the rocking crossover point will be either above or below the specimen surface [as in Figs. II(c} and 11(d)]. By adjusting the strength ofthe final lens the chosen feature can be made to increase in magnification [Figs. 12(c) and 12(d)) until a maximum magnification is obtained [Fig. 12(e)] and the selected area channeling pattern is visible. At this condition the beam is rocking about the chosen point on the specimen surface and any further adjustment of the lens will bring the crossover point to the other side of the specimen surface, and a micrograph, rotated by 180° relative to the previous ones, will be seen [Fig. 12(f)]. Without touching the final lens excitation, therefore, the lower scan coils are again switched on and the magnification is adjusted to X 500 again. The micrograph image will now be out of focus because the crossover of the previous lens is not now correctly conjugate with the specimen surface. By now adjusting the strength of this condenser lens the image can be brought into focus. When this is done the lens crossover is lying in the same plane as the scan point and the change from micrograph to selected area channeling pattern can be made by switching the scan coils and the magnification. In either mode the conditions are optimally set up without the need for constant correction. The other necessary electron-optical conditions are set up as described previously. Because the entire rocking angle of the beam has to pass through the final aperture, a large diameter must be chosen, a value of several millimeters being R90
J. Appl. Phys., Vol. 53, No.8, August 1982
typical. The beam divergence is then controlled by an aperture of appropriate size placed further up the column. The probe size is adjusted to give an adequate incident beam current for the low contrast from the patterns; this will usually need to be of the order of I J-lm or so. In a three lens electronoptical column for which independent control of each lens excitation is available, the final lens controls the selected area, the second lens sets the image focus, and the first lens determines the probe size. Instruments on which the first two lenses are ganged together have less flexibility and some compromise in operating conditions is then usually necessary. The deflection focusing technique is now available on several commerical instruments including the Cambridge "Stereoscans," AMRA Y, Philips, JEOL, Cameca, and lSI. The simplicity of the technique, and the fact that it is easily fitted to any SEM using a double deflection scan system, has ensured its acceptance over the double deflection approach. The commercial versions of this technique differ in detail as to their operation and setting up procedures, and in some cases the ideal arrangement described here in which both a focused micrograph and an optimized pattern are available cannot be attained (e.g., Booker and Stickler 1977). In all cases, however, the minimum selected area obtained with this technique is substantially better than that using the double deflection technique. The diameter of this area is again set by aberrations in the system. In this case the final lens is the limiting factor rather than the scan coils, and because the probe-forming lens is a precision component the performance is significantly improved. As before, the area is given by the relation 1I2.Cs ·0 3, where now C, is the spherical aberration coefficient of the lens. The actual area can therefore be reduced by lowering either Cs or O. The value of C, for a lens depends strongly on the focal length, with Cs typically being of the order of the focallengthfbut varying asf2. Hence if the working distance of the lens is decreased, that is to say, ifthe lens is run at a higher excitation, then the aberrations will fall. For example, in a Cambridge "Stereoscan" at the usual working distance of about I cm the minimum selected area for a 10° rock angle is about 8 J-lm. By reducing the working distance to the minimum value possible, the area can be made as small as 3 J-lm for the same rocking angle (Booker and Stickler 1972). The minimum working distance will be set by both geometrical constraints imposed by the lens and stage design and by the difficulty of collecting the signal produced (although at short working distances the specimen current signal is very effective), but in all circumstances the lowest value should be used. Because of the dependence of the selected area on the Cs of the lens, extremely good results are obtained using the single deflection method in high performance transmission electron microscopes fitted with a scanning attachment, such as the JEOL 100C and Philips EM400 series. The probe-forming lenses in such instruments have Cs values ofthe order of only a few millimeters, and since in addition the average value of a Bragg angle at 100 kY is only half that of its 30 kY value, the use of a rock angle of 5° or so readily enables areas of 1 J-lm or less to be selected at 100 kY. The minimum selected area can always be reduced by choosing a smaller angle of rock, but Joy, Newbury, and Davidson
R90
too small an angle relative to a typical Bragg angle will make recognition of the pattern difficult. An alternative approach to improving performance is to use some form of dynamic correction (van Essen 1971). In this approach, use is made of the fact that, unlike the situation with normal lens operation, only one ray bundle is passing through the lens at anyone time. By correctly changing the focal length of the lens in accordance with the angle of the ray passing through the shift in the crossover point caused by spherical aberration can be almost completely eliminated and the selected area correspondingly reduced. The accuracy of the correction depends on the scan rate in use since hysterisis effects in the lens prevent very rapid changes in excitation, and for this reason early systems used a spiral scan raster since in this mode the scanning angle changes uniformly with time at the rate of one frame rather than sweeping between its extreme values during each line scan. With a device of this kind a minimum selected area of one micrometer at 30 kV was demonstrated (Joy and Newbury 1972). More recently, improvements in the lens winding design have made it possible to successfully carry out corrections while using a cartesian scan at normal visual rates, and a commercial device of this type is now available from JEOL.
A
FIG. 13. Appearance of a channeling pattern from silicon at 20 kV (a) without and (b) with differential signal amplification.
B
D. Effect of the take-off angle on ECP
The electrons leaving the specimen have an angular distribution which is also a function of the specimen orientation. If the signal is collected by a detector which sub tends a small solid angle at the specimen, and can be moved relative to the sample, then contrast changes will occur in the ECP. These effects include variations in the magnitude of the contrast and even reversal in its sign (Ichinokawa et al. 1974; Reimer 1979). A satisfactory theoretical treatment of these effects has not yet been presented.
available in a modern SEM: (I) differential signal amplification (also variously known as black level, dark level, or contrast expansion) and (2) signal differentiation (Lander et al. 1963; Newbury 1975). Differential signal amplification proceeds in two stages, illustrated schematically in Fig. 14. First, a fixed dc component is subtracted from the signal, Fig. 14(a), giving the re-
IV. SIGNAL PROCESSING FOR THE OBSERVATION OF ELECTRON CHANNELING CONTRAST
After the electron optical parameters (beam energy, current, and divergence) have been properly chosen so that the desired channeling information is resident in the signal coming from a detector, the contrast must be properly displayed on the cathode ray tube to ensure visibility in the final image. The maximum contrast in the unfiltered backscattered signal due to the channeling effect is only about 5%, which is at the limit of perception of the average observer. The appearance of an electron channeling pattern in which the signal is displayed directly without any special signal processing is shown in Fig. 13(a). Only the most prominent features of the pattern can be observed, and then only with difficulty; all of the fine scale angular details which produce lower values of contrast are lost. Electron channeling contrast is a classic example of a frequently occurring contrast display problem in scanning electron microscopy, namely, a situation in which the desired information is a small scan-varying perturbation superimposed on a background. As a result, the channeling information resides in only one or two gray levels in the final display and has poor visibility. Two effective signal processing strategies for the display of the background are routinely R91
J. Appl. Phys., Vol. 53, No.8, August 1982
- - - - - - - - - - - - - - - - - PEAK WHITE
~fAC --------------
(0)
D~LACK LEVEL
-----------------PW
...J
0
0
'"
0
~ 0
0
~
0 0
0
-K'-
FIG. 26. Unit triangle (001)·(011)·(111) showing the loci of variation of the normalized Miller indices H, K, L.
stereogram in use can be superimposed and the indices read off directly, the third one being found from Eq. (22). The unknown orientation may therefore be recorded as either (X,Y) coordinates on a stereogram of radius R or as (HKL) indices. If standard Miller indices are required, then they may be obtained by dividing through (HKL) by the highest common factor of the indices. The indices so obtained refer only to the reference unit triangle; consequently there are other possible correct and formally identical solutions which can readily be derived if required (through mirror or rotation operations). D. Accuracy of orientation determinations
The accuracy of an orientation determination depends upon several factors. The most significant of these is the accuracy with which the required face can be placed normal to the beam axis. Using the methods described and taking reasonable care, this can be done to about ± 1/2 for specimens with large planar faces. In cases where the surface is uneven, the error may be substantially larger and it may only be possible to define a mean surface normal for the sample. These problems apply equally to any other technique available for the orientation determination of bulk specimens however. The effective error introduced by the uncertainty in the position of the optic axis on the channeling pattern can be reduced, using the techniques described, to less than 0.10. The other sources of inaccuracy arise from the operation of matching the unknown pattern to the unit triangle map and then transferring the point to the stereogram. A pattern taken under typical conditions (i.e., a beam divergence of 3 mrad and a rocking angle of 9 contains enough major features and fine detail to make identification with the reference map a very accurate process. Certainly the error should only be of the order of the beam divergence, that is, about 0.20. The final step of transferring this point to the stereogram is reasonably accurate provided that the "coordinates" of the unknown point are measured with respect 0
The normalized Miller indices (HKL ) are thus derived directly from the stereogram. The indices in normalized form have several convenient properties. Firstly, as shown in Fig. 26, the indices move in a regular progression through the stereogram. Thus all poles with the same value ofH lie on the same small circle about (100), all poles with the same value of K on the same small circle about (101), etc. Secondly, the HKL values are direction cosines and thus the angle between two poles H]K]L] and H2K2L2 is given by
0
)
cos e]2 = H]H2
+ K]K2 + L]L 2.
(21)
Finally, since
H2+K2+L2= 1,
(22)
only two of the indices need be determined. Thus a chart of the type shown in Fig. 26 if available at the radius of the R 101
J. Appl. Phys., Vol. 53, No.8, August 1982
Joy, Newbury, and Davidson
Rl0l
a
c
(1111
d
FIG. 27. Worked example of an orientation determination for a small flake of silicon. (a) is the map and (b) is the experimental selected area pattern. As described in the text, this is located on the map (shown as '.') and transferred, by measuring its spacing from known poles, to the constructed map (c). (d) shows the pole placed in the unit triangle. The normalized Miller indices of the pole are (0.15, 0.24, 0.96) which is close to (35 19).
to a sufficient number of poles around and near to the point, since in this way the errors associated with the assembly of the map are minimized. The overall accuracy of such orientation determinations has been tested experimentally (Joy, Booker, Fearon, and Bevis 1971) by a direct comparison with the results obtained from an independent determination using the well established Kossel technique (Yakowitz 1972). These results show that, using the procedures described above, an absolute accuracy of better than 1 can be obtained. In view of the rapidity with which the result can be obtained, particularly as compared with other possible techniques, this is a highly satisfactory result, and similar quality answers should be available from any system in which it is possible to obtain channeling patterns of acceptable quality. For many purposes only a relative orientation is required, as for example, between two grains or a precipitate and its matrix. In this case the precision of the result will be high as errors such as 0
R102
J. Appl. Phys., Vol. 53, No.8, August 1982
the setting of the specimen relative to the beam will disappear. In the limit, as in the case of a low angle boundary, for example, the precision of the determination of the misorientation will be set only by the beam divergence. Figure 27 shows a fully worked example of an orientation determination for a small flake of silicon. The map was constructed from a machined hemisphere of silicon and the constructed map was drawn using the procedure described above. In order to improve the precision of the result, two channeling patterns were recorded from the unknown: one with a wide angle of rock (10°) to determine the general area of the map in which the pole lay and a second smaller angular range pattern to fix the point more precisely. These pattern areas are marked on the map, and the position of the optic axis is then transferred to the constructed map as shown. Finally the pole is plotted into the unit triangle of the stereogram and its coordinates measured to find its Miller indices. Another worked example is given in Joy et al. (1971). Joy, Newbury, and Davidson
R102
The appendix contains a selection of experimental and constructed maps covering many of the lattice parameter and accelerating voltage conditions of interest. E. Complete orientation determinations
In the procedures described above the specimen orientation has been found in terms of the Miller indices of the surface normal referred to a chosen unit triangle. Whilst this is sufficient for many purposes, there are occasions when it is necessary to define a complete orientation, that is, the indices of the surface normal together with one crystallographic direction in the surface plane, for example, when twinning relationships or precipitate habit planes are being investigated. In such a case the following procedure can be employed. The bands and poles on the pattern are identified and indexed as previously described. The zone axis (hkl ) corresponding to the lattice planes for the band (hkl ) appearing on the pattern, together with a pole defined by the crossing of this band with one or more additional bands, are plotted onto a stereographic projection. Figure 28 shows an example of the application of the method to a pattern taken from a specimen or iron. The experimental channeling pattern is shown together with a scale drawing. The center of the pattern (i.e., the optic axis) determined as discussed above is used as a reference point and the angles e,