The identification of crystallographic phases in the scanning electron microscope (SEM) has been limited by the lack of a simple way to obtain electron diffraction ...
308
Copyright (C) JCPDS-International Centre for Diffraction Data 1999
MicroDiffraction in the Scanning Electron Microscope (SEM)* R. P. Goehner, J. R. Michael, and M. E. Schlienger, Microstructural Sandia National Laboratories, Albuquerque, NM 87 185 1405
Characterization,
ABSTRACT The identification of crystallographic phases in the scanning electron microscope (SEM) has been limited by the lack of a simple way to obtain electron diffraction data of an unknown while observing the microstructure of the specimen. With the development of Charge Coupled Device (CCD)-based detectors, backscattered electron Kikuchi patterns (BEKP), alternately referred to as electron backscattered diffraction patterns (EBSP), can be easily collected. Previously, BEKP has been limited to crystallographic orientation studies due to the poor pattern quality collected with video rate detector systems. With CCD detectors, a typical BEKP can now be acquired from a micron or sub-micron sized crystal using an exposure time of 1- 10 seconds with an accelerating voltage of 1O-40 kV and a beam current as low as 0.1 nA. Crystallographic phase analysis using BEKP is unique in that the properly equipped SEM permits high magnification images, BEKP’s, and elemental information to be collected from bulk specimens. BEKP in the SEM has numerous advantages over other electron microscopy crystallographic techniques. The large angular view (-70 degrees) provided by BEKP and the lack of difficult specimen preparation are distinct advantages of the technique. No sample preparation beyond what is commonly used for SEM specimens is required for BEKP. INTRODUCTION The identification of unknown micron-sized phases in the SEM has been limited by the lack of a simple way to obtain crystallographic information about the unknown while observing the microstructure of the specimen. A variety of techniques are available that can provide some information about the identity of unknown phases. For example, energy dispersive x-ray spectrometry (EDS) is of some use but obviously cannot distinguish between phases of similar compositions but different crystal structures ( an example of this is Ti02 that has two tetragonal structures with different atomic arrangements and an orthorhombic structure). Other techniques can provide the required information but have significant limitations. Micro area x-ray diffraction techniques are capable of identifying crystalline phases, but cannot be used to identify sub-micron sized areas. Selected area electron diffraction in the transmission electron microscope (TEM) can provide crystallographic information from sub micron-sized regions of the specimen, but TEM requires electron transparent thin specimens to be produced which is time consuming and * This work was supported by the United States Department of Energy under Contract DE-AC04-94AL85000. San&a is a multiprogram laboratory operated by Sandia Corporation, a Lockheed Martin Company, for the United States Department of Energy.
Copyright (C) JCPDS-International Centre for Diffraction Data 1999
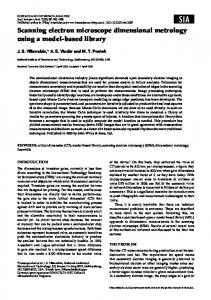
can be very difficult. The first application of BEKP’s for phase analysis was to identify symmetry elements and crystal structure in the SEM [l-5]. Phase identification via this approach required a high degree of crystallographic symmetry expertise. In this paper we demonstrate that BEKP in the SEM using a charged couple device (CCD)-based detector can provide crystallographic phase identification of sub-micron sized areas with little or no difficult specimen preparation nor the extensive expertise required previously. The details of the detector and its calibration are described elsewhere [5-91 Theory BEKP’s are obtained by focusing the incident electron beam on the feature of interest. The electron beam is held stationary and the specimen is tilted, normally about 70 degrees, toward the detector. The highly divergent inelastically scattered electrons are diffracted into flat cones with an apex angle of 90-O[ lo]. Because the wavelength of 2040 kV electrons is small, the Bragg angle 0 is less than 2 degrees. These flat cones intersect the detector revealing nearly straight Kikuchi lines. Two Kikuchi lines are formed for each diffraction condition because both +O and -0 form cones. The resulting Kikuchi pairs are separated by 20. Zone axes are readily observed where two or more Kikuchi line pairs cross. The angular separation of the zone axes relate directly to the angular separation calculated from the crystal structure. The angle formed by the intersection of Kikuchi pairs also relates directly to the angles calculated from the crystal structure [ 111. We observed that the apparent intensities of the Kikuchi lines are proportional to the structure factor squared and do not vary significantly as the crystal orientation is changed. this insensitivity to crystal orientation is an important property that makes BEKP useful for phase identification and crystallographic orientation determination [12, 131. Since the Kihuchi pattern is formed from the intersection of cones on a flat detector parallel to the beam direction, the pattern is distorted in the resulting gnomic projection [ 141. In order to correct for the resulting distortion, the Kikuchi pattern center and the specimen to detector distance must be determined accurately. The pattern center is the projection of the electron beam impact point onto the detector scintillator. Finally to obtain high quality imaging, a flat-fielding procedure is used [7]. Experimental The procedure followed for phase identification in the SEM is illustrated in Figure 1. Fist, a feature of interest is identified in the SEM. The electron beam is then focused on this area. An energy dispersive spectrometer is used to determine the elemental constituents from this feature. At the same time or immediately following the collection of the EDS spectrum, the BEKP pattern is collected. The interplanner spacings and crystal plane angles are extracted from the BEKP by a Hough transform algorithm. This information is used to derive the reduced cell volume. In some cases, this calculation
309
Copyright (C) JCPDS-International Centre for Diffraction Data 1999
results in a sub cell volume. The subcell is related to the actual reduced cell volume by an integer. The subcell volume along with the elemental information is used to search the ICDD’s powder diffraction data base. The software takes the results of this search and attempts to assign (hkl)‘s to the Kikuchi lines that are consistant with the observed (hkl)‘s from the pattern. Once a candidate phase is identified, its Kikuchi pattern is simulated and overlaid onto the observed pattern. If more than one candidate phase is found the microscopist can page through all of the possibilities and observe the best choice. It has been our experience that the correct choice is normally obvious. This match mode provides a very powerful verification tool for the analyst.
I 1 Simulation of Candidate Matches 4 *Phase Identification* Figure 1 Diagram of phase identification process in the SEM In order to illustrate the power of this technique, an example of the analysis of solder joint crystallographic phases is used. Figure 2a shows an SEM micrograpgh of the AgSn solder. In particular notice the needle like phases. The width of these needles is - 0.1 micron and their length is -10 microns. Figure 2b is the BEKP pattern obtained from the needle phase after flat-fielding the original image.
310
311
Copyright (C) JCPDS-International Centre for Diffraction Data 1999
Figure 2a. SEM Micrograph
Figure 2b. BEKP from needle like phase
The BEKP pattern obtained from this specimen demonstrates that a suitable pattern for phase Identification can be obtained from -0.1 micron regions.
Ia FIF
Data --_- far _-_ card --_- #29-l -_ _ 151 _-_
,-I cam *‘29-l
Ctystaf ldetiitication EMJW! 1 131
Iteffections E?@2 f%MXi& lzy,)
Name: Siluer Tin
Itiwmation
Space Gmup: P63/mmc Number: 1 g4
q
Powder
Intensities
(1031
1.4830 1.3544
13 13
(213) (2111
0.8292 0.9514
8 8
{ 110)
CvstalFamily: Hexagonal ieduced volume: 36.43
loynai$
(0021
+x-muh:Ag4 Sn
&&al
d(A) 2.2628 2.3910
27
a: 2.9660 b: 2.9660 c: 4.7820 alp~:90.0000 beta: go.oooo ga-: 120.0000
Figure 3. Shows PDF data Figure 3 shows the results of the ICDD data base search [15]. The phase Ag$n card # 291 15 1 is the only phase that fulfilled the elemental and reduced cell volume constraints, and could be indexed. The phase Ag$n does satisfy the chemistry constraints but the experimental BEKP would not index. Figure 4 shows the simulated pattern overlaid directly on to the experimental pattern. The indiceswith the square bracke designate zone axes (directions). In addition, the program can show the results of the indexing procedure
Copyright (C) JCPDS-International Centre for Diffraction Data 1999
by drawing the Kikuchi lines used to index the pattern directly on the observed BEKP. It can also illustrate the method used by the program to measure the distance between Kikuchi lines and thus calculate the interplanner spacings. Summary We have successfully utilized backscatteres electron Kikuchi patterns for crystallographic phase analysis in the SEM utilizing the ICDD powder diffraction data base with over 40,000 inorganic phases. The successful determination of the phase is straight forward and does not require a trained crystallographer in most cases. This technique can now be used where previously microdiffraction and transmission electron microscopy (TEM) were the only choices. Sandia has licensed the software to NORAN to be used with their Phase ID
Figure 4. Simulated pattern overlaid directly on experimental pattern
312
Copyright (C) JCPDS-International Centre for Diffraction Data 1999
References: [l] D. J. Dingley and K. Baba-Kishi, Use of backscattered electron diffraction patterns for determination of crystal symmetry elements, Scanning Electron Microscopy, Vol. II, 0. Johari ed., SEM Inc., Chicago, 383, (1986). [2] D. J. Dingley , R. MacKenzie and K. Z. Baba-Kishi, Application of backscatter Kikuchi diffraction for phase identification and crystal orientation measurement in materials, Scanning Electron Microscopy, Vol. II, 0. Johari ed., SEM Inc., Chicago , 305, (1989). [3] K. Z. Baba-Kishi and D. J. Dingley, Application of backscatter Kikuchi diffraction in the scanning electron microscope to the study of NiS2, J. Appl. Cryst. 22, 89 (1989). [4] K. Z. Baba-Kishi, Use of Kikuchi line intersections in crystal symmetry determination: application to chalcopyrite structure,Ultramicroscopy 36, 3 55 (199 1). [5] K. Z. Baba-Kishi, A study of the breakdown of Friedel’s law in electron backscatter Kikuchi diffraction patterns: Application to the zincblende-type structures, J. Appl. Cryst. 24,38, (1991). [6] R. P. Goehner, J. R. Michael, C. R. Hills, and M. J. Can-, “Analysis of SEM Electron Backscattered Kikuchi Patterns Using a CCD Detector and a Macintosh Computer”, Proc. 50th Annual Meeting of EMSA, pp. 1310 - 1311, (1992). [7] J. R. Michael and R. P. Goehner, “Crystallographic Phase Identification in the Scanning Electron Microscope: Backscattered Electron Kikuchi Patterns Imaged with a CCD-Based Detector”, MSA Bulletin ISSN: 1062-9785, Microscopy Society of America, Vol. 23(2), pp. 168-175, (1993). [8] J. R. Michael and R. P. Goehner, “Crystallographic Phase Identification In The Scanning Electron Microscope: Backscattered Electron Kikuchi Patterns”, Proceedings 5 1st Annual Meeting of the Microscopy Society of America, pp. 772-773, (1993). [9] J. R. Michael and R. P. Goehner, “Advances In Backscattered-Electron Kikuchi Patterns For Crystallographic Phase Identification”, Proc. 52nd Annual Meeting of the Microscopy Society of America, pp. 596 - 597, (1994). [lo] M.N Alam, M. Blackman and D.W. Pashley, High-angle Kikuchi Patterns, Proc. Roy. Sot. 221,224 (1954). [ 1 l] S. J. Wright and B.L. Adams, Automatic Analysis of Electron Backscattered Diffraction Patterns, Metall. Trans. A 23, 759 (1992). [12] R. P. Goehner and J. R. Michael, “Applied Crystallography In The SEM Using A CCD Detector”, Adv. in X-Ray Analysis, Vol. 38, pp.539-545, (1995). [ 131 J.R. Michael and R.P. Goehner, “Development Of Backscattered Electron Kikuchi Patterns For Phase Identification In The SEM”, Developments in Materials Characterization Technologies, ASM International, 1996, pp.63-70. [14] D.J. Dingley, “A Comparison of Diffraction Techniques for the SEM”, SEMI/ II, 383, (1981). [ 151 Powder Diffraction File (PDF), International Centre for Diffraction Data, 12 Campus Boulevard, Newton Square, PA
313