ISSN 1392–1320 MATERIALS SCIENCE (MEDŽIAGOTYRA). Vol. 14, No. 3. 2008
Sizing of Defects and Fatigue Behavior of Nitrided Nodular Cast Irons Radomila KONEČNÁ1∗, Viera KONSTANTOVÁ2, Gianni NICOLETTO3 1
Department of Material Engineering, University of Žilina, Univerzitná 1, Žilina, Slovak Republic Department of Design and Machine Elements, University of Žilina, Univerzitná 1, Žilina, Slovak Republic 3 Department of Industrial Engineering, University of Parma, Parma, Italy 2
Received 30 May 2008; accepted 29 June 2008 The paper presents and discusses the influence of structural characteristics such as content of effective ferrite, size of graphite particles and of microshrinkages on fatigue life of gas nitrided nodular cast irons (NCIs). A classical NCI melt and two synthetic melts obtained with addition of SiC to the liquid metal were produced. The surface of a NCI part may be modified for fatigue-critical applications by thermo-chemical surface treatments, such as nitriding with a corresponding increase of the fatigue limit. To quantify this increase, the rotating bending testing of smooth specimens was used because with this type of loading the material near the surface is subjected to the maximum stress. The quality of the nitrided layer, which has to be hard, elastic and compact, was controlled by measurement of the dynamical nanohardess according to Vickers. Results of fatigue behavior on the nitrided NCIs show a significant increase in fatigue limit and a different trend in the stress amplitude versus number of cycles to failure (S/N) curves in dependence of structural characteristics. Typically, fatigue endurance is reduced when the size of porosity increases. Therefore, the quality of the castings is related to porosity control. Optical microscopy was used to analyze the microstructure and defects of material after fatigue testing. The statistical method proposed by Murakami, based on the largest extreme value distribution (LEVD) was used to evaluate the porosity size population and to correlate with the fatigue data. Keywords: nodular cast iron, nitriding, microstructure, fatigue, defects.
1. INTRODUCTION ∗
NCIs. The optical microscopy was performed to analyze the microstructure and pores in the material after fatigue testing. The statistical method proposed by Murakami [5], based on the largest extreme value distribution was used to evaluate the porosity size population and establish a correlation with the fatigue data. Fracture surfaces were analyzed to determine places of the crack initiation and the fracture micromechanisms of nitrided specimens.
Nodular cast irons (NCI) combine the cost-effective casting technology with high fatigue strength [1] and it can be produced according to the classical or synthetic casting procedure, which is more economical because steel scrap is added to the charge instead of a part of pig iron [2]. Until recently ferrosilicon (FeSi) has been mainly used as an additive to the liquid metal to increase the Si content. In the present time, however, silicon carbide (SiC) is predominately used as addition because it increases not only the content of silicon but also the content of carbon [2, 3]. The surface characteristics of NCI may be modified for fatigue-critical applications by thermo-chemical surface treatments, such as nitriding. A surface exposed to a nitriding medium will generally form two distinct layers. The outside layer is called white layer and its thickness generally ranges between zero and 25 μm. Underneath the white layer, there is the diffusion zone and subdiffusion zone [4]. Nitriding is extensively adopted with ferrous materials because forms a hard and strong surface layer and a system of superficial compressive residual stresses. These two aspects result in an increase of the fatigue limit. For fatigue-critical application, the population of defects created in the casting process and the graphite nodule characteristics influence the fatigue behavior of NCI. Typically, fatigue endurance is reduced when the size of porosity increases. Therefore, the quality of the castings is related to the porosity control. The present work is aimed to identify the influence of different structural factors on fatigue lifetime of nitrided
2. EXPERIMENTS 2.1. Materials The following materials were used in the experiments: 1) a classical NCI melt (denominated melt B) with ferritic matrix, and 2) a synthetic melt of NCI (denominated melt C) produced with addition of SiC into the liquid metal, with different content of effective ferrite (EF, % volume of ferrite in the structure). The chemical composition of both melts was similar with approximately eutectic composition, i. e. Sc = 1.04 for the classical melt B, and Sc = 1.09 for the synthetic melt C.
2.2. Methodology Fatigue specimens were extracted from different industrial castings in the case of melt B and from 19 melted bars of melt C. Two sets of smooth cylindrical 6 mm in diameter fatigue specimens were prepared by machining. Then, one set of specimens of each material was subjected to a nitriding treatment. A Nitreg® patented controlled potential process was applied on specimens of melt B and an optimized gas nitriding treatment on specimens of melt C. Summary specifications of samples is indicated in Fig. 8.
∗
Corresponding author. Tel.: +421-41-513-2604; fax: +421-41-652-940. E-mail address:
[email protected] (R. Konečná)
215
The fatigue data for untreated and nitrided specimens were obtained on a rotating-bending testing machine operating at 50 Hz (i. e. load ratio R = –1). The fatigue limit σoc was determined according to a reduced staircase method [6] for melt B. For melts C only two stress amplitude levels were investigated to assess the trend of S/N curves. The structural analysis was performed on polished and etched specimen cross sections with the light metallographic microscope according to the standard STN 42 0461 and according to the methods of the image analysis program LUCIA Metallo 5.0 was applied to extensive and detailed measurement of porosity on no etched metallographic sections. To characterize pore size the Largest Extreme Value Determination (LEVD) proposed by Murakami [5] was used. The measurements are repeated n times (in n areas S0); in this case n = 30. The values A1/2max,j are classified, starting from the smallest and indexed with j = 1,…, n. The measurements of nanohardness DHV (dynamic hardness according to the Vickers) for 5 g load, from the surface down to the basic material were measured with a Nanoindentor Shimadzu DUH 202. The nitrided layer was analyzed using methods of color etching because a high chemical heterogeneity characterized this region. The energy dispersive spectroscopy (EDS) analysis was carried out on the polished crosssections from the nitrided layer on the surface to the basic material. The analysis of carbides found in the structure and the distribution of nitrogen in the nitrided layer (below the white layer) were performed with and EDS-equipped Philips XL 30 SEM; conditions were 15 kV and 100 s. Attention was finally given to the investigation of the fatigue fracture surfaces using the SEM on selected specimens. The fatigue initiation location and the mechanisms of stable crack propagation were sought. Nitrided specimens tested at the same stress level and showing very different fatigue lives were selected to identify possible sources of weakness.
a
b
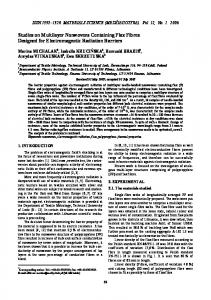
c Fig. 1. Microstructure of NCI, etched with 3 % nitric acid: a – melt B, 83 % of EF; b – specimen C16, 70 % of EF specimen C11; c – 45 % of EF
3. RESULTS AND DISCUSSIONS 3.1. Structural characterization The structure of melt B was characterized by ferritic matrix with a regular distribution of graphite nodules with size ranging from 15 μm to 60 μm, Fig. 1, a. A significant discontinuous network of carbides with microshrinkages on the boundaries of eutectic cells was observed, too. The structure of specimens taken from melt C was characterized by significantly different content of EF, Fig. 1, b, c. The EF content for specimens with almost fully ferritic matrix was from 86 % to 70 % (Fig. 1, b), for ferritic-pearlitic matrix from 69 % to 52 % and for pearlitic-ferritic matrix from 51 % to 41 % (Fig. 1, c). The graphite nodules were observed in fully or not fully globular shape predominately with size ranging from 30 µm to 60 µm and with small ratio of size ranging from 60 µm to 120 µm. In the matrix of melt B a number of inclusions were identified (Fig. 2), and they created more visible or less visible discontinuous network on the boundaries of eutectic cells in the dependence of castings from which the fatigue specimens were extracted. In the melt B, the inclusions
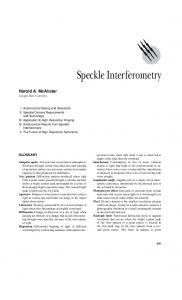
→ Intensity
a
→ Energy
b Fig. 2. Inclusions (a) and their EDS analysis (b)
216
investigated with EDS analysis (Fig. 2), are mainly carbides on the base of Ti, Cr and V. The presence of other chemical elements like Nb, Zr and Mo were identified too. Significant number of microshrinkages was also identified on the boundaries of eutectic cells and predominately near the carbides areas (Fig. 1 and Fig. 2). The EDS analysis confirmed an unusual high content of Mg, which, together with elements like Ce, La and Nd, favor the development of microshrinkage cavities. The presence of Mg in the microshrinkages is probably due to appropriate temperature of modification. Then the presence of discontinuous network of carbides was characteristic for specimens of melt B. The specimens with less visible discontinuous network of carbides (B3 and B7) had higher fatigue endurance compared to specimens with more visible discontinuous network of carbides (B4 and B9). The nitrided layer of classical and synthetic melts was formed by a thin white layer (WL) on the surface of specimens, diffusion zone (DZ) and subdiffusion zone (SDZ). The white layer was mostly continuous with variable thickness from 10 µm to 28 µm for melt B, respectively from 9 µm to 33 µm for melt C, in the dependence on the presence of the graphite particles. The thicker WL and DZ were identified in areas where graphite particles were present near the surface. In all specimens a thin dark layer, which is most probably a carbonitrided layer, on the surface of white layer was identified, when a high magnification was used, Fig. 4 and Fig. 5. The carbonitrided layer has analogous formation and properties of the nitrided layer. In case of nitriding of graphite cast iron, it is possible to compare the nitriding process to the carbonitriding, because of the high content of carbon. Nitriding process may not have always positive influence, mostly due to the chemical composition. Silicon decreases diffusion rate of nitrogen, therefore it is preferable to use materials with lower silicon content. On the other hand, chromium supports diffusion of nitrogen but its content must be limited because of the possibility of a negative effect on strength and ductility of the cast [2]. In DZ on the boundaries of ferrite grains after color etching segregated nitrides are visible, Fig. 5. The dark carbonitrided layer is also observed on the surface of WL. Short cracks initiated in the WL on the surface of specimen B4 etched with 3 % nitric acid were observed using polarized light, Fig. 6. The white layer in specimen B3 was without presence of cracks. The content of nitrogen in nitrided layer on the specimens B3 and B4 was investigated with EDS analysis. The content of nitrogen is decreasing with increasing distance from the surface of specimens. In the case of specimen B3 with higher fatigue endurance there is lover content of nitrogen compared to the specimen B4 with lover fatigue endurance. The nitrogen content shows a scatter for specimen B4, see Fig. 7. Local and higher measured content of nitrogen responses to coarsening of ferrite grain boundaries (see Fig. 3, corresponding indicated place 7). Therefore, from these local structural and chemical analyses it appears that the specimen B4, in comparison with specimen B3, has a non-uniform distribution of nitrogen with a high nitride concentration on the ferrite grain boundaries. Fatigue cracks can easily propagate with short fatigue life. Presence of nitrides on the boundaries of ferrite grains
Fig. 3. Structure of nitrided layer etched with 3 % nitric acid
Carbonitrided layer
White layer
Fig. 4. Detail of nitrided layer, etched with 3 % nitric acid
Fig. 5. Nitrides on the boundaries of ferrite grains, etched with Klemm I
Fig. 6. Microcracks in white layer, etched with 3% nitric acid, polarized light
217
increase the fatigue resistance. This increase is not maintained after nitriding. All nitrided data appear to distribute within a single scatter band. However, a difference in response appears not in terms of absolute stress levels rather on the slope of the S/N curves. This could be an indication that different micromechanisms are operative in the pearlite and ferrite after ntriding. This point, however, needs further verification.
a
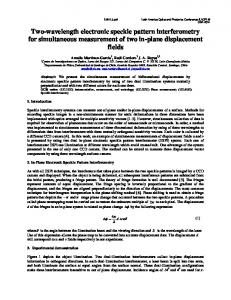
Fig. 8. Stress amplitude versus number of cycles to failure of specimens from melts B and C untreated and nitrided
3.4. Nanohardness DHV Vickers nanohardness profiles of nitrided layers are presented in Fig. 9 and 10.
b Fig. 7. EDS analysis in nitrided layer of melt B: a – content of nitrogen in nitrided layer; b – example of measurement
in diffusion zone was observed in all analyzed specimens, and for specimens with lover fatigue endurance a significant presence of nitrides was always observed.
3.3. Fatigue properties The fatigue data obtained on two different melts and in the as-cast and after nitriding conditions are now presented and discussed. In all cases the nitriding treatment is demonstrated to give a very significant improvement of the fatigue response, comparable of that observed in steels [1]. The increase in the fatigue strength associated to the nitriding treatment is due to the simultaneous formation of the hardened surface layer and of favorable compressive residual stresses. The stress amplitude versus number of cycles to failure (S/N) curves of the untreated and nitrided melt B are shown in Fig. 8. The fatigue limit is σoc = 169 MPa for untreated and σoc = 381 MPa for nitrided NCI. The data and the trend of S/N curves of melt C (Fig. 8) show higher number of cycles to failure for the same applied stress amplitude for untreated melt C because of the lower content of EF compared to the melt B. The fatigue data of untreated and nitrided specimens of melt C showed no significant dependence of number of cycles to the failure on content of EF within individual specimens. A direct comparison of the response of the different melts is presented in the Fig. 8. In the untreated condition, the reduction of the effective ferrite in the matrix tends to
Fig. 9. Nanohardnes DHV of melt B
Fig. 10. Nanohardnes DHV of melt C
218
The hardness decreases with distance from the surface, following the decreasing nitrogen diffusion in the diffused and subdiffused zone to the basic material in the case of both melts. The hardness profile characterizes the effectiveness of the nitriding treatment and is used to define an effective nitriding depth. The dependence of measured data in Fig. 9 shows high scatter for specimens with lower fatigue life (B4, B9) and it is possible to predict lower quality of nitrided layer responsible of lower fatigue life. In melt C specimens with longer fatigue life (C4, C13, Fig. 8) showed lower nanohardness without significant scatter. The fatigue life significantly depends on hardness of nitrided layer when an optimized hardness of nitrided layer is desirable.
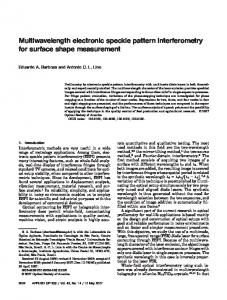
3.5. LEVD application to defects An extensive investigation was performed to find the influence of different structural factors on fatigue lifetime. The most important factors influencing fatigue life of NCIs are the content of EF, size of graphite nodules and size and shape of casting defects (microshrinkages). Many microshrinkages in the matrix were found in the structure of both melts of NCI and in the case of synthetic melt the microshrinkages were mainly found in pearlitic areas. The Murakami method based on the largest extreme value distribution (LEVD) was applied to characterize the population of largest casting pore size and largest graphite nodule size. The measured data in terms of the square root of the projected area A1/2max,j of the largest pore in different measurement windows were sorted and plotted in the LEVD plot shown in Fig. 11 and 12, where a linear trend is observed. The LEVD application measurements were performed on specimens of each melt tested at the same stress amplitude level and with a very different fatigue life (the same specimens as for nanohardness measurements). The specimen B3 with long fatigue life is characterized by smaller pore sizes, Fig. 11, compared to the specimen B4 with low number of cycles to failure Nf. The graphite nodules size shown in the same plot does not show a significant difference between both specimens of the melt B. However, the expected critical defect is a graphite nodule for B3 and microshrinkage for the B4. Since the pore of B4 is larger than the graphite nodule of B3, the fatigue life of B4 is expected to be shorter than that of B3, as verified experimentally. The specimens B7 and B9 were tested on two different stress amplitude levels. The specimen B7 showed longer fatigue life when higher stress amplitude was applied compared to the specimen B9, see Fig. 11. In this case the structure was characterized by smaller pore size than the specimen B9 with shorter Nf and lower stress amplitude. The graphite nodule size shown in the same plot is bigger for specimens B7 than for specimen B9. The specimens of melt C present results for two specimens of each group tested at the same stress amplitude. The specimen C13 with high fatigue life has relatively bigger pore sizes, Fig. 12, compared to the specimen C21 with short Nf. The specimen C4 with high fatigue life is characterized by small pore size, Fig. 12, compared to the specimen C17 low fatigue life. The graphite nodules size is nearly similar for both specimens of the melt C.
Fig. 11. Defect size dependence of selected specimens melt B
Fig. 12. Defect size dependence of selected specimens melt C
219
2) interface of the graphite particles and WL which did not cover graphite, or iii) cast defects situated below the white layer, Fig. 14, a. The initiated cracks propagated in two directions: the growth through the white layer to the surface of specimen was characterized by transcrystalline cleavage, and the fatigue cracks propagation into the material. In diffusion and subdiffusion zone cracks continued predominately by intercrystalline cleavage along ferrite grain boundaries, Fig. 14, and partly by formation of fine striations with more multiple localization in subdiffusion zone. For fatigue region is characterized the presence of striations, which supports plastic deformation mechanisms in ferrite. In the region of final static fracture of both untreated and nitrided specimens, the crack propagated by transcrystalline ductile fracture of ferrite with dimple morphology
3.6. Fractografic analysis Fatigue fracture analysis was performed on the same specimens as for LEVD analysis. In fatigue fracture surfaces in untreated and nitrided specimens of both analyzed NCIs, two different regions were found: i) the fatigue region and ii) the region of final static fracture, Fig. 13. Stable propagation of fatigue cracks occurs in the first light region, while the second dark one corresponds to unstable crack propagation to the fracture.
4. CONCLUSIONS a
1.
b
Fig. 13. Macrograph of fatigue fracture surface, mag. 3.5×, SEM: a – untreated; b – nitrided
2. 3. 4. 5.
Tests on smooth specimens of nitrided nodular cast irons demonstrated a significant increase in the long life fatigue strength after nitriding due to the formation of a hardened surface layer and a compressive residual stress system. Nitrided specimens with longer fatigue lives showed lower DHV profiles. The amount of effective ferrite and number of graphite particles do not show direct influence on fatigue behavior. The largest size of a defect, either pore or graphite nodule, influences the fatigue lifetime in addition to other structure characteristics. A correlation between the LEVD characterization of largest defects in materials and the fatigue performance is observed.
Acknowledgments
a
This work was done as a part of the SK/IT project No10/NT and a part of VEGA grant No.1/3194/06. It is also consistent with the objectives of MATMEC, an Emilia-Romagna regional net-lab (http://www.matmec.it/). REFERENCES 1.
2. 3. b 4.
Fig. 14. Fracture surface, SEM: a – nitrided layer and diffusion zone; b – diffusion zone with carbides
5.
Multiple initiations of fatigue cracks were associated to the presence of radial stairs on the fracture surface of both (classical and synthetic) types of NCIs in untreated and nitrided conditions. The cracks were initiated from different places: 1) the white layer with small microcracks,
6.
220
Davis, J. Cast Irons/Metallurgy and Properties of Ductile Cast Irons USA: ASM Specialty Handbook The Materials Information Society, 1996: 494 p. Karsay, S. I. Tvárna liatina I. Výroba. 1. vyd. Trenčín: Fompex, 1996: 198 s. (in Slovak). Konečná, R., Záhorová, B., Matejka, M. Vplyv prísady SiC na porušovanie tvárnej liatiny Materiálové inžinierstvo roč. 7, č. 4, 2000: s. 27 – 34 (in Slovak). Sinha, A. Physical Metallurgy Handbook. NY: McGrawHill, 2003: 1808 p. Murakami, Y. Metal Fatigue: Effect of Small Defects and Nonmetalic Inclusions. First Edition, ELSEVIER: 2002: 369 p. Bokůvka, O., Nicoletto, G., Kunz, L., Palček, P., Chalupová, M. Low & High Frequency Fatigue Testing. 1 ed., CETRA, Žilina, EDIS, 2002: 100 p.