Jul 3, 2009 - Carmen ANDRADE, Isabel MARTÃNEZ. 1 Institute of Construction Science âEduardo Torrojaâ, CSIC. Abstract. Corrosion of reinforcement is one ...
NDTCE’09, Non-Destructive Testing in Civil Engineering Nantes, France, June 30th – July 3rd, 2009
Embedded sensors for the monitoring of corrosion parameters in concrete structures Carmen ANDRADE, Isabel MARTÍNEZ 1
Institute of Construction Science “Eduardo Torroja”, CSIC.
Abstract Corrosion of reinforcement is one of the main durability problems of concrete structures. The corrosion induces several structural damages which affect the serviceability and the safety of concrete structures. The structural risk is promoting the possibility of embeded sensors which could give alerts in order to repair the structure before reaching dangerous levels of damage. There are an increasing number of concrete structures that are being monitored in order to control their durability. However almost no results of the interpretation of the values obtained can be found in the literature. The experience until now shows the difficulty of interpretation of the data collected due to the influence of temperature and moisture on them and how to use these data to predict future evolution of the process. About the corrosion parameters to be monitored and evaluated, corrosion potential, concrete resistivity and corrosion rate (measured by the polarization resistance method, Rp), seem to be the most useful parameters to be correlated with the environmental parameters for the characterization of the corrosion process. In this paper, several examples of on site records of the corrosion potential, concrete resistivity and corrosion rates are presented. The results obtained allow correlating corrosion and environmental parameters.
Résumé La corrosion des armatures est un des principaux problèmes de durabilité des structures en béton. La corrosion entraîne plusieurs endommagements structurels qui affectent le fonctionnement et la sécurité des structures. Le placement de capteurs électrochimiques de la corrosion dans le béton pourrait donner des alertes afin de réparer la structure avant d'atteindre des niveaux dangereux. Il existe un nombre croissant de structures en béton qui font l'objet d'un suivi afin de contrôler leur durabilité. Mais il y a très peu des résultats d'interprétation des valeurs obtenues publiés dans la littérature. L'expérience acquise jusqu'à présent montre la difficulté d'interprétation des données recueillies, en raison des variations induites par la température et l'humidité et aussi la difficulté d'utiliser ces données pour prédire l’évolution future du processus. En ce qui concerne la corrosion, les paramètres les plus importants à suivre et à évaluer sont : le potentiel de corrosion, le taux de corrosion, la résistivité du béton (mesurée par la méthode de la résistance de polarisation, Rp), ils semblent être les paramètres plus utiles à mettre en corrélation avec les paramètres de l'environnement pour la caractérisation des processus de corrosion. Dans cette présentation, plusieurs exemples de résultats de potentiel de corrosion, de résistivité et de vitesse de corrosion sont présentés. Les résultats obtenus permettent de corréler la corrosion et les paramètres environnementaux.
Keywords Electrochemical techniques, on-site values, linear polarization, corrosion rate.
NDTCE’09, Non-Destructive Testing in Civil Engineering Nantes, France, June 30th – July 3rd, 2009
1
Introduction
The corrosion in concrete structures is induced by two main factors: the carbonation of the concrete cover and the penetration of chlorides contained in the marine atmosphere or in chemicals in contact with concrete. The corrosion induces several structural damages which affect the serviceability and the safety of concrete structures. The structural risk is promoting the use of embed sensors which could give warning about the need for repair of the structure before reaching dangerous levels of damages. In consequence, sensors are installed now in several critical structures but the problem arises when interpreting the results because all corrosion parameters are affected by changes of temperature and moisture. About the corrosion parameters to be monitored and evaluated, corrosion potential, concrete resistivity and corrosion rate seems to be the most useful parameters to be correlated with the environmental parameters for the characterization of the corrosion process. In one hand because of its simplicity, the measurement of Ecorr (corrosion potential) is the method most frequently used in field determinations. However, such measurements have only a qualitative character, which may make data difficult to be interpreted. The same that said for the potential can be stated on Resistivity, ρ, measurements, which have a direct correlation with the moisture content in the concrete covering. In the other hand, the only electrochemical parameter with quantitative ability regarding the corrosion rate is the socalled Polarization Resistance, Rp, so, more complicated sensors and measurement systems are needed for the monitoring of this parameter. For the traditional Rp measurements as well as for the Ecorr measurement, an electrical contact with the embedded rebar is needed. In this way, and depending on the monitored structure, different sets of sensors have been designed. Each sensor implements the needed electrodes to carry out all the electrochemical and environmental parameters mentioned before. That is, each sensor has at least a reference electrode (for example Ti, Mn/MnO2 or Ag) and a stainless steel counter electrode for the corrosion rate and resistivity measurements. Temperature is measured by a thermocouple and in some cases, a water content sensor is also included. 2 2.1
Corrosion monitoring of real concrete structures Electrochemical techniques used
2.1.1 Corrosion Potential and resistivity measurements Because of its simplicity, the measurement of Ecorr (rest or corrosion potential) is the method most frequently used in field determinations. From these measurements, potential maps are drawn which reveal those zones that are most likely to undergo corrosion in the active state [5]. However, such measurements have only a qualitative character, which may make data difficult to be interpreted [6]. The same that was said about the potential can be stated about resistivity, ρ, measurements [7], which sometimes are used jointly with Ecorr mapping. The ρ values indicate the degree of moisture content of the concrete [8,9], which is related to the corrosion rate when the steel is actively corroding, but which may mislead the interpretation in passive conditions. 2.1.2 Polarization Resistance The only electrochemical parameter which would allow one to quantitatively determine the corrosion rate is the so-called Polarization Resistance, Rp [10]. The Rp measurement has been extensively used in the laboratory. It is based on the application of a small electrical perturbation to the metal by means of a counter and a reference electrode. Providing the
NDTCE’09, Non-Destructive Testing in Civil Engineering Nantes, France, June 30th – July 3rd, 2009
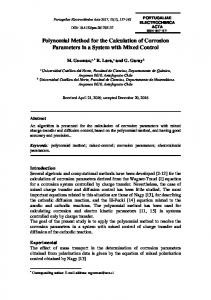
electrical signal is uniformly distributed throughout the reinforcement, the ∆E/∆I ratio defines Rp. The corrosion current, Icorr, is inversely proportional to Rp: Icorr= B/Rp 2 Where Rp is expressed in KΩ.cm and B is a constant resulting from a combination of the anodic and cathodic Tafel slopes. For concrete measurements the recommended value of B is 26mV. The standard units of Icorr are µA/cm2. The relatively high resistivity of the concrete result in too low Icorr values, if compensation of IR drop is neglected or not adequately performed. This is due to the fact that the calculated Rp is the sum of the resistance related to the corrosion process and the resistance associated with the electrolyte. The potentiostats to be used for Rp measurements have to be able to calculate the ohmic drop, or to compensate for its influence during the recording of the Rp measurement. Direct estimation of true Rp values from ∆E/∆I measurements is usually not feasible in large concrete structures. This is because the applied electric signal tends to vanish with distance from the counter electrode, CE, rather than spread uniformly across the working electrode, WE. Therefore, the polarization by the electric signal is not uniform, and it reaches a certain distance that is named the critical length, Lcrit. Hence, ∆E/∆I measurements on large structures using a small counter electrode provides an apparent polarization resistance (Rp ap) that differs from the true Rp value depending on the experimental conditions. Thus, if the metal is actively corroding, the current applied from a small CE located on the concrete surface is 'drained' very efficiently by the metal and it tends to confine itself on a small surface area. Conversely, if the metal is passive and Rp is high, the current applied tends to spread far away (e.g., around 50 cm) from the application point. Therefore, the apparent Rp approaches the true Rp for actively corroding reinforcement, but when the steel is passive, the large distance reached by the current needs a quantitative treatment. In this way, it is necessary to determinate the steel area affected by the electrochemical signal applied. Potential attenuation method A method based on the potential attenuation with the distance [12] has been developed in order to have a sensor of easier practical application for monitoring proposes. This method is based in the direct measurement of the critical length. The sensor is formed in this case, by a small disc acting as the only counter electrode which has in its center the reference electrode for the recording of Ecorr. Three other reference electrodes are placed aligned with the Ecorr sensor at fixed distances. For the measurement, a potentiostatic step, lasting between 15-60 seconds, is applied to the bar. This applied potential step attenuates with the distance as observed in Figure 1. From the distance (Lcrit) reached by the signal and certain geometrical considerations of the bars diameters, it is possible to calculate the true Rp (referred to a particular steel area). P o la riza tio n (mV )
12 0
Crit ica l le ngh t
10 0 80
NON C ORR ODING
60 40 CORRODIN G
20 0 0
50
10 0
15 0
20 0
Di sta n ce ( mm)
Figure 1. Potential attenuation with the distance in active and passive concrete structures
NDTCE’09, Non-Destructive Testing in Civil Engineering Nantes, France, June 30th – July 3rd, 2009
2.2
Embedded sensors used
The type of embedded sensors used can be observed in Figure 2. Each sensor has different reference electrodes (Ti, Mn/MnO2, Ag and Pb) and a stainless steel counter electrode for the corrosion rate and resistivity measurements. Temperature is measured by a termocouple. For the measurement of the potential attenuation, the sensor shown in Figure 2B is used. This type of sensors has been designed for being also installed over the concrete surface.
A)
2.3
B) Figure 2. A) Embedded sensors for electrochemical measurements installed in a dock in the south of Spain. B) Surface sensors installed inside a bridge. Structures monitored and results obtained
The structures whose results are presented are: 1) a bridge in the south part of Spain (the sensors installed are shown in Figure 2.B) 2) a loading platform in a harbor in the south of Spain (sensors of Figure 2) and 3) a pilot container for radioactive waste storage (structure shown in Figure 5). Electrochemical and non electrochemical measurements were made in the three structures installing a Geologger measurement system. The system has up to 50 available channels and can be pre-programmed activating an alarm system when the values overpass a predefined range. The bridge has a post-tensioned deck with a metallic girder. The concrete was contaminated with chlorides during mixing due to salt in the mixing water. Due to this contamination, corrosion started in the bridge from its casting. Sensors were installed in order to monitor 32 points near the four piles of the bridge. The results of some of the sensors are shown in Figure 3, in which temperature, corrosion potential, corrosion rate and resistivity parameters are monitored. It can be noticed that due to the presence of chloride in some parts of the bridge, corrosion rate values higher than 0.2 µA/cm2 are detected. The harbor structure was a hollow cube in a dock of around 30 m side. 14 groups of sensors were embedded at different dept, as Figure 4 shows. As could be expected in an underwater structure, in which the concrete pores are almost saturated with salt water, resistivity values are lower than 10KΩcm. Even when the resistivity is so low, the results show no corrosion, however, the values of Ecorr in this structure are not easy to interpret due to the saturated condition. Finally, a particular example of the use of embedded sensors is the case of storage facilities of low and medium radioactive wastes in El Cabril (Córdoba) [14]. There, a pilot reinforcement container has been instrumented from 1995 by embedding 27 set of electrodes. The parameters controlled are: temperature, concrete deformation, corrosion potential, resistivity, oxygen availability and corrosion rate. The impact of temperature on several of the parameters is remarkable, and therefore, care has to be taken when interpreting on-site results.
NDTCE’09, Non-Destructive Testing in Civil Engineering Nantes, France, June 30th – July 3rd, 2009
For measuring the corrosion potential and the corrosion rate, either the main rebar of the container or the sanded surface of the drums placed inside were used as working electrodes. Regarding the resistivity, it is measured by means of the current interruption method from a galvanostatic pulse. The oxygen flow at the rebar level is measured by applying a cathodic constant potential of about –750 mV(SCE) and measuring the current of reduction of oxygen. From the 27 groups of sensors installed, only less than 10% of them have failed. The rest show a good response even ten years after their installation. As an example, Figure 5 depicts the results obtained from one group of sensors placed in one wall of the concrete container (group 13). The reinforcement remains passive as expected (Icorr < 0.1µA/cm2). The recording during 10 years has enabled several deductions among which can be stressed that the temperature influences very much the responses of the sensors and that a progressive decrease of the amount of oxygen is detected without being this noticed by the values of the corrosion potential. The progression of hydration is well reflected by the electrical resistivity and the strains are very good detectors of the presence of water in liquid state. As an example among the 27 groups of sensors, Figure 6 shows the correlation between resistivity and temperature of Group 13, and how it changes with time. It is clear that this relation is different at temperatures below around 22 ºC and at higher temperatures.
TEMPERATURE PILLAR Nº 2
45
-350
35
-300
30 25
GROUP 9 GROUP 10 GROUP 11 GROUP 12 GROUP 13 GROUP 14 GROUP 15 GROUP 16
20 15 10 5
Ecorr (mV)
Temperature (ºC)
40
10
100
1 0,1 29-01-03
30-03-03
29-05-03 Date
-150
0 29-01-03
RESISTIVITY PILLAR Nº 2
10
-200
-50
GROUP 9 GROUP 10 GROUP 11 GROUP 12 GROUP 13 GROUP 14 GROUP 15 GROUP 16 28-07-03 26-09-03
Icorr ( µA/cm2)
1000
-250
-100
0 29-01-03 20-03-03 09-05-03 28-06-03 17-08-03 06-10-03 Date
ρ (KΩ cm)
CORROSION POTENTIAL PILLAR Nº 2
-400
GROUP 9 GROUP 10 GROUP 11 GROUP 12 GROUP 13 GROUP 14 GROUP 15 GROUP 16 30-03-03
29-05-03 Date
28-07-03
26-09-03
GROUP 9 GROUP 10 GROUP 11 GROUP 12 GROUP 13 GROUP 14 GROUP 15 GROUP 16
CORROSION RATE PILLAR Nº 2
1 0,1 0,01 0,001 29-01-03
30-03-03
29-05-03 Date
28-07-03
26-09-03
Figure 3. Results obtained through corrosion surface sensors installed inside a bridge.
NDTCE’09, Non-Destructive Testing in Civil Engineering Nantes, France, June 30th – July 3rd, 2009
Groups11, 12, 13 Y 14
25
SCE CORROSIONREF: POTENTIAL
GRUPO 13
GRUPO 14
GEOLOGGER
100
Ecorr (mV)
Tª (ºC)
GRUPO 13 GRUPO 12
300
20 15 10
-100 -300 -500
5 0 21-10-02
10-12-02
29-01-03
20-03-03
-700 10-12-02
09-05-03
29-01-03
GRUPO 11 GRUPO 13 GRUPO 12 GRUPO 14
RESISTIVIDAD
29-01-03
20-03-03
GRUPO 13 GRUPO 12
1 3 14
GRUPO 14
Icorr ( µA/cm2) 10-12-02
1
9 10
0,1
0,01
0,001 21-10-02
09-05-03
15 16 11 12
GRUPO 11
VELOCIDAD DE CORROSIÓN
CORROSION RATE
10
1
0,1 21-10-02
09-05-03
Date
RESISTIVIT Y
10
20-03-03 Fecha
Fecha Date
ρ (KΩ. cm)
GRUPO 11
POTENCIAL DE CORROSIÓN
GRUPO 11
TEMPERATURA
TEMPERATUR E
30
10-12-02
Fecha Date
29-01-03 Fecha
20-03-03
09-05-03
Date
Figure 4. Results obtained in the harbour situated in the south part of Spain X
Group- 13 – Reinforcement container 0
TEMPERATURE (ºC) 40
30 25 20 15 10 5 0 jun-94
0
350 300 250 200 150 100 50 0 -50 -100 -150 -200 -250 -300 jun-94
DEFORMATION (µ/m)
oct-95
mar-97
jul-98
dic-99 Tie m po
abr-01
sep-02
ene-04
may-05
1995
1996
-100
1997
1998
-150
1999
2000
2001
2002
2003
2004
- 50
Deformación (u/m)
Temperatura (ºC)
35
- 200
- 250
oct-95
mar-97
jul-98
dic-99
abr-01
sep-02
ene-04
may-05
Tie m po - 300
0
OXIGEN AVAILABILITY (µA/cm2)
5
10
15
20
25
30
35
40
CORROSION POTENTIAL (mv) T e m p e r a t u r a ( ºC )
0 -50
-50
-100
Oxígeno (uA/cm2)
-150
Ecorr (mV)
-100
-200 -250
-150
-300 -350
-200
-400
-250 -300 jun-94
200
-450
oct-95
mar-97
jul-98
dic-99 Tie m po
abr-01
sep-02
ene-04
-500 jun-94
may-05
oct-95
mar-97
jul-98
dic-99
abr-01
sep-02
ene-04
may-05
Tiem po
RESISTIVITY (KOhm.cm)
CORROSION RATE (µA/cm2)
0,1
160 140
Icorr (uA/cm2)
Resistividad (KOhm.cm)
180
120
0,01
100 80 60 40 20 0 jun-94
oct-95
mar-97
jul-98
dic-99 Tie m po
abr-01
sep-02
ene-04
may-05
0,001 jun-94
oct-95
mar-97
jul-98
dic-99 Tie m po
abr-01
sep-02
ene-04
may-05
Figure 5. Parameters registered on the concrete pilot container since 1995 to 2004. RESISTIVITY CORRELATION WITH TEMPERATURE MEASURED IN THE PILOT CONTAINER IN EL CABRIL Resistivity (KOhm.cm
60
GROUP 13 1995 1996 1997 1998 1999 2000 2001 2002 2003 2004
50 40 30 20 10 0 5
10
15
20 25 Tem peratura (ºC)
30
35
40
Figure 6. Correlation between resistivity and temperature measured in buried conditions
NDTCE’09, Non-Destructive Testing in Civil Engineering Nantes, France, June 30th – July 3rd, 2009
3
Conclusions
• The introduction of small sensors in the interior or at the surface of the concrete can be considered as one of the most promising development in order to monitor the long term behavior of concrete structures. • The three examples shown in present paper demonstrate that this monitoring is possible and presents different sensors and methods able to work in the alkaline concrete media for several years. • Even when parameters as corrosion potential or concrete resistivity are useful for the determination of the corrosion state of the structure, the corrosion process only can be quantify by the corrosion rate measurement, Icorr. • Due to the variation that Icorr presents in real structures exposed to the environment, it is necessary to establish a methodology to determine the representative value of the corrosion rate obtained in one structure.
Acknowledgements The authors thank the financial support from the Spanish Ministry of Education and Science under the CONSOLIDER SEDUREC of the program INGENIO 2010.
References 1. Andrade, C; Martinez, I; Castellote, M, Feasibility of determining corrosion rates by means of stray current-induced polarization. Journal of applied electrochemistry 38 (10):1467-1476 2008 2. Feliú S. González J.A. Feliú S. Jr Y Andrade C. “Confinement of electrical signal for insitu measurements of polarisation resistance in reinforcement concrete”. Mater. J. ACI, , 457-460. Septiembre y Octubre 1990 3. Rilem TC 154-EMC Recommendations, “Test methods for on-site corrosion rate measurement of steel reinforcement in concrete by means of the polarization resistance method, Materials and structures, vol 37, november 2004. 4. C. Andrade, I. Martínez, Calibration by gravimetrics losses of electrochemical corrosion rate measurement using modulated confinement of the current. Materials and Structures 38, november 2005, 833-841 5. ASTM C876-91. “Standard Test Method for Half Cell Potentials of Uncoated Reinforcing Steel n Concrete”. 6. Elsener, B and Bóhni, H. Corrosion Rates of Steel in Concrete, N.S. Berke, V.Chaker and D. Whiting (Eds.), ASTM STP 1065, pp. 143-156. (1990). 7. Millard, S.G. and Gowers, K.R., "Resistivity assessment of in-situ concrete: the influence of conductive and resistive surface layers", Proc. Inst. Civil Engrs. Struct. & Bldgs, 94, paper 9876, pp.389-396. (1992). 8. C. Andrade, J. Sarria and C. Alonso. “Relative humidity in the interior of concrete exposed to natural and artificial weathering” Cement and Concrete Research, Vol. 29, (1999), pp. 1249-1259 9. Andrade C., Alonso C. Sarría. J. “Corrosion rate evolution in concrete structures exposed to the atmosphere”. Cement and concrete composites 24, 55-64. 2002 10. Andrade, C. and Gónzalez, J.A., "Quantitative measurements of corrosion rate of reinforcing steels embedded in concrete using polarization resistance measurements", Werkst. Korros., 29, 515 (1978).
NDTCE’09, Non-Destructive Testing in Civil Engineering Nantes, France, June 30th – July 3rd, 2009
11. Feliú, S. , González, J.A., Feliú, S.Jr., and Andrade, C., "Confinement of the electrical signal or in-situ measurement of Polarization Resistance in Reinforced concrete," ACI Mater. J., 87, pp 457. (1990). 12. Feliú S., Gonzalez J.A., Andrade C., “Multiple-electrode method for estimating the polarization resistance in large structures”. Journal of applied electrochemistry 26. Pp 305-309. (1996). 13. Rodriguez, J., Ortega, L.M. García, A.M., Johansson, L. Petterson, K. “On-site corrosion rate measurements in concrete structures using a device developed under the Eureka Project EU-401-Int. Conference on Concrete Across Borders, Odense, Denmark, vol.I, pp.215-226. 14. C. Andrade, I. Martínez, M. Castellote, P. Zuloaga, Some principles of service life calculation of reinforcements and in situ corrosion monitoring by sensors in the radioactive waste containers of El Cabril disposal (Spain). Journal of Nuclear Materials. 358 (2006) 82-95