from a color edge detector than a gray scale edge detector. [1]â[3]. In a gray ..... life images by Cumani's method are either noisy or missing important edges.
IEEE TRANSACTIONS ON IMAGE PROCESSING
1
Standardization of Edge Magnitude in Color Images Sarif Kumar Naik and C. A. Murthy∗
Abstract— Edge detection is a useful task in low-level image processing. The efficiency of many image processing and computer vision tasks depends on the perfection of detecting meaningful edges. To get a meaningful edge, thresholding is almost inevitable in any edge detection algorithm. Many algorithms reported in the literature adopt ad hoc schemes for this purpose. These algorithms require the threshold values to be supplied and tuned by the user. There are many high-level tasks in computer vision which are to be performed without human intervention. Thus there is a need to develop a scheme where a single set of threshold values would give acceptable results for many color images. In the present work, an attempt has been made to device such an algorithm. Statistical variability of partial derivatives at each pixel is used to obtain standardized edge magnitude and is thresholded using two threshold values. The advantage of standardization is evident from the results obtained. Index Terms— Local standardization for thresholding, color edge detection, edge magnitude, thresholding, smoothing technique, adaptive choice of parameters, thresholding with hysteresis, non-maxima suppression.
I. I NTRODUCTION DGE detection has been a challenging problem in low level image processing. It becomes more challenging when color images are considered because of its multidimensional nature. Color images provide more information than gray scale images. Thus more edge information is expected from a color edge detector than a gray scale edge detector [1]–[3]. In a gray scale image, edges are detected by detecting the discontinuities in the image surface i.e. the discontinuities in the intensity of a sequence of pixels in a particular direction called gradient direction. The discontinuities in gray scale is easy to determine because gray values are partially ordered, but in a color image this freedom is not there. The simple difference between color vectors does not give the true distance between them. Sometimes it is difficult to detect a low intensity [2] edge between two regions in gray scale, but in color image, the clarity is more because, without being much different in intensity there can be a substantial difference in hue. It is observed by Novak et al. [1] that almost 90% of edge information in a color image can be found in the corresponding gray scale image. Though, this is not a significant ratio in favor of color edge detection, the remaining 10% can still be vital in certain computer vision tasks. Further, human perception of color picture is perceptually much richer than an achromatic picture [4]. One of the earliest color edge detectors is proposed by Navatia [4]. The image data is transformed to luminance Y and two chrominance components T1 and T2 and Huckel’s edge detector is used to find the edge map in each individual
E
Authors are with the Machine Intelligence Unit of Indian Statistical Institute, 203 B. T. Road, Kolkata - 700108, India. E-mail {sarif r, murthy}@isical.ac.in
component independently, except for the constraint of having the same orientation. Shiozaki [5] found entropy in each component using a local entropy operator and merged the three values for color edge detection. Machuca et al. [6] transformed the image from RGB to YIQ and detected edge in the hue plane. Fan et al. [3] proposed a method where they find edges in YUV space. Edge magnitude is found individually and thresholded in each component and merged. They proposed an entropy based method to automatically detect a threshold value for each component. This method is simple and may be faster in computation but produces less accurate results [7]. A multi-dimensional edge detection method using differential geometric approach was proposed by DiZenzo [8]. He considered the multi-images as a vector field and found the tensor gradient. Explicit formulas for the edge direction and magnitude in multi-spectral images are derived. He also shows that the earlier ways of finding edges by combining the output of difference operators in each component does not actually cooperate with one another. Cumani proposed an extension of the second-directional derivative approach to color images in [9]. He found the edge map by locating the zero crossings in image surface. Formulas for second order partial derivatives for finding zero crossings in multi-spectral images are derived. He defined the direction of maximal-contrast by the corresponding eigenvector of the largest eigenvalue of the 2 × 2 matrix formed from the outer product of the gradient vector in each component. Alshatti et al. [10] suggested a modification of the Cumani’s approach to solve the problem of sign ambiguities and to reduce computational time involved in the selection of maximal directional contrast. Later Cumani [11] proposed an efficient algorithm to get rid of this problem. The multi-dimensional gradient method is also used by Saber et al. [12] for edge linking in image segmentation. Some of the other related works can be found in [13]–[15]. Trahanias et al. [16] [17] proposed a class of edge detectors using vector order statistics. Three different ways of finding edge magnitudes using dispersion of color vectors from the median of the set of vectors in the neighborhood of a pixel are proposed. Toivanen et al. [18] have pointed out that R-ordering sometimes orders two different spectra into the same scalar value. They have proposed a different ordering method of multi-spectral image pixels. They further used self-organizing map(SOM) for this purpose. A class of directional vector operators are proposed to detect the location and orientation of edges in color images by Scharcansk et al. [19]. A comprehensive analysis of color edge detectors can be found in Zhu et al.’s [20] work. Ruzon et al. [21] have proposed an algorithm using compass operator. It considers a disc at each pixel location. The disc is divided into several pairs of opposite semi discs by rotating the diameter over 180 degrees with an interval of 15 degrees.
IEEE TRANSACTIONS ON IMAGE PROCESSING
The color distribution of the pixels in each such semi disc is found after doing vector quantization. The distance between to semi discs generated by a single diameter is the distance between their color distributions. The distance between two distributions is found using Earth Mover’s Distance (EMD). The edge magnitude at the pixel is the maximum distance among all the distances found between each pair of opposite semi discs created by rotating the diameter. Apart from the above mentioned works, there are some color edge detectors which are very specific in their objectives. Those are, color invariant edges by Geuserbroek et al. [22] and photometric quasi-invariant color edge detector [23], avoiding unnecessary edges due to specular reflection by Tsang et al. [24], reflection based color edge classification by Gevers [25] and Gevers et al. [26]. Various types of edge detection algorithms have been discussed above. All of them have their advantages and disadvantages. Some of these are pointed out here. The early approaches to color edge detectors, which are extensions of achromatic color edge detectors failed to extract certain crucial information conveyed by color [20]. R-ordering in certain cases orders two different spectra into the same scalar value, and as a result, can miss some parts of edges [18]. The edge detection approaches which simply add the gradient magnitudes of all the color components may fail to detect some crucial edge information in certain cases as described by DiZenzo in [8]. Thus though several color edge detection algorithms are proposed in the literature several open problems still exist. Most of the algorithms are concerned about finding the edge magnitude and direction. This is expected and also justified because the quality of edge map depends on these two quantities. But, none of the algorithms except the work by Fan et al. [3], addressed the selection of thresholding parameters, although, this is also an integral part in most of the algorithms. Edge detection algorithms discussed have reported good results when the values of the parameters involved are adjusted suitably. Though, most of these algorithms produce good results, generally, none of them is designed to give uniformly acceptable results for all kinds of images with a fixed set of parameter values. Thus, there is a need to devise a method which can give uniformly acceptable results with a single set of parameter values. In this article, this problem is addressed. The article is organized in the following way. Section II gives a brief idea of the mathematical foundation of the method. In Section III, results of the proposed method are compared with other methods. The article is concluded in Section IV with concluding remarks. II. T HEORETICAL F OUNDATION This section describes the mathematical methodology of the algorithm. The proposed method basically follows the philosophy stated in [27] by Rakesh et al. and uses a different technique for finding the initial edge magnitude and the direction. Rakesh et al. have found the estimated image surface using Priestly-Chao [28] kernel smoother. Priestly-Chao kernel
2
is used because, in statistics, it is a good estimator of a function when the independent variable is equally spaced which fits to the case of images as a function. Initial edge response and the direction of maximum contrast are found using the directional derivatives along x and y axis of the estimated image surface. Then non-maxima suppression is performed on the initial edge response. The standardized edge magnitude at the pixels which are not suppressed by non-maxima suppression are found using the variability of the estimated image surface and the directional derivatives. In the end a two level thresholding is performed on the standardized edge magnitudes. In the proposed method Priestly-Chao kernel smoother is used to estimated the images surface in each component of the of the color image separately i.e. m
f c (x, y) = where,
n
1 XX K(x, i)K(y, j)I c (i, j), ξ i=1 j=1
ξ = 2πmnh2 , Ψ(x) = e−x
2
/2
K(a, b) = Ψ ,
�
a−b h
(1) �
,
c = R, G, B.
I c (i, j) is the grey value at the (i, j)th pixel of the original image for the component c, h is the stiffness parameter, m and n are the number of rows and columns respectively. In the rest of the paper the super script indicates that the operation is done on the corresponding component or components. The directional derivatives along x and y direction of the estimated image surface are ) (m n X 1X c 0 c fx (x, y) = K (x, i)I (i, j) , (2) K(y, j) ξ j=1 i=1 fyc (x, y) =
1 ξ
m X
K(x, i)
n X
i=1
j=1
and K 0 (y, j)I c (i, j) ,
(3)
where K 0 (x, i) and K 0 (y, j) are the derivatives of K(x, i) and K(y, j) respectively. The estimate of data variability of the estimated image f c (i, j) is given by m
(σ c )2 =
n
1 XX c (I (i, j) − f c (i, j))2 mn i=1 j=1
(4)
The edge magnitude λ of f at a pixel (x, y) is given by the largest eigenvalue of the 2 × 2 matrix [9], [11] � � E F , (5) F G
and the direction of maximum contrast is given by the corresponding eigenvector. In the above expression E = fxR fxR + fxG fxG + fxB fxB , F = fxR fyR + fxG fyG + fxB fyB , G = fyR fyR + fyG fyG + fyB fyB . Having the information of edge magnitude (λ) and the direction of maximum contrast at each pixel, edge location
IEEE TRANSACTIONS ON IMAGE PROCESSING
can be found precisely by using non-maxima suppression [29]. The problem occurs in thresholding at the time of hysteresis. The edge magnitude found is generally not uniform for both low intensity and high intensity regions in an image. Thus, the edge detectors are unable to extract, simultaneously, all the edges in an image having edges of different intensities. They can not extract all the edges in different images with a fixed set of threshold values. To get those edges, threshold values have to be tuned carefully for individual images. To overcome this problem this article proposed a technique to obtain standardized edge magnitudes. The standardization of edge magnitude is done using the variability of the partial derivatives and estimated image surface. Let us define the derivative vectors for each components of the smooth image f at a pixel (x, y) to be v c = (fxc , fyc )T , and the statistic S(x, y) as X T −1 (v c ) (Σc ) (v c ), (6) S(x, y) =
3
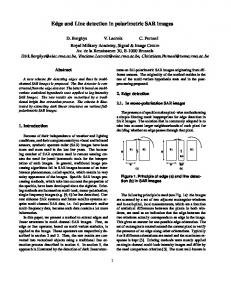
Fig. 1. Two rectangles images, each of size 128 × 128 : Image on the left say (a) has two horizontal edges in 43rd and 85th rows and one vertical edge in 66th column. Image on the right say (b) contains 2 vertical edges in 64th and 66th columns and 4 other horizontal edges
c=R,G,B
where
original edge profile 120 110
� c c σ11 (x, y) σ12 (x, y) , Σ = c c σ12 (x, y) σ22 (x, y) � c �2 X m X n σ c σ11 (x, y) = K 2 (y, j)K 02 (x, i), ξ i=1 j=1 � c �2 X m X n σ c K 2 (x, i)K 02 (y, j), σ22 (x, y) = ξ i=1 j=1 � c �2 X m X n σ c σ12 (x, y) = K(x, i)K(y, j)K 0 (x, i)K 0 (y, j). ξ i=1 j=1 c
�
In the above expressions c takes values R, G and B. S(x, y) is the standardized edge magnitude at a pixel (x, y). The value of S is used as the standardized edge response and is thresholded using two threshold values. Note that, it is not needed to estimate S for all the pixels in the image. S is estimated for those pixels which are not suppressed by nonmaxima suppression. Note: Note that a simple way of standardization of magnitude is to consider the inverse of dispersion matrices of respective colors and add the standardized magnitudes for each color, which has been done above. A more generalized linear model may have given rise to different expressions for standardized gradient magnitudes. A. Algorithm: Edge Detect(I) Input : I- RGB Image. Output : Edge - Binary Image. 1) Let h = 1.25 (stiffness of gaussian), Tu = 30(upper threshold) and Tl = 5 (lower threshold). 2) Find the directional derivatives fxR , fyR , fxG , fyG , fxB , and fyB from I as described in (2) and (3). 3) Find the initial edge magnitude (λ) and direction of maximum contrast (eigenvector corresponding to λ). 4) For each pixels (i, j), a) apply non-maxima suppression (as described in [27]). b) If it is not suppressed find S as in (6) .
100 90 80 70 60 50 40 30 20 10
(a) Original vertical bars image
Fig. 2.
2
4
6
8
10
12
14
16
18
20
(b) Original edge profile of the first 20 pixels of a row of the image in Fig. 2(a)
Original vertical bars image and its edge profile
c) If S > Tu Edge Class(i, j) = 2 (edge pixel) else if S > Tl Edge Class(i, j) = 1 (edge pixel if any of its 8-neighbors is an edge pixel) else Edge Class(i, j) = 0 (not an edge pixel) 5) Initialize an array Edge(i, j) of the size of the input image to zero. 6) For each pixel (i, j) if Edge Class(i, j) = 2 perform Track edge(i, j). This Track edge(i, j) algorithm is the one described in [27] by Rakesh et al. . III. R ESULTS AND C OMPARISONS A method has been proposed above to get standardized edge magnitudes at each pixel location and two level thresholding is performed on the standardized edge magnitudes to obtain the final edge map. This has been implemented on many artificially created images as well as natural color images. Four among these artificial images consisting of two rectangles images in Fig. 1, circles in Fig. 3(a) and vertical bars in Fig. 2(a) are considered. The vertical bars image is constructed by varying the intensity along the rows with fixed values of saturation and hue so that the edge profile is only due to the intensity. As the gray values in this image are periodic
IEEE TRANSACTIONS ON IMAGE PROCESSING
(a) Original circles image
(b) Edge map obtained using proposed method with the fixed set of parameter values
(c) Edge map in Fig. 3(b) is super imposed on the original image
Results on circles image
Proposed method obtains the standardized edge magnitude at the maxima of the initial edge response of the image. The variability of the directional derivatives of the estimated image surface is used to obtain the standardized edge magnitudes. To verify it in reality, the edge magnitudes of 42nd row of Fig. 1(a) and 64th column of Fig. 1(b) before and after the standardization are plotted in Fig. 5. From the plots of edge magnitudes in Fig. 5, it can be seen that the edge magnitudes are enhanced after standardization but the rate of enhancement is not uniform in both the cases. It can also be observed that the edge magnitudes before the standardization is in the range of 0 to 12 in one image and it is between 0 to 4 in the other image, whereas after standardization the edge magnitudes are enhanced and the corresponding values are in the range of 0 to 1400 for both the images. This shows that the procedure suggested here standardizes the edge magnitudes. This helps to obtain a stable set of parameter values for obtaining uniform 3 BSDB is available at http://www.cs.berkeley.edu/ projects/vision/grouping/segbench/ 1 Code used for this method is taken from http://www.ien.it/ ˜cumani/ 2 Code used for this method is taken from his web page http:// robotics.stanford.edu/˜ruzon/compass/
10 3 initital magnitudes
8 6 4 2 0
1
50 pixel no(row 42)
100
2
1
0 1
128
50 pixel no(column 64)
After standardization
128
1250
1250 1000 750 500 250 0 1
100
After standardization
Standardized magnitudes
A. Standardization of edge magnitude by proposed method
Before standardization
Before standardization 12
initital magnitudes
with the period of 10 pixels, the edge profile of only the first twenty pixels of a row are shown in Fig. 2(a). A total of 200 images from the “Berkeley Segmentation Dataset and Benchmark”(BSDB)3 and six other images are considered to observe the performance of the proposed method. Out of these 206 images, 20 images are considered to obtain the threshold values for the proposed method. Three among the 20 images are used for threshold analysis, namely Lenna [Fig. 4(a)], window [Fig. 4(b)] and balloon [Fig. 4(c)] are included here. Two different methods, one proposed by Cumani1 [9] and second proposed by Ruzon2 et al. [21], [30], have been considered for comparing the over all performance of the proposed method.
Standardized magnitudes
Fig. 3.
4
50 pixel no(row 42)
100
128
1000 750 500 250 0
1
20
40
60
80
100
128
pixel no(column 64)
Fig. 5. Plots shown in the left column is the edge magnitudes plots corresponding to the horizontal edge at 42nd row of Fig 1(a) and plots shown in the right column is the edge magnitudes plots corresponding to the vertical edge at 64th column of Fig. 1(b). The top and bottom rows of this figure show the edge magnitudes before and after the standardization respectively.
acceptable results for a wide variety of images. If we observe the edge profile of Fig. 1(b) before standardization (shown in the right side column of Fig. 5), the edge magnitudes between the two peaks are more than the edge magnitudes to the left of the left side peak and right of the right side peak. Actually, these edge magnitudes are due to the edge corresponding to the two green rectangles in the middle row of Fig. 1(b). But after standardization the middle edge magnitudes are less than both the right and left sides. This is happening because the variation of the color values in this region is more compared to the other two regions. B. Analysis of parameters for the proposed method The judgment of good performance on the obtained results is a matter of concern because there is no appropriate method
IEEE TRANSACTIONS ON IMAGE PROCESSING
(a) Lenna image ( 256 × 256 ) Fig. 4.
5
(b) Window image ( 256 × 256 )
Original Natural Images
to judge the quality with 100% confidence. Pratt’s Figure of Merit (FOM), which is used for comparing two edge detectors, needs the knowledge of the ground truth of the edge map. It is a quantitative evaluation procedure. Due to the difficulty of obtaining the ground truth of the edge map for natural images, quantitative method of judgement is ruled out and a qualitative method of judgement by visual evaluation is adopted. 1) Criteria of selection for a set of parameter values: The criteria of selection of a set of parameter values for a given image is that the resultant edge map should satisfy the following : • • •
(c) Balloon image ( 320 × 373 )
it should contain most of the prominent edges, it should not contain too many spurious edges and it should be visibly pleasing.
The selection of edge maps is based on a process of elimination among a set of edge maps obtained using different parameter values. The elimination of an edge map has been done visually. 2) Selection of parameter values: The proposed method takes h the stiffness of gaussian, and two threshold values Tl and Tu as input parameters. Tl and Tu are the lower and upper threshold values respectively. To find a set of parameter values, several edge maps are generated for each image by varying the parameter h between 0.8 and 2 with an increment of 0.05, T l between 0 and 10 with an increment of 1 and Tu between 5 to 50 with an increment of 1 subject to the condition that Tu is always greater than Tl . There are several ways to obtain a fixed set of parameter values. A simple way is to examine the edge maps for a set of images and take that set of values which is producing acceptable edge maps for all the images in the set. When such an experiment is performed on the 20 considered images for threshold selection, the proposed method produced acceptable results with h = 1.25, Tl = 5, and Th = 30.
3) Some of the results using proposed method: From the results on circles image [Fig. 3(c)] it can be seen that the proposed method has detected the boundaries of the discs in proper places. In the vertical bars image, ideally, there should be only two edge locations one at 4th pixel and another at 10th pixels [Fig. 2(b)] and there should not be any edge between 6th and 10th pixel because the transition of intensity between these pixels is very smooth compared to the transition in intensity between 4th and 5th pixels and 10th and 11th pixels. Proposed method has found the edges at these two locations i.e. at 4th and 10th pixels [Fig. 9(a)]. The results of applying the proposed method with the fixed set of parameter values (h = 1.25, Tl = 5, and Th = 30) on Lenna, window and balloon images are shown in Figs. 6(a), 7(a) and 8(a) respectively. C. Analysis of parameters for Ruzon et al.’s method Ruzon et al.’s method takes stiffness of gaussian R, and two threshold values low and high as input parameters. For judging the performance of the algorithm, several edge maps are generated by varying R between 0.8 to 3 with an increment of 0.1, low between 0.0 to 0.60 with an increment of 0.01 and high between 0.1 to 0.60 with an increment of 0.1 subject to the condition that high > low. Results on the circles image over a wide range of parameter values are found to be appropriate, thus no figure is included here. When the vertical bars image [Fig. 2(a)] is considered, one extra edge is detected [Fig. 9(a)] between the 5th and the 10th pixels in reference to Fig. 2(b) for the parameter values h = 1.5, 0 ≤ low < high and 0 ≤ high < 0.46. Ideally, there should not be any edge between these two pixels because the transition of intensity between these two pixels is very smooth which can be seen from Fig. 2(b). The correct edge map is obtained with high = 0.46 and above with h = 1.5 and 0 ≤ low ≤ high. But results on balloon and window
IEEE TRANSACTIONS ON IMAGE PROCESSING
(a) Proposed method with h = 1.25, Tl = 5, Tu = 30 Fig. 6.
(b) Cumani’s method with σ = 1.5, T = 15
(c) Ruzon et al.’s method R = 1.5, low = 0.1, high = 0.30
(b) Cumani’s method with σ = 1.5, T = 15
(c) Ruzon et al.’s method R = 1.5, low = 0.1, high = 0.30
Results on Lenna Image.
(a) Proposed method with h = 1.25, Tl = 5, Tu = 30 Fig. 7.
6
Results on window image.
images with the same parameter values h = 1.5, low = 0.1 and high = 0.46 are found to be unsatisfactory since many prominent edge are missing [Figs. 10 and 11]. It is also found that when high > 0.46, some more edges are missing in window and balloon images. The results have not been shown here due to lake of space. Thus, from these above observations, it is apparent that there does not exist a fixed set of parameter values in case of Ruzon et al.’s method providing acceptable results in all cases. We made a subjective evaluation of the edge maps of the 20 natural images under consideration to obtain a fixed set of threshold values for Ruzon et al.’s method. It may be noted that a compromise is made in the quality of results for the selection of the parameter values. It is also to be noted that the selected set of parameter values can be different for different persons. The best fixed set of parameter values for Ruzon et
al.’s method is found to be R = 1.5, low = 0.1 and high = 0.3. D. Analysis of parameters for Cumani’s method Cumani’s method takes stiffness of gaussian σ and a threshold value T as input parameters. For this method the edge maps with 0.8 ≤ σ ≤ 3 with an increment of 0.1 and 0 ≤ T ≤ 50 with an increment of 1 are observed to select the edge maps. Results on the artificial images over a wide range of parameter values using Cumani’s method are found to be appropriate. Thus no edge maps using this method on artificial images are included here. But results on many real life images by Cumani’s method are either noisy or missing important edges. This can be seen from the results on Lenna image [Fig. 6(b)]. There are many spurious edges present and at the same time many edges are disconnected. In particular
IEEE TRANSACTIONS ON IMAGE PROCESSING
(a) Proposed method with h = 1.25, Tl = 5, Tu = 30 Fig. 8.
(b) Cumani’s method with σ = 1.5, T = 15
(c) Ruzon et al.’s method R = 1.5, low = 0.1, high = 0.30
Results on balloon image.
(a) Proposed method with h = 1.25, Tl = 5 and Tu = 30
Fig. 9.
7
(b) Ruzon et al.’s method with R = 1.5, 0 < low < high, 0 < high < 0.46
Results on vertical bars image
the upper boundary of the hat is disconnected. To get these edges connected, T has to be decreased. With the decrease in the value of T more spurious edges will be introduced. When the threshold value is increased many important edges would be lost. These results are not shown here due to lake of space. Similar phenomenon is found with the window image [Fig. 7(b)] and balloon image [Fig. 8(b)]. IV. C ONCLUSIONS , D ISCUSSION AND F UTURE WORKS The proposed method along with the other two methods have been compared on several images. It is found that the proposed method consistently produces acceptable results for all the images. It is difficult to get a single fixed set of parameter values which would give a visibly pleasing edge maps containing most of the prominent edges in the case of Ruzon et al. and Cumani’s methods.
Fig. 10. Result using Ruzon et al.’s method on balloon image shown in Fig. 4(c) with R = 1.5, low = 0.1, high = 0.46
In the proposed method, the two fixed threshold values Tl = 5 and Tu = 30 have been used for detecting edges on more than 200 natural and artificial images. It is evident from the obtained results that the algorithm is producing results containing most of the important edges for all the images with these two threshold values. An intuitive reason for producing acceptable results is that it increases the edge response of all the detected edge pixels but not necessarily uniformly. This can be observed from two artificial images shown in Fig. 1 and from their edge profiles shown in Fig. 5. In terms of computational complexity the proposed method is slower than Cumani’s method but much faster than Ruzon et al.’s method. The main advantage of this algorithm is that the parameters
IEEE TRANSACTIONS ON IMAGE PROCESSING
Fig. 11. Result using Ruzon et al.’s method on window image shown in Fig. 4(b) with R = 1.5, low = 0.1 and high = 0.46
do not need any fine tuning for getting acceptable results for an image. Thus, the proposed algorithm may be handy for any computer vision task where extraction of edge maps is required for a large set of images for feature extraction or for any other work. In the above presented method, basically, a linear model with fixed effects is assumed. The performance of the edge detector may possibly be better if a generalized method is assumed considering the correlations between channels, though, the statistical analysis may be complicated. Probably, a similar experimentation for finding the performance of color edge detector, such as a work by Heath et al. [31], is needed to be done. R EFERENCES [1] C. L. Novak and S. A. Shafer, “Color edge detection,” in Proc. DARPA image Understanding Workshop, 1987, pp. 35–37. [2] A. Koschan, “A comparative study on color edge detection,” in Proc. 2nd Asian Conference on Computer Vision ACCV’95, vol. III, Singapore, 1995, pp. 574–578. [3] J. Fan, W. G. Aref, M. S. Hacid, and A. K. Elmagarmid, “An improved automatic isotropic color edge detection technique,” Patt. Recog. Lett., vol. 22, no. 13, pp. 1419–1429, Nov. 2001. [4] R. Nevatia, “A color edge detector and its use in scene segmentation,” IEEE Trans. Syst., Man, Cybern., vol. 7, no. 11, pp. 820–826, Nov. 1977. [5] A. Shiozaki, “Edge extraction using entropy operator,” Computer Vis., Graphics, and Image Processing, vol. 36, no. 1, pp. 1–9, Oct. 1986. [6] R. Machuca and K. Phillips, “Applications of vector fields to image processing,” IEEE Trans. Pattern Anal. Machine Intell., vol. 5, no. 3, pp. 316–329, May 1983. [7] J. Fan, D. K., Y. Yau, A. K. Elmagarmid, and A. W. G., “Automatic image segmentation by integrating color-edge extraction and seeded region growing,” IEEE Trans. Image Processing, vol. 10, no. 10, pp. 1454–1466, Oct. 2001. [8] S. Di Zenzo, “A note on the gradient of a multi-image,” Computer Vis., Graphics, and Image Processing, vol. 33, no. 1, pp. 116–125, Jan. 1986. [9] A. Cumani, “Edge detection in multispectral images,” CVGIP: Graphical Models and Image Processing, vol. 53, no. 1, pp. 40–51, Jan. 1991. [10] W. Alshatti and P. Lambert, “Using eigenvectors of a vector field for deriving a second directional derivative operator for color images,” in Proc. 5th Int. Conf. Comp. Analysis of Images and Patterns CAIP’93, 1993, pp. 149–156. [11] A. Cumani, “Efficient contour extraction in color images,” in Proc. of the Asian Conference on Computer Vision, 1998. [12] E. Saber, A. M. Tekalp, and G. Bozdagi, “Fusion of color and edge information for improved segmentation and edge linking,” Image and Vision Computing., vol. 15, no. 10, pp. 769–780, Oct. 1997.
8
[13] P. M. Djuric and J. K. Fwu, “On the detection of edges in vector images,” IEEE Trans. Image Processing, vol. 6, no. 11, pp. 1595–1601, Nov. 1997. [14] G. Robinson, “Color edge detection,” J. of Opt. Engg., vol. 16, no. 5, pp. 479–484, Sept./Oct. 1977. [15] R. Krishnamoorthi and P. Bhattacharya, “Color edge extraction using orthogonal polynomial based zero crossing scheme,” Information Sciences, vol. 112, no. 1-4, pp. 51–65, Dec. 1998. [16] P. E. Trahanias and A. N. Venetsanopoulos, “Vector order statistics operators as color edge detectors,” IEEE Trans. Syst., Man, Cybern. B, vol. 26, no. 1, pp. 135–143, Feb. 1996. [17] ——, “Color edge detection using vector order statistics,” IEEE Trans. Image Processing, vol. 2, no. 2, pp. 259–264, Feb. 1993. [18] P. Toivanen, J. Ansamki, J. P. S. Parkkinen, and J. Mielikinen, “Edge detection in multispectral images using the self-organizing map,” Patt. Recog. Lett., vol. 24, no. 16, pp. 2987–2994, Dec. 2003. [19] J. Scharcanski and A. N. Venetsanopoulos, “Edge-detection of color images using directional operators,” IEEE Trans. Circuits Syst. Video Technol., vol. 7, no. 2, pp. 397–401, Apr. 1997. [20] S.-Y. Zhu, K. N. Plataniotis, and A. N. Venetsanopoulos, “Comprehensive analysis of edge detection in color image processing,” Opt. Engg., vol. 38, no. 4, pp. 612–625, Apr. 1999. [21] M. A. Ruzon and C. Tomasi, “Edge, junction, and corner detection using color distributions,” IEEE Trans. Pattern Anal. Machine Intell., vol. 23, no. 11, pp. 1281–1295, Nov. 2001. [22] J.-M. Geusebroek, A. Dev, R. van den Boomgaard, A. W. M. Smeulders, F. Cornelissen, and H. Geerts, “Color invariant edge detection,” in Scale-Space Theories in Computer Vision, 1999, pp. 459–464. [Online]. Available: citeseer.nj.nec.com/geusebroek99color.html [23] J. van de Weijer, T. Gevers, and J. M. Geusebroek, “Color edge detection by photometric quasi-invariants,” in Proc. of Ninth ICCV, University of Amsterdam, Oct. 2003, pp. 1520–1525. [24] W. H. Tsang and P. W. M. Tsang, “Suppression of false edge-detection due to specular reflection in color images,” Patt. Recog. Lett., vol. 18, no. 2, pp. 165–171, Feb. 1997. [25] T. Gevers, “Reflectance-based classification of color edges,” in Proc. of Ninth ICCV, University of Amsterdam, Oct. 2003, pp. 856–861. [26] T. Gevers and H. M. G. Stokman, “Classifying color transitions into shadow-geometry, illumination highlight or material edges,” in Proc. of ICIP, 2000, pp. 521–525. [27] R. R. Rakesh, P. Chaudhuri, and C. A. Murthy, “Thresholding in edge detection : A statistical approach,” IEEE Trans. Image Processing, vol. 13, no. 7, pp. 927–936, July 2004. [28] M. B. Priestly and M. T. Chao, “Non-parametric function fitting.” Journal of Royal Statistical Society, vol. ser B3, no. 4, pp. 384–392, 1972. [29] J. F. Canny, “A computational approach to edge detection,” IEEE Trans. Pattern Anal. Machine Intell., vol. 8, no. 6, pp. 679–698, Nov. 1986. [30] M. A. Ruzon and C. Tomasi, “Color edge detection with compass operator,” in Proc. of IEEE Conf. on Computer Vis. and Patt. Recog.’99, vol. 2, June 1999, pp. 160–166. [31] M. Heath, S. Sarkar, T. Sanocki, and K. W. Bowyer, “A robust visual method for accessing the relative performance of edge-detection algorithms,” IEEE Trans. Pattern Anal. Machine Intell., vol. 19, no. 12, pp. 1338–1359, Dec. 1997.