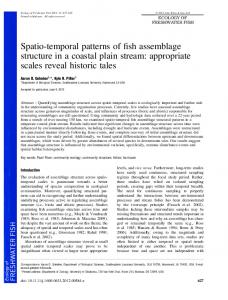
Physica A 387 (2008) 3271–3280 www.elsevier.com/locate/physa
Emergence of spatio-temporal patterns in forest-fire sequences Devis Tuia a,∗ , Rosa Lasaponara b , Luciano Telesca b , Mikhail Kanevski a a Institute of Geomatics and Analysis of Risk (IGAR), University of Lausanne, CH-1015 Lausanne, Switzerland b Institute of Methodologies for Environmental Analysis, C.da S.Loja, 85050 Tito (PZ), Italy
Received 19 September 2007 Available online 16 January 2008
Abstract Temporal variation of spatial clustering in fire data recorded from 1997 to 2003 in Tuscany region, central Italy, has been investigated using the Vorono¨ı polygon area, the Morishita index and the fractal dimension. Our findings reveal that the spatial clustering of fire events changes with time, showing an enhancement of the clustering degree before the largest events. c 2008 Elsevier B.V. All rights reserved.
PACS: 05.45.Df; 05.45.Tp Keywords: Spatial clustering; Space-time analysis; Fractal dimension; Morisita index; Vorono¨ı tessellation; Forest fires
1. Introduction Forest fires can be represented by stochastic point processes, where each event is identified by its spatial location, occurrence time and size of burned area. The self-organized criticality (SOC) [1], which explains the complex spacetime behaviour of many natural phenomena, has been used to describe fire spatio-temporal dynamics [2]. A natural system governed by SOC dynamics is characterized by spatial clustering, “1/f-noise” and power-law frequency-size distribution. The existing forest-fire literature has mainly focused: (i) on the problem of the frequency-area distribution, stimulating deep debates about the existence of power laws in the frequency-size distribution [3]; (ii) on the time-clustering behaviour in fire sequences, revealed by power-law relationships in the statistics used to describe their temporal distribution [4]. Spatial clustering is another fingerprint of a SOC phenomenon. Recently, Tuia et al. [5] have revealed the existence of clustering in the spatial distribution of fire sequences using three different indices. The present study aims to investigate the temporal evolution of the spatial clustering in fire sequences. This knowledge can be very useful in order to detect the presence of overdensity of fire events in particular time periods, where prevention efforts and resource allocation should be primarily accomplished. ∗ Corresponding author. Tel.: +41 21 692 35 38; fax: +41 21 692 35 35.
E-mail address:
[email protected] (D. Tuia). URL: http://www.unil.ch/igar (D. Tuia). c 2008 Elsevier B.V. All rights reserved. 0378-4371/$ - see front matter doi:10.1016/j.physa.2008.01.057
3272
D. Tuia et al. / Physica A 387 (2008) 3271–3280
In Section 2, several measures of spatial clustering are discussed. Section 3 presents the data and the approach chosen to perform the spatio-temporal analysis that takes place in Section 4. 2. Measures of spatial clustering Spatial clustering can be measured using several measures, as discussed in the literature [6]. In this contribution, four measures of spatial clustering are considered: the area of the Vorono¨ı polygons generated by the events (topological), the Morisita index (statistical) and two measures of the fractal dimension (dimensional). 2.1. Vorono¨ı polygons area The Vorono¨ı polygons [7] of a region are a partition of the original space, where every polygon defines the region of the original space closest to the event contained in the polygon. Distribution of the areas of these polygons can be used as a topological measure of spatial clustering [8]. Homogeneous sets follow approximatively Gaussian distribution centred on the mean polygon area. Clustered sets distributions are skewed to the right, showing the appearance of several small polygons in clustered regions. Clustered point processes are also characterized by the appearance of extreme values in the distribution: these large polygons correspond to the empty areas of the original space. In Ref. [5] a forest-fires sequence was compared to a homogeneous distribution of the same number of events, but observations had been led qualitatively only. In this contribution, a quantitative measure of departure from homogeneity is computed by using the Kullback–Leibler (KL) divergence (also called relative entropy) [9], an entropy-based measure to estimate the departure of an observed distribution f from a reference distribution f 0 : ! X fi 0 K( f k f ) = − . (1) f i ln f i0 i A similar measure has been used previously to quantify clustering using volumes of Vorono¨ı polygons for threedimensional seismic series [10]. In this study, we define the observed distribution f as the observed frequencies of the events’ Vorono¨ı tessellation and the reference distribution f 0 as the frequencies observed in an artificial case (characterized by the same number of events) where the events are homogeneously distributed in space. 2.2. Morisita index The Morisita index [11] is a statistical index of spatial concentration of events. In the literature, this index is widely used to estimate the level of clustering of point processes in analysis of, for instance, ecological species, earthquakes or forest-fire sequences [5,12]. The index is calculated as follows: the region of study is subdivided into Q cells of equal size s and for every single cell i, the number of events falling within the cell (n i ) are counted. After iteration for all the Q cells, the index Is is computed following equation: P n i (n i − 1) i Is = Q (2) N (N − 1) where N is the total number of events. The index is computed for a set of scales s, giving a size-dependent measure. A homogeneous repartition of events results in a Morisita index of about 1 at every scale (or 0 if the logarithm is considered). Clustering of events results in higher values of the index (especially for small cell sizes), related to the concentration of events in a small number of cells and to the apparition of empty cells. The highest value of the index is met when all the events are concentrated within one cell of the system: in that case, the Morisita index for a give scale is equal to Q. A particular case is given by the largest scale, where the whole region is covered by just one cell: this scale is always characterized by a value of 1 (resp. 0 for log(I )), corresponding to homogeneity. 2.3. Fractal dimension Fractal dimension is widely used to measure spatial clustering of point processes. Fractals are self-similar objects that reproduce their structures throughout the scales: by this fact their structure is often fragmented and results in
D. Tuia et al. / Physica A 387 (2008) 3271–3280
3273
clustered regions. Lovejoy, Schertzer and Ladoy used this interesting property of fractals sets to describe spatial clustering of point processes [13]: a homogeneously distributed point process in E-dimensional space (E being, more often, 2 or 3) is associated to a fractal dimension of (or close to) E, because an homogeneous distribution does not allow the apparition of cluster and of self-similar structures. But a clustered set is always associated with the apparition of heterogeneities at different scales of the E-dimensional space, i.e. the repetition of the configuration of points throughout the scales, and results in fractal dimensions d f < E. Fractal dimension for description of spatial clustering has been applied in several fields, going from radioactivity to earthquakes or forest-fires sequences [5,14]. Several methods exist to quantify the fractal dimension of a set. In this contribution, we apply two measures, which are complementary in terms of interpretation: the box-counting method [15] and the sandbox method [16]. 2.3.1. The box-counting method The box-counting method consists, similarly to the Morishita index, of covering the region under study with Q non-overlapping cells and to count, for a defined set of scales, the number of cells occupied by at least one event. Between the number of occupied cells qs and their size s a power relationship is then established qs ≈ s −d fBOX
(3)
where d f BOX is the fractal dimension obtained with the box-counting method and can be computed as the slope of a linear regression between log(qs ) and log(s). The box-counting fractal dimension analyses the degree of spatial covering of the two-dimensional space of the point process. A regularly distributed point process will be associated to a dimension of exactly E. 2.3.2. The sandbox method The sandbox method focuses on local densities of events: for every event, the number of neighbouring events (within a circle of radius R) is counted. The length of R is increased iteratively and a power law between the radius and the mean number of neighbouring samples is defined as follows: n¯ i ≈ R d fSAND
(4)
where d f SAND is the fractal dimension obtained with the sandbox method and can be computed as the slope of a linear regression between log(n¯ i ) and log(R). The sandbox fractal dimension measures the degrees of local clustering of the events. If events are concentrated in a particular region, the mean number of neighbours for small radius and the fractal dimension will increase. The sandbox fractal dimension is less sensible to the global covering of the space than the box-counting dimension, whose value depends strictly on the covering of the E-dimensional space. The sandbox fractal dimension never reaches the value of E, because, when measured on the peripheral events, even a homogeneous point process will be associated with a lower-than-expected number of neighbours proportional to the size of the circles, therefore resulting into a lower associated fractal dimension. 3. Dataset and methods The investigated data set concerns the fires recorded from 1997 to 2003 in one of the most vulnerable areas in central Italy, the Tuscany Region (central Italy). The total length of the series is given by 3700 events. The data have been provided by the forest-fire fighting service in Italy (www.corpoforestale.it). Fig. 1 shows the spatial distribution of the fires in the investigated area. In order to analyse the time variation of the spatial clustering indices, a sliding window, shifting through the whole data set, has been used. The sliding window can have a fixed time length or a fixed number of events; in this paper we selected a moving window with fixed number of events, to assure the independence of the calculated values of the indices from the number of data in each window. Each calculated value of the indices has been associated to the occurrence day of the last event in the window.1 The window size has been set to 500 events in order to have a sufficient number of data to perform the analysis, and the shift has been set to 10 events in order to have a sufficiently good smoothing among the values. 1 Day numbering corresponds to Julian day number starting from the 1st January 1997.
3274
D. Tuia et al. / Physica A 387 (2008) 3271–3280
Fig. 1. Spatial distribution of the fire data in Toscana region.
4. Results and discussion 4.1. The indices for the first moving window Figs. 2–4 show, as an example, the application of methods presented to the first subset of 500 events. The Vorono¨ı covering shows different spatial concentrations of points, indicated by the different distribution of surfaces of the polygons (Fig. 2). In order to compare the curve obtained with the situation of spatial randomness, a second curve has been calculated by generating a randomly spatially distributed series of 500 fires over the regional boundaries of Tuscany. The differences between the two curves are clear, and indicate that the real data are clustered. Fig. 3 shows the Morisita index, varying the size of the cell or spatial scale. The log of the index is well above the zero value, for all the considered spatial scales, and this is a clear fingerprint of spatial clustering in the data set. The analysis of the fractal dimension using the box-counting method is shown in left side of Fig. 4: the estimate of d f BOX ≈ 1.2 has been performed considering only the scales, where the behaviour of the curve is linear (4 < log(s) < 4.9 in the figure). Right side of Fig. 4 shows the mean number of neighbouring events as a function of R and plotted in log-log scales, in order to estimate the fractal dimension using the sandbox method. The distribution of events is clustered with d f SAND ≈ 1.5. As a comparison, the curve obtained with a random dataset is also provided. The comparison with the curves obtained for a randomly generated dataset shows the departure from the situation of spatial randomness.
D. Tuia et al. / Physica A 387 (2008) 3271–3280
3275
Fig. 2. (left) Vorono¨ı polygon covering for the first subset of 500 events; (right) Distribution of areas of the polygons (squares) and comparison with results for a homogeneous distributions (circles).
Fig. 3. Morishita index for the first subset of 500 events in Toscana.
4.2. Time-dependent analysis Figs. 5–7 show the indices for the moving window spatio-temporal analysis. All the indices agree in detecting a period of high clustering around day 2350 (ending in March 2002). This peak corresponds to the main cluster found in spatio-temporal analysis carried on the same dataset using spatial scan statistics [17]. 4.2.1. Vorono¨ı polygons’ area Fig. 5(a) presents the evolution of the KL divergence. The higher the absolute values, the higher the difference between the distribution of the areas of polygons and the homogeneous one (randomly generated at each iteration). Fig. 5(b) shows the increase in the number of small polygons (smaller than 1 km2) during the clustered period. For other sizes (for instance, the one in Fig. 5(c)) the distribution of areas is fluctuating with time, but no clear pattern can be detected. Observing the distribution of burnt areas (in red on the figure) it can be observed that strong decrease in clustering coincide with the largest summer events (in terms of hectares burnt). That could be explained by the fact that the largest fires last longer and consume the available inflammable materials, preventing then the development of other fires in the same area.
3276
D. Tuia et al. / Physica A 387 (2008) 3271–3280
Fig. 4. Fractal dimension calculated by (left) the box-counting method and (right) the sandbox method for the first subset of 500 events and a randomly generated data set.
Fig. 5. Vorono¨ı polygons’ area distribution in time. (a) KL divergence between observed fires distribution and an artificial homogeneous distribution; (b)–(d) evolution of the frequencies of the distribution of the areas for the bins (b) 1 km2 (c) 100 km2 .
D. Tuia et al. / Physica A 387 (2008) 3271–3280
3277
Fig. 6. Time variation of the Morisita index. (a) variation for every considered scale; (b) and (c) correspondence between burnt area and Morisita index for scales (b) 0.8 km and (c) 26.4 km.
4.2.2. Morisita index Fig. 6 shows the time variation of the Morishita index for different sizes 1. Temporal variation in terms of clustering can be seen in Fig. 6a, where all the measured scales are represented. The clustering is reflected in every curve in a similar manner, showing that the level of clustering does not affect the overall shape of the Morisita curve. Figs. 6(b) and (c) show again the dependency between burnt area and clustering observed previously: large events are often characterized by strong decrease in the level of clustering. 4.2.3. Fractal dimension Fig. 7 illustrates the temporal variation of the fractal dimension calculated with the box-counting and sandbox method. Both curves share some similar behavioural features, like the minimum in March 2002 followed by the largest fires. Nonetheless, both indices have different evolutions in time: the variability of d f SAND (the range of values is between 1.15 and 1.65) is higher than the variability of d f BOX (range between 1.25 and 1.45). That can be explained by the fact that the variations in local densities of fires (detected by the sandbox method) are more important and informative than variation in the covering of the entire two-dimensional space by the fire events. Looking at the post-plots of the box-counting results for one scale (the four maps around the curve on the left side of Fig. 7), we can see that the covering of the region (red squares) is more or less the same for the highly and weakly clustered 500-events windows. By plotting the entire box-counting curve for each of these four datasets (Fig. 8), we can see that the behaviour (and more particularly the slope) of the curves is similar for the clustered ones (225 and 2353 series, corresponding to January 1997 and March 2002), where the linearity of the curve is maintained for all
3278
D. Tuia et al. / Physica A 387 (2008) 3271–3280
Fig. 7. Variation of box-counting (left) and Sandbox (right) fractal indices. Left: plots of covered boxes (red) for the sequences ending at day 225, 1716, 2353, 2501. Right: plotting of events densities for the sequences ending at day 618, 1912, 2249, 2501. (For interpretation of the references to colour in this figure legend, the reader is referred to the web version of this article.)
Fig. 8. Box-counting curves for the sequences ending at day 225, 1716, 2353, 2501. Comparison with a homogeneously distributed sequence.
the scales. By looking at the more regularly distributed datasets (1716 and 2501 series, corresponding to August 2000 and July 2003) we can see higher slopes, closer to the homogeneous situation. It is interesting to notice that the 2501 series shows homogeneity only at smaller scales, while by observing the end of the curve, a strong clustering might be expected. A multifractal behaviour is therefore suspected.
D. Tuia et al. / Physica A 387 (2008) 3271–3280
3279
Looking at the sandbox results, they seem to be more informative, confirming observations made in Ref. [5]: Analysis of local densities allows to distinguish periods where the fires distribution is sparse (series 618 and 2501, maps on the top-right of Fig. 7) from others where the distributed in particular areas (series 1912 and 2249, bottomright of Fig. 7). 5. Conclusion The time varying spatial clustering of the 1997–2003 set of locations of fires occurred in Toscana (central Italy), one of the most vulnerable to fires, has been analysed. The clustering phenomenon has been investigated using several independent indices (Voronoi polygon area index, Morishita index, fractal dimension). All the measures provide consistent results indicating a rather high degree of spatial clustering of the fire events. Furthermore, the time variation of all the indices has revealed a fire-cluster modulated behaviour and observations about pertinence of the methods and differences in interpretation have been provided. These results can be fruitfully used to estimate the properties of the density of fires in those areas, where particular fire prevention and fire mitigation risk should be applied. Acknowledgments This work has been partially supported by the Swiss National Foundation. Projects “Urbanization Regime and Environmental Impact: Analysis and Modelling of Urban Patterns, Clustering and Metamorphoses” (n. 100012113506) and “GeoKernels: Kernel-Based Methods for Geo- and Environmental Sciences” (n. 200021-113944). L. Telesca acknowledges the financial support of Fond National Swisse and Consiglio Nazionale delle Ricerche, in the framework of the Bilateral Agreement CNR/FNS (Grant N. PIT2-119687). References [1] P. Bak, C. Tang, K. Wiesenfeld, Phys. Rev. A 38 (1988) 364. [2] S. Clar, B. Drossel, K. Schenk, F. Schwabl, Physica A 266 (1999) 153; B. Drossel, F. Schwabl, Phys. Rev. Lett. 69 (1992) 1629; B. Drossel, F. Schwabl, Fractals 1 (1993) 1022; P. Grassberger, J. Phys. A 26 (1993) 2081; A. Honecker, I. Peschel, Physica A 229 (1996) 478; A. Honecker, I. Peschel, Physica A 239 (1997) 509. [3] B.D. Malamud, G. Morein, D.L. Turcotte, Science 281 (1998) 1840; C. Ricotta, G. Avena, M. Marchetti, Ecol. Model. 119 (1999) 73; S.G. Cumming, Can. J. For. Res. 31 (2001) 1297; C. Ricotta, M. Arianoutsou, R. Diaz-Delgado, B. Duguy, F. Lloret, E. Maroudi, S. Mazzoleni, J.M. Moreno, S. Rambal, R. Vallejo, A. Vazquez, Ecol. Model. 141 (2001) 307; W. Song, F. Weicheng, W. Bighong, Z. Jianjun, Ecol. Model. 145 (2001) 61; W.J. Reed, K.S. McKelvey, Ecol. Model. 150 (2002) 239; G. Cello, B.D. Malamud, Fractal Analysis for Natural Hazards, The Geological Society, London, 2006. [4] L. Telesca, G. Amatulli, R. Lasaponara, M. Lovallo, A. Santulli, Ecol. Model. 185 (2005) 531; L. Telesca, R. Lasaponara, Physica A 359 (2006) 747. [5] D. Tuia, R. Lasaponara, L. Telesca, M. Kanevski, Physica A 376 (2007) 596–600. [6] N. Cressie, Statistics for Spatial Data, John Wiley and Sons, New York, 1993; M. Kanevski, M. Maignan, Analysis and Modelling of Spatial Environmental Data, PPUR, Lausanne, 2004. [7] A.H. Thiessen, Monthly Weather Rev. 39 (1911) 1082–1084; F.P. Preparata, F.I. Shamos, Computational Geometry, Springer-Verlag, New York, 1985; A. Okabe, B. Boots, K. Sugihara, Spatial Tessellations: Concepts and Applications of Voronoi Diagrams, John Wiley and Sons, 1992. [8] G. Dubois, J. Geographic Inform. Decision Anal. 4 (1) (2000) 1–10; D. Prodanov, N. Nagelkerke, E. Marani, J. Neurosci. Methods 160 (2007) 93–108. [9] S. Kullback, R.A. Leibler, Ann. Math. Statist. 22 (1951) 79–86. [10] T. Nicholson, M. Sambridge, O. Gudmundsson, Internat. J. Geophys. 142 (2000) 37–51. [11] M. Morisita, Measuring of interspecific association and similarity between communities, Mem. Fac. Sci. Kyusyu Univ. (1959); M. Morisita, Res. Popul. Ecol. 4 (1962) 1–7. [12] T. Ouchi, T. Uekawa, Phys. Earth Planet. Interiors 44 (3) (1986) 211–225; R.P. Barros Henriques, E.C. Girnos De Sousa, Biotropica 21 (3) (1989) 204–209; S. Bunyavejchewin, J.V. Lafrankie, P.J. Baker, M. Kanzaki, P.S. Ashton, T. Yamakura, Forest Ecol. Management 175 (2003) 87–101; S. Shahid Shaukat, I. Ali Siddiqui, J. Arid Environments 57 (2004) 311–327; L. Bonjorne de Almeida, M. Galetti, Acta Oecologica 32 (2) (2007) 180–187.
3280
D. Tuia et al. / Physica A 387 (2008) 3271–3280
[13] S. Lovejoy, D. Schertzer, P. Ladoy, Nature 319 (1986) 43–44. [14] K. Nanjo, H. Nagahama, Chaos Solitons Fractals 19 (2004) 387–397; D. Tuia, C. Kaiser, M. Kanevski, Geoenv VI: Proceedings of the Sixth European Conference on Geostatistics for Environmental Applications, Springer, 2007. [15] T.G. Smith, W.B. Marks, G.D. Lange, W.H. Sheriff, E.A. Neale, J. Neurosci. Methods 27 (1989) 173–180. [16] J. Feder, Fractals, Plenum Press, N.Y., 1988. [17] D. Tuia, F. Ratle, R. Lasaponara, L. Telesca, M. Kanevski, Scan statistics analysis of forest fire clusters, Commun. Nonlinear Sci. Numer. Simul. 13 (8) (2008) 1689–1694.