proach, to expose the building data plane and enable in- teroporable software services and applications that mon- itor and ..... Using the Android SDK [2], we de-.
Enabling Green Building Applications Stephen Dawson-Haggerty, Jorge Ortiz, Xiaofan Jiang, Jeff Hsu, Sushant Shankar, and David Culler Computer Science Division University of California, Berkeley {stevedh,jortiz,fxjiang,jeffhsu,sushant,culler}@cs.berkeley.edu
Abstract Office buildings contain large sensor network deployments to monitor and maintain their internal environment. They also consume a significant amount of energy. This paper proposes the use of the use of horizontal layering, rather than the current vertical-solution approach, to expose the building data plane and enable interoporable software services and applications that monitor and control the building environment. We present our instantiation of this approach, which includes a data plane (sMAP) and storage service (IS4). Furthermore, we describe a set of applications built in this ecosystem.
Categories and Subject Descriptors H.4.3 [Information Systems Applications]: Communications Applications
General Terms Standardization, Design
Keywords Building Monitoring, Energy, Sensor Networks
1
Introduction
According to a 2010 Energy Information Administration (EIA) report, the commercial sector accounts for 19% of all energy consumption in the United States [4], much of which is spent in buildings and much of which is thought to be wasted. Buildings are already some of the largest and most prevalent deployments of “sensor networks” in the world, although they are not typically recognized as such. Locked in proprietary stovepipe solutions or behind closed interfaces, a modern commercial building contains thousands of sensors and actua-
Permission to make digital or hard copies of all or part of this work for personal or classroom use is granted without fee provided that copies are not made or distributed for profit or commercial advantage and that copies bear this notice and the full citation on the first page. To copy otherwise, to republish, to post on servers or to redistribute to lists, requires prior specific permission and/or a fee. HotEmNets’10, June 28–29, 2010, Killarney, Ireland Copyright 2010 ACM 978-1-4503-0265-4 ...$10.00
tors more or less the same as those used in a typical sensor network deployment: temperature, humidity, and power are the most common transducers. These two facts make buildings perhaps the most significant application area for sensor networks in the near term: many commercial buildings already contain the dense instrumentation often posited as the goal of sensor network deployments, but combine it with a relatively unsophisticated approach to applying those data to a host of different problems and applications. Through better use of existing systems, we may be able to make a dent in buildings’ energy usage. Unlike most computing systems, buildings last for decades and are upgraded many times – fully 20% of U.S. commercial floor space in use in 1995 was preWWII construction [3]. As it turns out, the two engineering buildings at UC Berkeley, Cory Hall and Soda Hall, capture this generational spread well: Cory Hall was completed in 1950 and has been upgraded several times since then, while Soda Hall is “new” construction, entering service in 1994. Given the long life-span of building stock, it is impossible to effectively investigate this problem without integrating legacy buildings and equipment into any proposed solution. Both buildings are relatively well instrumented; Soda Hall has a building management system from Barrington Systems and over 1300 sense points, while Cory Hall is in the process of being extensively instrumented. Data from the systems are periodically backhauled into the campus-wide Supervisory Control and Data Acquisition (SCADA) network, which is then archived on CDROM. Since these management systems are predominantly responsible for maintaining a comfortable indoor environment, most of the sensors deal with lighting and HVAC. Accessing this data is neither a simple nor pleasant experience. In the near future, there will be a great variety of additional data streams to choose from: grid data from IntelliGrid, building models from a GreenXML source, pricing data from an OpenADR feed, monitoring data from Smart Energy Profile devices, and more. This flood of data all centers around the building, which is
2
Architecture
Today’s typical building management system consists of front-end sensors which periodically report their data to a back-end database over one or more link technologies: RS-485, raw Ethernet frames, and IP networks are common. Several computers are typically also present, and present an interface to users for adjusting set points and setting schedules; these are then enacted by sending commands back to the front-end devices (Remote Terminal Units, in Modbus terminology). This straightforward architecture is simple and makes sense when computing is expensive, because it minimizes the functionality placed at the actual sense points. As processing gets ever cheaper, it makes sense to reevaluate these design decisions, especially as systems converge on IP as their network layer. What is missing from this architecture are applications: the typical building management systems provides no hooks for extensibility, and no context for executing third-party code. Given that sensors of the future (and even sensors today) can support significant local functionality, the most important architectural change we make is a shift to a service oriented architecture. In this conception, sensors and meters provide a service which exposes their underlying functionality; this functionality is then available to any authorized user. The result is less of a vertical stack then a collection of servers forming a platform; thus, we refer to it as a “building operating system.” Some core services which are not sensors are also
Portable Applications Modeling
Con>nuous Commissioning
Actua>on and Control
Debugging
Personal Feedback
Visualiza>on
…
Core Services IS4 (storage)
Loca>on
Authen>ca>on
sMAP sMAP
sMAP
Modbus
Proxy RS-‐485
… sMAP Interface
sMAP
Proxy
what makes it such an exciting application area to work in. This paper does not solve the whole problem of breaking open building data stovepipes and fully realizing the value of that information; nor does it claim complete novelty in this area, as pieces of existing systems such as BACnet, LonTalk, and Modbus are in fact open standards. Rather, we draw ideas from contemporary system design such as data independence, application portability, and streaming queries to construct an imperfect approximation of what we wish existed: a system where all building sensors share a simple common representation, where services for building data storage are available, shared, and uniform, and most fundamentally, where building “applications” can exist. The applications we want to build benefit from the same sort of “hardware abstraction layer” that software normally provides, so that each application can be executed without tuning it specifically and exquisitely for a particular building. Therefore, that is where we start, creating a building information bus to let any application talk to any sensor or actuator. In the following sections of the paper, we discuss our design goals for building applications in more depth, and then dive into a discussion of how to realize them for two real buildings: Cory and Soda Halls. We conclude with the first applications we have built, and plans for future work.
IPv6 / 6LowPAN Wireless Mesh Network sMAP sMAP
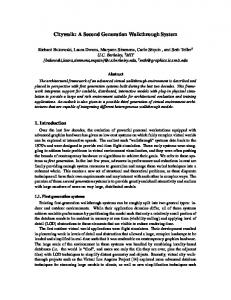
Figure 1. Architecture of the building operating system. Legacy devices such as Modbus branch meters implement sMAP using proxies, while IPv6-based sensors in a wireless mesh network implement sMAP directly. Core services and applications interface with any metering resource uniformly via sMAP. In this example, a visualization application graphs realtime energy readings from both plug-load meters and from branch meters. necessary. For instance, location, authentication, and database services are critically important. Thus, our overall design consists of a set of service definitions which communicate using Internet standards and collectively provide an execution context for applications. Figure 1 shows the architecture and the set of foundational services for a building operating system. At the heart of this design is an abstraction layer, either integrated directly into the sensors (for newer devices such as IP-based sensors) or on a gateway (for legacy devices such as Modbus based meters). The protocol for this layer is called sMAP, the Simple Measuring and Actuation Profile which provides uniform access to a large subset of devices typically found in a building. This layer is the “hardware abstraction layer”; below it, code may be device-specific. Running on top of the data bus are core OS services: storage, authentication, and location. Each of these defines a set of protocols and service definitions; for instance, the storage service is called IS4: the Integrated Sensor-Stream Storage System.
2.1
Data Sources
In complex environments such as a commercial building, diverse classes of sensors, meters, and actuators are spread throughout the building, monitoring thousands of sense points at various granularities. sMAP abstracts these myriad data sources and allows uniform access, enabling applications to rely on a cer-
tain set of semantics. Therefore, a key part of our project is to understand some of the most frequently used data sources and provide a layer that implements sMAP on top of them.
2.1.1
Example Sources
One of the most frequently used protocols in existing building management systems is Modbus. It defines a payload format for reading and writing virtual device “registers,” and is typically run directly on a link-layer; the common choices are the RS-485 serial link or Ethernet. In order to interface with a particular device such as the Veris panel meter measuring our lab, a developer must know the register addresses of the fields he wishes to read out, as well as understand the packing of any wide or floating-point fields (Modbus natively supports only 16-bit big-endian integer representation.) Wireless building management systems will also become increasingly common in the next few years, based on WirelessHART, ISA 100.11a, or the Zigbee/HomePlug Smart Energy Profile 2.0 (SEP2) [9, 5, 8]. All are based on IPv6, using 6lowpan header compression and specify (or will specify) a full network stack from application to link-layer. Most relevant to this discussion is the fact that SEP2 has yet to be specified, and ISA 100.11a supports tunneling legacy protocols, so one could implement sMAP (or anything else) on top of it. On the academic side, researchers have explored the challenges of building efficient low-power support for Internet protocols [7, 10]; this work will for a key part of the building operating system of the future. To explore the viability of the emerging standardscompliant stack, we have included in our evaluation an implementation of sMAP running on a microcontroller using draft versions of the emerging 6lowpan standards. SCADA, short for “Supervisory Control and Data Acquisition” is a common catch-all name for a larger system constructed from some of the elements we have discussed. It typically includes both front-end sensors, supervisory control functionality (changing set points), and visualization tools. These systems are also often capable of storing archival data for historical analysis. Cory and Soda Halls currently back-haul their system data to a central collection point on campus once per day, where it is archived to CD-ROM. To further integrate with this legacy data, we have implemented a filter for this format which allows historical data from the SCADA to be put into the IS4 (Section 2.3.1) storage system. Although we are presently unable to access real-time data, the historical readings are useful for many purposes.
2.2
sMAP
Building on the work proceeding in standards bodies and proven Internet protocols, sMAP is built on top of HTTP and TCP/IP. Objects are represented using JSON schema. These choices were chosen because they already have wide tool support; creating, validating, and
sending a JSON object to a RESTful service point is only a few lines of code in most languages, and some (i.e., Ruby) even provide “RESTful-object mappings.” Since it is the common interchange layer where the data meets the road, it is important that the layer not only exist, but also be well-designed so that many different transducers may be consistently represented. /
/data / [sense_point] /meter /[channel] /reading /format /parameter /profile /report
# # # # # # # # # #
list resource under URI root [GET] list sense points under resource data [GET] select a sense points [GET] meters provide this service [GET] a particular channel [GET] meter reading [GET] calibration and units [GET/POST] sampling parameter [GET/POST] history of readings [GET] create and query periodic reports [GET/POST]
POST requests supply JSON objects as arguments: POST: http://meter1.cs.berkeley.edu/report { "ReportResource" : "/data/325/meter/*/reading", "ReportDeliveryLocation" : "http://webs.cs.berkeley.edu/receivereports.php", "Period" : 60, "Minimum" : 50, "Maximum" : 100 }
Figure 2. The data/ fragment of the sMAP RESTful API The goal of sMAP is to represent a single device, uniformly providing all the information necessary to query all sensors, meters, and actuators. A sensor is a device which instantaneously samples a physical quantity (such as current or light), while a meter integrates such a value over time (for instance, energy or flow volume.) An actuator is a device which may either convert a digital quantity to an analog one or control a set point; relays, thermostats, and valves are examples of actuators.
2.2.1
Data
A fragment of the sMAP service definition is shown in Figure 2; this particular piece deals with the representation of meters (sensors have a similar representation). sMAP is hierarchical, and allows a single device to have multiple sense points, each of which instrument a single physical process. A sense point may also have multiple channels. This corresponds to the reality that from a single instrumented sense point such as a Hall-effect sensor, a device may derive current (RMS and peak), instantaneous power, metered energy (over some time interval), and power factor. This would be represented as a single sense point with multiple sensor channels. Integrated with the sensor reading itself which is stored in the reading resource are all the ancillary facts necessary to interpret the data. formatting contains information on what is being measured and how to interpret raw readings, specifying engineering units and calibration constants. parameter contains information on the sampling rate in use; this can be used to determine when reading will update. Finally, profile is an optional resource which allows a sMAP server to buffer a fixed number of old readings.
2.2.2
Reporting
sMAP also allows periodic reports to be sent via “pushing”; however, very small embedded implementations may not support this. To request a periodic report,
Device (# sense points) Measured load Veris E30 Modbus meter (42) RAD Lab wall panel ACme plug-load meter (50) RAD Lab plug loads Dent PowerScout 18 (162) Cory Hall testbed CA ISO Proxy (1) CA grid demand Table 1. sMAP data sources.
back to IS4. An actuator can subscribe to the modeler’s stream and use it to make decisions about how to control a set of devices. Furthermore, if the actuator publishes an event stream, a visualizer may subscribe to the actuation stream and the modeling stream, showing end-users their relationship in real time.
2.3.2 a client sends a JSON object to the sMAP server specifying what resource on the server should be reported, and the URL of the destination. Two schemes are currently supported: http and udp. When using http, the requested resource is sent via an HTTP POST to the URL specified; when using udp, the document is sent in a UDP packet, instead.becoming increasingly popular on the web for pushing message updates, as it integrates well with existing deployments and avoids supporting a new protocol like XMPP. Periodic reporting is critical to allow sMAP to integrate into full-fledged stream processing system, since it allows a system to create event triggers and avoid inefficient polling.
2.2.3
Efficiency
HTTP, while itself relatively inefficient, also provides some significant advantages. Devices on low-bandwidth links may have their sMAP data cached by intermediate HTTP proxies, and it also provides basic security and authentication functionality. Since even JSON objects may be too verbose for links with very small MTUs, we have also defined a compressed representation for use in these cases. Taking advantage of information contained in the schema to eliminate strings, enumerated types, and extra markup, a typical reading object can be reduced from around 94 octets to 22.
2.3
OS Services
sMAP provides a narrow waist for data sharing between devices and the applications that make use of their data. This decouples device changes from the services and applications built on top of them. The set of crucial services for building applications include storage, authentication, and location.
2.3.1
Storage
We have experimented with a storage service to store and manage all data streams produced by sMAP data sources. The Integrated Sensor Stream Storage System (IS4) is a RESTful, stream-based storage system which subscribes to sMAP feeds. IS4 allows published data streams to be queried historically and in real-time, while also storing and managing their metadata. IS4 accepts data from any sMAP data source. Since data producers are broadly defined, producers are not limited to devices; they may also be proxies, modeling processes, or other sources. Consequently, data consumers (subscribers) can also be data producers (publishers). This is useful for connecting arbitrary components, dependent only on each other’s data. For example, a modeler may subscribe to various data streams and publish its output
Authentication and Location Services
Although not currently available, authentication and location services are crucial to building applications. sMAP is built over HTTP which already provides basic security and authentication functionality but it should be extended as a broader service for controlling the access to devices. This is particularly important for managing actuation privileges. Unauthorized users and/or processes should not be able to view or control any device without the proper permissions. This may lead to unwanted, malicious, and even dangerous activity that may cause harm to building equipment and occupants. A location service is also necessary to manage the placement and replacement of devices to/from various locations. Knowing the location information is also necessary to assocaiate the data stream to the context in which it is collected. This is a major burden on system administrators today as all the information is manually entered. As buildings evolve and devices are replaced/removed, changes often go unrecorded. This usually leads to useless data collection as context-less data becomes meaningless.
3
Applications
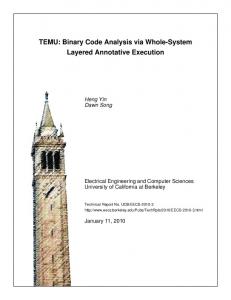
Including sMAP data in an existing application is very easy, due to wide tool support for web standards. Figure 3 shows a single line of Python which will allow the application to fetch and parse the current values for all meters hosted by the machine named “veris.” The only step missing is validating the returned document against the JSON schema, which is optional. url = ’http://veris/data/*/meter/0/reading’ doc = simplejson.load(urllib.urlopen(url)) Figure 3. Loading meter readings from a sMAP source in python A simple application we built to expose all available sMAP functionality is the visualization console. This is a web app targeted at developers which can use any sMAP service and generate a GUI showing the available sense points, live readings, and time-series plots of any available cached data. This is the application shown as part of the larger ecosystem in Figure 1. The second application we built leverages web technologies to provide personalized user feedback and control of a building. Using the Android SDK [2], we developed an handheld “app” which lets a user directly interact with the building sensors. The app provides a three-step interaction with the building: 1. locate, 2. visualize, and 3. actuate.
In the first step, the user locates himself within the building by scanning one of the QR codes [6] placed on various rooms and objects. These codes encode the URL of the building resource provided for that location or device; for instance, a code for a room enumerates the sensors within that room, while a plug-load meter encodes the location of its sMAP source. In the second step, the user visualizes the data provided by the resource. For instance, the app can show time-series data of consumption over time for instrumented outlets, and total-power breakdowns for many of our conference rooms by fetching it from IS4, the storage engine. It is at this stage when the user can also create permanent associations with rooms or devices, allowing the app to remember that “this is my outlet,” or “this is my office.” Finally, the app allows actuation of certain devices such as lights and thermostats – the user can switch the light and adjust the set point of the thermostat.
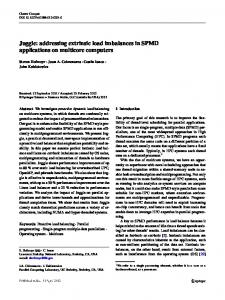
protocol for uploading energy data and allows users to see their energy usage via an iGoogle widget. sMAP compliments Google PowerMeter by providing the hardware abstraction for energy monitoring devices. We wrote a simple “bridge” that sends energy data from sMAP compliant devices to Google and show that users can view any sMAP sources from their iGoogle page, as seen in Figure 5.
4
Conclusions
The field of “smart energy” is rapidly becoming a crowded one, and some of the first challenges faced are ones of integration rather then foundational technology. An architecture like sMAP makes it easier to share data both within and across organizational lines since only one gateway for each obscure Modbus device need be written, and entities wishing to share data must only set up permissions to do so. By paying close attention to uniform information representation and creating service definitions, applications will be “portable” between buildings, an important design goal. In the near future, we will flesh out the data warehousing capacity of the building: an entirely different kind of application which will run “on the building” are analysis and modeling jobs, which must run using both stored and live data. By bringing open protocols, open formats, and open data to the building, we will unleash a significant amount of innovation by software developers and designers that is currently hindered by the sheer difficulty of retrieving and interpreting this data.
Acknowledgments
Figure 4. User visualization app in action. We can imagine many variations of this app running either as a web app or on mobile platforms integrating ever more data that is becoming available – one obvious mashup is integrating the personal accounting functionality with OpenADR feeds to provide a real-time price feed for the energy a user is using. Another would be to use additional location-based services available on the phone to automatically switch devices off when the user is not near them – turn off the lights and TV when the user isn’t home.
Figure 5. sMAP to Google PowerMeter widget. Finally, the Google PowerMeter API [1] defines a
Special thanks to Scott McNally and Albert Goto for much helpful assistance. This work is supported in part by the National Science Foundation under grants CPS0932209 and CPS-0931843 and an NSF Graduate Fellowship.
References [1] Google powermeter. http://www.google.org/powermeter/. [2] Android. Software, Open Handset Alliance, 2007. [3] R. C. Diamond. An overview of the u.s. bulding stock. http://eetd. lbl.gov/ie/pdf/LBNL-43640.pdf, 2001. [4] Energy Outlook 2010. Energy Information Administration, http://www. eia.doe.gov/oiaf/ieo/index.html, 2010. [5] Wireless systems for industrial automation: Process control and related applications. Draft, ISA, 10.-September 2009. [6] ISO 18004: Automatic identification and data capture techniques — QR Code 2005 bar code symbology specification. Final draft, ISO/IEC, 31.August 2006. [7] N. B. Priyantha, A. Kansal, M. Goraczko, and F. Zhao. Tiny web services: design and implementation of interoperable and evolvable sensor networks. In SenSys ’08: Proceedings of the 6th ACM conference on Embedded network sensor systems, pages 253–266, New York, NY, USA, 2008. ACM. [8] Smart Energy Profile 2.0. Zigbee Alliance, 2010. [9] WirelessHART. HART Communication Foundation, 2009. [10] D. Yazar and A. Dunkels. Efficient Application Integration in IP-based Sensor Networks. In Proceedings of ACM BuildSys 2009, the First ACM Workshop On Embedded Sensing Systems For Energy-Efficiency In Buildings, Berkeley, CA, USA, Nov. 2009.