LETTERS
Encoding microcarriers by spatial selective photobleaching KEVIN BRAECKMANS1, STEFAAN C. DE SMEDT*1, CHRIS ROELANT2, MARC LEBLANS2, RUDI PAUWELS2 AND JOSEPH DEMEESTER1 1
Lab General Biochemistry & Physical Pharmacy, Ghent University, Harelbekestraat 72, 9000 Ghent, Belgium TIBOTEC B.V.B.A.., Generaal de Wittelaan L11 B3, 2800 Mechelen, Belgium *e-mail:
[email protected] 2
a
b
Published online: 2 February 2003; doi:10.1038/nmat828
B
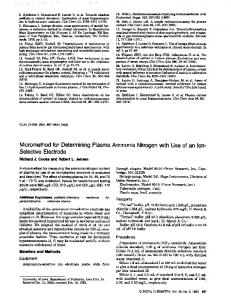
ead-based assays on very large numbers of molecules in gene expression studies, drug screening and clinical diagnostics1, require the encoding of each of the microspheres according to the particular ligand bound to its surface2–3. This allows mixing the uniquely encoded microspheres and subjecting them to an assay simultaneously. When a particular microsphere gives a positive reaction, the substance on its surface can be identified by reading the code. Previously reported techniques for colour encoding polymer microspheres4-10 only allow for a limited number of unique codes. Graphical encoding methods use metallic particles11,12, which are rather uncommon in screening applications. Here, we demonstrate a new approach to encode polymer microspheres that are commonly used in screening applications,such as polystyrene microspheres,with a method that provides a virtually unlimited number of unique codes. Patterns can be written in fluorescently dyed microspheres by ‘spatial selective photobleaching’ and can be identified by confocal microscopy. Such encoded microparticles can find broad application in the collection and analysis of genetic information,high-throughput screening, medical diagnostics and combinatorial chemistry, and can also be used for labelling of consumer goods or as security labels to prevent counterfeiting. As shown in Fig. 1,a pattern can be written inside a homogeneously fluorescently dyed microsphere by ‘spatial selective photobleaching’ of the fluorescence. Photobleaching is a photo-induced process where fluorescent molecules lose their fluorescent properties, resulting in a fading of the fluorescent colour. The term spatial selective photobleaching refers to the photobleaching of certain regions in, for example, a fluorescent microsphere. Any geometry can be bleached, such as a symbol or a barcode, at a certain depth in the microsphere by using a confocal scanning laser microscope (CSLM) modified for this purpose, as described in the Methods section. There are only two requirements for the microsphere material to be workable.First,it has to be sufficiently transparent for the laser light to get inside the microsphere. Second, most of the fluorescent molecules should be fixed in the material, either by chemical bonds, or by physically entrapping them in the meshes of the material’s matrix. Otherwise, the bleached code will fade away over time because of diffusion of the fluorescent and bleached molecules. At present, the method of spatial selective photobleaching has been successfully applied to polystyrene, nature materials | VOL 2 | MARCH 2003 | www.nature.com/naturematerials
0
10 µm
0
10 µm
c
20 µm
Figure 1 Encoding by spatial selective photobleaching. a,A logo was bleached at the central plane of a 45 µm green-fluorescent microsphere. b,A barcode was bleached at the central plane of a 45 µm microsphere. Bars of four different widths were used and each code-element (bar) is separated from the next one by an unbleached region of 1 µm.To illustrate the versatility of possible geometries, an alpha-numeric code was added as well. c, Confocal image of green-fluorescent 28 µm microspheres encoded with various barcodes. 169
LETTERS 1
5
2
6
3
7
4
8
Fluorescence intensity (arbitrary units)
a
220 200 180
1
160
2
140
3 4
5
120
6
100
7
8
80 0
5
10
15 20 x (µm)
25
30
35
10 µm
c
b
5 µm
5 µm
180
5 µm
160 Fluorescence intensity (arbitrary units)
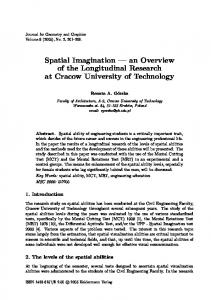
Figure 2 Intensity and width encoding. a,To demonstrate the possibility of intensity encoding,a barcode was bleached at the central plane of a 45 µm microsphere using eight different bleaching levels.The intensity profile across the barcode shows indeed eight bleaching intensities.x is the direction perpendicular to the bars.b,A barcode was bleached at the central plane of a 28 µm microsphere using two intensities (bleached and unbleached) and two widths (1.06 µm and 2.12 µm).c,A combination of three widths and two intensities was used in this barcode,which was bleached at the central plane of a 28 µm microsphere.The first and last bars were added as a simple start and stop sign and are not part of the code itself.
0 0
140
120 1 100
1
1
80
60 2
argogel (polyethylene glycol grafted polystyrene) and dextran beads. Other common polymer bead materials are also expected to work well. The bleaching pattern can be of any geometry, one-, two- or even three-dimensional. But because the pattern is bleached pixel by pixel, line by line, the time needed for the writing process will depend on the complexity of the pattern. In many applications, such as highthroughput screening, the codes should be written and read as fast as possible. Therefore, in this study we will focus mainly on the design of one-dimensional codes,such as barcodes,examples of which are shown in Fig. 1b and c.In this case,information can be stored in width as well as in intensity of the code elements. Figure 2a shows a bleached barcode consisting of eight bars of equal width, but using eight different bleaching levels. The graph shows the intensity profile across the barcode. Indeed, eight different intensities can be distinguished, thus proving the feasibility of intensity encoding. However, one must be careful not to place the bars too close,because this will cause the intensity profiles of the bars to overlap, making it more difficult to distinguish between the different levels. In Fig. 2b, a combination of double-width (1.06 µm and 2.12 µm) and double-intensity encoding (bleached and unbleached) is shown. For Fig. 2c, double-width (1.6 µm and 3.2 µm) and triple-intensity encoding was used. The first and last bars were added as a simple start and stop sign but do not belong to the actual code. These examples demonstrate the feasibility of multiple width and intensity encoding. 170
2
40 5
10
15 x (µm)
20
25
Figure 3 ‘Dot code’.The same barcode shown in Fig. 2c was bleached at the central plane of a 28 µm microsphere.The bleaching was done by scanning only once across the central line.The first and last ‘dots’ were added as a simple start and stop sign and are not part of the actual code.The graph shows the intensity profile across the bleached ‘dot code’,leaving out the first and last dot.x is the direction of the dot code.The three intensity levels can be distinguished,and the numbers on the graph indicate the bleaching levels: 0 = unbleached, 1 = medium bleached, 2 = fully bleached.
The number of unique codes that can be generated depends on three aspects, the first obviously being the space available inside the microsphere. Empirically we have seen that at the central plane of a microsphere,as a rule of thumb,about 70% of the diameter can be used for the writing of a code. Bleaching near the edges becomes less efficient because of the spherical shape and should be avoided. For example, at the central plane of a 50 µm sphere, the central 35 µm is available for writing a code. The second aspect is the resolution of the writing beam, nature materials | VOL 2 | MARCH 2003 | www.nature.com/naturematerials
LETTERS a
b i
ii
20 µm
iii
20 µm
iv
20 µm
primarily depending on the characteristics of the objective lens and the wavelength of the light used13. But inside a microsphere, the real resolution will be somewhat less than theoretically predicted because of a mismatch between the refractive index of the microsphere material and its surrounding medium14. For example, the refractive index of polystyrene and water is respectively 1.59 and 1.33. This mismatch of refractive indices causes spherical aberrations that result in a decrease in resolution.Finally,the number of codes is determined by the number of different widths and intensities that are employed in the encoding scheme. If only two intensities are used, the experiments show it is possible to make a readable code with bars having a minimal width of 1 µm.More intensities will require a larger minimal width of the bars in order for the different levels to remain clearly distinguishable. The experiments show that a minimal width of 1.5 µm is feasible in this case. To give an idea of the number of different codes that can be generated in actual practice,consider,for example,a microsphere of 45 µm diameter, in which 30 µm is available at the central plane for writing a code. Using three widths (1.5 µm, 3 µm and 4.5 µm) and three intensities, a vast number of 179 × 106 codes can be generated. Using only two intensities allows the use of smaller code elements. Therefore the combination of two intensities and three widths (1 µm, 2 µm and 3 µm) still yields 4.23 × 10⁶ different codes.From this it is clear that the number of unique codes that can be generated using the spatial selective photobleaching technique is virtually unlimited. A barcode like the one in the example above, is a one-dimensional code in that its spatial information is stored in only one direction: the width of the bars. The code geometry, however, is two-dimensional because the bars have a certain length for ease of reading.If,however,one wants to encode the microspheres as fast as possible, it is worth considering writing ‘barcodes’ consisting of bars of minimal length, what could be termed ‘dotcodes’. An example is shown in Fig. 3 where the same barcode as in Fig. 2c is bleached by scanning only one line across the central plane of the microsphere.The time it takes to perform a single line scan depends on the maximum scan speed of the CSLM, which in this case was limited to 1.2 ms. This minimal time is not a fundamental limit to the bleaching process, but an instrumentdependent parameter. Although in our experiments the microspheres were stationary while being encoded by the scanning laser beam, it is equally possible to use a stationary laser beam while the microspheres are moved past the beam. This is especially attractive in the case of the aforementioned dotcode, where the microspheres would have to pass the stationary laser beam only once for writing or reading the code. nature materials | VOL 2 | MARCH 2003 | www.nature.com/naturematerials
20 µm
v
20 µm
vi
20 µm
vii
20 µm
20 µm
viii
20 µm
Figure 4 Ferromagnetic fluorescent microspheres.a,Fluorescence microscope image of green-fluorescent 38 µm microspheres coated with ferromagnetic chromium dioxide particles.The microscope was focused at the top surface of the microspheres to make the ferromagnetic particles visible.b,Magnetic orientation of a magnetized ferromagnetic microsphere.(i) An arrow was bleached at the central plane of a magnetized ferromagnetic microsphere to visualize its orientation.(ii–viii) Subsequently, a sequence of confocal images (1 image every 2 seconds) was taken to record the movement of the microsphere while being subjected to an external randomly moving magnetic field.The microsphere follows precisely the movement of the external magnetic field.When the magnetic field returns to its original orientation,the microsphere is observed to do the same (compare images i and viii).Images ii to vii represent the situation of the microsphere being subjected to an assay during which it will be randomly oriented. Image viii demonstrates the possibility at readout time to correctly reorient the microsphere such that the encoded pattern becomes clearly visible again. 171
LETTERS The microspheres could be transported by a fluid flow in a capillary- or flow-cell, or by fixing the spheres to a translation platform. Combining these elements,it can be concluded that an encoding rate of at least 102 to 103 microspheres per second is feasible, resulting in about 107 to 108 encoded microspheres per day. Even higher encoding speeds are possible if higher laser intensities are used. Let it finally be noted that decoding of the microspheres can happen at even higher rates, because the fluorescence process is an event that happens in the nanosecond regime. Therefore it can be concluded that this encoding technique can provide for the throughput needed for screening applications. In screening and diagnostics applications,the encoded microspheres will be subjected to chemical or biological assays in which they are free to move and rotate. In general, after re-collection, the microspheres will have an orientation different from when they were encoded.To correctly identify a code, a major challenge in the reading process will be to obtain the same position and orientation of the microspheres as when they were encoded in order for the pattern to be clearly visible. By providing the microspheres with orientation information, such as a magnetic moment,it is possible to automatically position the spheres correctly for readout. To evaluate this possibility, a ferromagnetic coating15 was applied to a batch of green fluorescent 38 µm polymer microspheres, consisting of submicrometre chromium dioxide particles,as is shown in Fig. 4a. At first, the microspheres were suspended in distilled water and magnetized by a strong magnetic field.Next,to show that the magnetized ferromagnetic microspheres can be oriented in an external magnetic field, an arrow was bleached at the central plane of a magnetic microsphere while being exposed to and oriented by a weak external magnetic field (Fig. 4b, image i). Subsequently, confocal images were taken (at two second intervals) to record the movement of the microsphere while being subjected to a randomly rotating magnetic field (Fig. 4b, images ii–viii). During the movement, the arrow was observed to follow the magnetic field and return to its exact original orientation together with the magnetic field (compare images i and viii of Fig. 4b). This experiment demonstrates the possibility to orient a magnetized ferromagnetic-coated microsphere at the encoding step and retrieve the same orientation at the decoding step by applying a weak external magnetic field, thus bringing the code to the correct readout position. After deposition of the ferromagnetic coating on the microsphere’s surface, it is possible to apply an extra coating of bead material, for example,polystyrene,in order to protect the assay environment from the ferromagnetic particles. Microspheres have been successfully used in screening and diagnostic applications for many years, despite restrictions by current technologies in terms of numbers of unique codes (in the order of 102 to 104). Now, with the new technology described herein, numerous applications are clearly possible. For example, microspheres have been successfully applied to genotyping, measuring cytokine and thyroid levels, cystic-fibrosis screening, genetic human lymphocyte antigen (HLA) typing, kinase testing, allergy testing, DNA-hybridization studies,proteomics and immunoassays16–29.As the number of codes that can be generated is almost unlimited (of the order of 106 to 108), this spatial selective encoding technique can boost the well-established bead-based screening techniques to a new level of efficiency, reducing time and cost. Additionally, we suggest the encoded microparticles could be used as security labels to prevent brand piracy, product diversion and counterfeiting. In conclusion, we have presented a novel way of encoding microspheres that holds much promise for use in biomedical research. As the encoding method is applicable to regular microspheres that have been common to screening applications for many years, it has a major advantage in that users can benefit from the current extensive knowledge on performing bead-based assays, eliminating the need for the development of new special chemistries. Moreover, this technique provides for a virtually unlimited number of unique codes, hence overcoming current limits of existing bead-based encoding strategies 172
and increasing cost and time efficiency.Therefore,this new approach to the encoding of microspheres is very promising in overcoming many of the restrictions of current screening techniques and is expected to open new horizons in gene expression research, high-throughput drug screening, drug discovery and medical diagnostics. METHODS MICROSPHERES The 45 µm green fluorescent polystyrene microspheres were purchased from Polysciences (Warrington, Pennsylvania, USA). The 28 µm polystyrene microspheres were provided by SINTEF Applied Chemistry (Trondheim, Norway) and loaded with NODD (N-(7-nitrobenz-2-oxa-1,3-diazol-4-yl)diethyl amine), a fast-bleaching green-fluorescent dye. The 38 µm green-fluorescent microspheres coated with ferromagnetic chromiumdioxide particles were purchased from Spherotech (Libertyville, Illinois, USA).
ENCODING/DECODING APPARATUS The encoding/decoding apparatus is a confocal laser scanning microscope (CLSM, Bio-Rad MRC1024 UV) to which the SCAMPER module is added. The module, first developed by Wedekind et al.30, consists of a powerful Ar-ion laser (Spectra Physics Stabilite 2017) and a fast optical switch, an acousto-optical modulator (AOM, Brimrose), controlled by a computer and dedicated software. The laser light emerging from the Ar-ion laser is directed to the AOM, which diffracts a high- or low-power laser beam according to the signal it receives from the computer towards an optical fibre (Point Source). The laser beam is transported through the fibre to the CSLM-module and into the microscope (Nikon Eclipse TE300), where it is focused by the microscope’s objective lens into the fluorescent microsphere. The high-power laser beam is used for photobleaching, and the low-power beam excites the fluorescent molecules without significant bleaching and is used for mere imaging. Bleaching patterns can be designed in dedicated software that controls the AOM. While recording an image with the CSLM—which is done by scanning the laser beam in a raster pattern, pixel by pixel, line by line—the software controls the AOM in such a way that low- and high-power laser light reaches the sample according to the designed pattern. The regions in the sample that were hit by the high-power laser light will be bleached to an extent depending on the amount of light received, which in its turn depends on the intensity and scanning speed of the laser beam. All microspheres are excited and bleached by the 488 nm line from the Ar-ion laser. In general there is a 1,000 to 10,000-fold increase in laser intensity for reading and bleaching. Typical bleaching intensities at the sample range from 1 to 30 mW, with typical imaging intensities ranging from 1 to 30 µW. A Nikon Plan Fluor ×40 objective lens with a numerical aperture of 0.75 was used in this study for writing and reading of the codes.
Received 6 November 2002; accepted 6 January 2003; published 2 February 2003. References 1. Meza, M. B. Bead-based HTS applications in drug discovery. Drug Discov. Today 1 (HTS Suppl.), 38–41 (2000). 2. Braeckmans, K. et al. Carrying the code. Mod. Drug Disc. (in the press). 3. Braeckmans, K., De Smedt, S. C., Leblans, M., Pauwels, R. & Demeester, J. Encoding microcarriers: present and future technologies. Nat. Rev. Drug Disc. 1, 447–456 (2002). 4. Egner, B. J. et al. Tagging in combinatorial chemistry: the use of coloured and fluorescent beads. Chem. Commun. 8, 735–736 (1997). 5. Kettman, J. R., Davies, T., Chandler, D., Oliver, K. G. & Fulton, R. J. Classification and properties of 64 multiplexed microsphere sets. Cytometry 33, 234–243 (1998). 6. Walt, D. R. Bead-based fiber-optic arrays. Science 287, 451–452 (2000). 7. Trau, M. & Battersby, B. J. Novel colloidal materials for high-throughput screening applications in drug discovery and genomics. Adv. Mater. 13, 975–979 (2001). 8. Keij, J. F. & Steinkamp, J. A. Flow cytometric characterization and classification of multiple dualcolour fluorescent microspheres using fluorescence lifetime. Cytometry 33, 318–323 (1998). 9. Kürner, J. M., Klimant, I., Krause, C., Pringsheim, E. & Wolfbeis, O. S. A new type of phosphorescent nanospheres for use in advanced time-resolved multiplexed bioassays. Anal. Biochem. 297, 32–41 (2001). 10. Han, M., Gao, X. H., Su, J. Z. & Nie S. Quantum-dot-tagged microbeads for multiplexed optical coding of biomolecules. Nat. Biotechnol. 19, 631–635 (2001). 11. Dames, A., England, J. & Colby, E. Bio-assay technique. World patent 00/16893 (2000). 12. Nicewarner-Peña, S. R. et al. Submicrometer metallic barcodes. Science 294, 137–141 (2001). 13. Pawley, J. B. Handbook of Biological Confocal Microscopy 2nd edn (Plenum, New York, 1995). 14. Hell, S., Reiner, G., Cremer, C. & Stelzer, E. H. K. Aberrations in confocal fluorescence microscopy induced by mismatches in refractive index. J. Microsc. 169, 391–405 (1993). 15. Wang, N., Butler, J. P. & Ingber, D. E. Mechanotransduction across the cell-surface and through the cytoskeleton. Science 260, 1124–1127 (1993). 16. Prabhakar, U., Eirikis, E. & Davis, H. M. Simultaneous quantification of proinflammetary cytokines in human plasma using the LabMAP (TM) assay. J. Immunol. Methods 260, 207–218 (2002). 17. Martins, T. B. Development of internal controls for the Luminex instrument as part of a multiplex seven-analyte viral respiratory antibody profile. Clin. Diagn. Lab. Immun. 9, 41–45 (2002). 18. Ye, F. et al. Fluorescent microsphere-based readout technology for multiplexed human single nucleotide polymorphism analysis and bacterial identification. Hum. Mutat. 17, 305–316 (2001). 19. Taylor, J. D. et al. Flow cytometric platform for high-throughput single nucleotide polymorphism analysis. Biotechniques 30, 661–675 (2001). 20. Yang, L., Tran, D. K. & Wang, X. BADGE, BeadsArray for the detection of gene expression, a highthroughput diagnostic bioassay. Genome Res. 11, 1888–1898 (2001). 21. Dunbar, S. A. & Jacobson, J. W. Application of the Luminex LabMAP in rapid screening for mutations in the cystic fibrosis transmembrane conductance regulator gene: A pilot study. Clin. Chem. 46, 1498–1500 (2000). 22. Vignali, D. A. A. Multiplexed particle-based flow cytometric assays. J. Immunol. Methods 243, 243–255 (2000).
nature materials | VOL 2 | MARCH 2003 | www.nature.com/naturematerials
LETTERS 23. Gordon, R. F. & MCDade, R. L. Multiplexed quantification of human IgG, IgA, and IgM with the FlowMetrix(TM) system. Clin. Chem. 43, 1799–1801 (1997). 24. WalkerPeach, C. R., Smith, P. L., DuBois, D. B. & Fulton, R. J. A novel rapid multiplexed assay for herpes simplex virus DNA using the FlowMetrix(TM) cytometric microsphere technology. Clin. Chem. 43, 21–21 (1997). 25. Smith, P. L., WalkerPeach, C. R., Fulton, R. J. & DuBois, D. B. A rapid, sensitive, multiplexed assay for detection of viral nucleic acids using the FlowMetrix system. Clin. Chem. 44, 2054–2056 (1998). 26. Oliver, K. G., Kettman, J. R. & Fulton, R. J. Multiplexed analysis of human cytokines by use of the FlowMetrix system. Clin. Chem. 44, 2057–2060 (1998). 27. Bellisario, R., Colinas, R. J. & Pass, K. A. Simultaneous measurement of thyroxine and thyrotropin from newborn dried blood-spot specimens using a multiplexed fluorescent microsphere immunoassay. Clin. Chem. 46, 1422–1424 (2000). 28. Ferguson, J. A., Steemers, F. J. & Walt, D. R. High-density fiber-optic DNA random microsphere array. Anal. Chem. 72, 5618–5624 (2000).
nature materials | VOL 2 | MARCH 2003 | www.nature.com/naturematerials
29. Ferguson, J. A., Boles, T. C., Adams, C. P. & Walt, D. R. A fiber-optic DNA biosensor microarray for the analysis of gene expression. Nat. Biotechnol. 14, 1681–1684 (1996). 30. Wedekind, P., Kubitscheck, U., Heinrich, O. & Peters, R. Line-scanning microphotolysis for diffraction-limited measurements of lateral diffusion. Biophys. J. 71, 1621–1632 (1996).
Acknowledgements The financial support of the IWT and Tibotec is acknowledged with gratitude. Ghent University (BOF, the FWO-Vlaanderen (‘krediet aan navorsers’) and the IWT (Industrial Basic Research Project) are acknowledged for their support through instrumentation credits. We also wish to thank Emmanuel Gustin for useful discussions about the code design, Tom Meyvis for his help with the bleaching experiments and Patrick Van Oostveldt for many fruitful discussions about confocal microscopy. Correspondence and requests for materials should be addressed to S.C.D.S
Competing financial interests The authors declare that they have no competing financial interests.
173