Energy-Monitoring Tool for Low-Power Embedded Programs Dongkun Shin, Hojun Shim, Yongsoo Joo, Han-Saem Yun, Jihong Kim, and Naehyuck Chang Seoul National University
SES is a highly integrated tool that delivers cycleby-cycle power consumption data for optimizing embedded programs. Designing cost-sensitive embedded products such as cellular phones and portable media players requires maximizing a platform’s performance while minimizing energy use. For example, if two software implementations of an MPEG-4 decoder perform quite differently on the same target platform, clearly the more efficient version will result in a more cost-effective product. Developing efficient embedded software requires a wide range of knowledge and skills. Programmers must have a good understanding not only of the target algorithms and target processor’s intricacies, but also of a program’s overall performance behavior. For example, if a program execution incurs extra performance overheads from resource conflicts, such as conflict cache misses, programmers should identify and eliminate the problems for maximum performance. In addition, programmers should be able to remove hot spots that could degrade a program’s overall performance. Unfortunately, even experienced programmers have difficulty predicting and identifying hot spots and performance bottlenecks. Therefore, designing highly efficient embedded July–August 2002
programs requires efficient tools to support performance monitoring and tuning of embedded software. Several such tools are available for various embedded processors. For example, profilers such as MULTI can optimize program execution time.1 With the recent, explosive market growth of mobile embedded devices, low power consumption has become an important design constraint. To effectively meet the energy consumption requirements of embedded systems, programmers need to understand the energy and power consumption of embedded systems as a high-priority monitoring target. Although vendors offer several low-power design tools, most are specialized for analyzing the energy and power consumption of embedded systems in lower levels of design abstraction such as circuit or gate levels, which makes them unsuitable for embedded software development.2
Energy-monitoring tool requirements When developing low-power embedded programs, programmers have specific requirements for energy-monitoring tools. ■
The tool should produce accurate analysis results reasonably fast. The tool should give accurate results so that programmers can make correct decisions for reducing a program’s energy consumption. Further, because
0740-7475/02/$17.00 © 2002 IEEE
Authorized licensed use limited to: Univ of Calif Irvine. Downloaded on November 15, 2008 at 12:56 from IEEE Xplore. Restrictions apply.
7
Embedded Systems
■
■
■
programmers repeatedly revise embedded programs multiple times to satisfy design constraints, the tool must produce the analysis results quickly. Designers should seamlessly integrate the energy-monitoring tool with functional debugging tools such as the GNU project debugger. Because programmers use functional debuggers for a variety of program development in embedded systems, the energy-monitoring tool should be easily integrated with the debugger. Further, the debugging and energy-monitoring tools should share the same user interface so that programmers of embedded systems don’t need to learn a new user interface. The energy-monitoring tool should present its results in a user-friendly format. Because its users are unfamiliar with power and energy issues, the tool should display the monitoring results at the program-source level, a comfortable abstraction level for programmers of embedded systems. The energy-monitoring tool should not require hardware or software resources, such as extra measurement equipment, that are not commonly available to the average embedded-systems programmer. For example, tool designers should not assume that each programmer has access to a high-end digital multimeter.
Drawbacks of current estimation tools We categorize existing energy estimation and monitoring techniques based on the two methods a tool uses to acquire energy consumption information: simulations or measurements. Programmers find simulation-based energy estimation techniques convenient if appropriate simulation models are available.2-5 For example, a power-analysis tool such as QuickPower can accurately estimate the energy consumption in the lower abstraction levels, such as the switch or gate levels.2 These tools are reasonably accurate in predicting power consumption and are useful during hardware development. However, they are not appropriate for embedded software development
8
because they are too expensive and slow for average programmers to find them useful. Power analysis tools present energy estimation results for major hardware blocks of the target system, such as an ALU block, but programmers of embedded systems have difficulty linking these results with the program source code. For low-power software development, instruction- or architecture-level energy simulators such as Wattch and SimplePower might be better solutions.3,4 These simulators estimate the power consumption of microprocessor-based systems more quickly and at a lower cost than lowerlevel power analysis tools. However, these tools suffer from low estimation accuracy, which makes meaningful energy tuning difficult. For example, Ghiasi et al. show that different energy simulators can produce contradictory results for the same application running on the same hardware platform.6 The second category of energy estimation techniques actually involves measuring a system’s energy or power consumption.7 In general, measured energy consumption results are quite accurate. However, this estimation technique doesn’t easily obtain correct measurements because digital systems typically consume energy in spikes of usage at frequencies of hundreds of MHz. Therefore, these actual measurements might not be accurate when the measurement equipment cannot sample the range of power data at very high rates. Existing measurement-based estimation techniques require measurement equipment that most programmers of embedded systems wouldn’t normally have. And even if programmers of embedded systems have access to this equipment, they might lack the skills to properly operate it.
Energy estimation and analysis tool We developed the Seoul National University energy scanner (SES)to overcome these drawbacks. SES is a highly integrated, energymonitoring tool that collects power consumption data in a cycle-by-cycle resolution and associates the collected power data with C program and assembly language source code. SES does not require any additional measurement equipment because the power measurement IEEE Design & Test of Computers
Authorized licensed use limited to: Univ of Calif Irvine. Downloaded on November 15, 2008 at 12:56 from IEEE Xplore. Restrictions apply.
C program
Compiler
Host PC Host PC User interface
Control input
Program loader
Execution and energy information
Energy analysis module Profile-matching module
CPU energy analyzer
Memory energy estimator
Hardware-software PCI interface
Energy estimation module
Controller
Memory
Energy measurement board Energy Measurement Board (ARM7TDMI) (ARM7TDMI)
Profile acquisition module
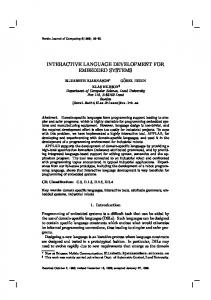
Figure 1. SES architectural overview including the user interface, energy analysis module, and energy estimation module.
circuitry is embedded in its board.8 By presenting energy-monitoring results at the C source or assembly language levels using the GNU project debugger (GDB)-like user interface, SES helps users identify potential energy hot spots in embedded programs. The current version of SES works for ARM7TDMI-processor-based embedded systems. However, the proposed power measurement technique and its overall energy-monitoring methodology are both platform independent. SES overview SES has three logical modules: energy estimation, energy analysis, and user interface. Figure 1 shows the overall SES architecture. The energy estimation module consists of the energy measurement board and the memory energy estimator. The board is a peripheral component interconnect (PCI) bus expansion card that uses a real-time profile acquisition module to collect a target application’s cycleaccurate system traces. The PCI local-bus interface transfers the collected system traces to the
host PC, which runs a Linux operating system. The energy measurement board includes the ARM7TDMI processor core with its controller, profile acquisition module, program memory, and PCI controller, as Figure 2 (next page) shows. The profile acquisition module consists of the cycle-accurate energy measurement circuit, acquisition memory, and profile controller. The energy measurement board works as an ARM7TDMI emulator equipped with the cycle-accurate energy measurement circuit. A system trace collected from the board includes a cycle-level energy trace of the processor core and a cycle-level memory trace. The memory energy estimator running on the host PC is a software memory simulator with cycle-accurate energy models for various caches, memory buses, and memory devices. The measurement board transfers the memory traces as inputs to the memory energy estimator and the estimator produces the cycle-level energy profile of the off-chip memory system and cache memory. The energy analysis module matches the
July–August 2002
Authorized licensed use limited to: Univ of Calif Irvine. Downloaded on November 15, 2008 at 12:56 from IEEE Xplore. Restrictions apply.
9
Embedded Systems
Program memory
ARM7TDMI controller
PCI controller
ARM7TDMI core
Profile controller
Measurement circuit
Profile acquisition module
Acquisition memory
Figure 2. SES energy measurement board, including the ARM7TDMI processor core.
cycle-level energy profile of the target processor and memory system to the program’s source code. The module associates the energy profile with the source code at three different levels: C source, assembly language, and C function. Users can interact with SES using the standard GDB-like, graphical user interface shown in Figure 3. The main display window lists the source code of the program that SES is monitoring. The menu bar shows various functions useful for monitoring a program’s energy profile. Through the menu bar, users can compile the source code, specify the profile region, set breakpoints, and download the executable binary to the energy measurement board. The program segment between lines 27 and 32 in Figure 3a is the current energy profile region. Users can select a display that shows one of three supported modes: C source, assembly, or mixed mode with both shown together. For function-level energy monitoring, the display screen shows the energy consumption profile using the energy distribution graph, shown in Figure 3a. Programmers find this graph useful for quickly identifying a program’s energy hot spots. Energy information in Figure 3a is associated with each C statement in the C source display mode and each assembly instruction in
10
the assembly display mode. The energy information consists of the following data: total CPU core energy consumption, total memory system energy consumption, and cache miss rate. For example, line number 32 of Figure 3a indicates that the C statement consumed 12.38 nJ at the CPU core and 18.24 nJ at the memory system. Energy estimation module SES estimates a target application’s energy consumption in a hybrid fashion. SES directly measures the CPU core’s energy consumption while it uses a memory-power model to calculate the memory system’s energy consumption from collected memory traces. Energy measurement board. In addition to the target ARM7TDMI embedded processor and program memory, the energy measurement board includes a profile acquisition module. This module measures the cycle-by-cycle energy consumed by the target embedded processor and collects cycle-by-cycle memory access traces. Because one of SES’s main roles is to quickly identify energy hot spots, we designed the energy measurement board to gather sufficient system information. With this information, SES can accurately restructure a detailed snapshot of system activity. Based on the collected information, IEEE Design & Test of Computers
Authorized licensed use limited to: Univ of Calif Irvine. Downloaded on November 15, 2008 at 12:56 from IEEE Xplore. Restrictions apply.
SES can correctly attribute appropriate energy costs to each instruction or C statement. We based SES’s CPU energy profiling on an energy measurement technique developed by Chang et al.8 Unlike conventional energy measurement techniques based on the voltmeter or digital oscilloscope, this technique can measure energy consumption accurately with a small number of samples. Conventional energy measurement techniques rely on instrumentation of the voltage across a series resistor in the power supply line. The power spectrum of the voltage across the resistor is dominant up to 1/2tf, where tf is (a) the shortest fall time of the signal, often 2 ns or less. Thus, measurement equipment should Menu bar sample the voltage at a very high rate for reasonable accuracy. For complex systems, the Source area high sampling requirement makes both the Energy distribution graph energy measurement and energy analysis steps (by procedures) Summary window for more difficult. the energy profile In contrast, SES achieves similar measureof selected region ment accuracy with fewer samples. SES measures the exact amount of energy consumption Energy information by instrumentation of the charge transfer, as (CPU energy Selected region consumption, memory Figure 4 shows. The switch pairs, connected by energy consumption, the dashed lines, repeat on and off actions alterand cache miss rate) nately. The power supply charges the C1 and C2 Break point capacitors (which have the same capacitance) with Vs during a clock cycle, and the processor (b) discharges them during the next cycle. Because Ci initially stores the energy of 1/2CiVCi2, we can Figure 3. Screen shot (a) and schematic diagram (b) of calculate the difference between the initial the SES user interface. energy and the remaining energy stored in Ci to estimate the energy consumed at the clock cycle. Nonoverlapping node ϕ1 Figure 5 (next page) shows the Switch difference between conventional control power-measurement techniques ϕ2 and the SES technique. Conventional techniques use the voltVC meter, which can only measure VS C1 Real-time VM acquisition the average power consumption, VC or the high-bandwidth digital oscil+ loscope, which can capture the Field− programmable voltage envelope. The high-bandPower supply gate array Target C2 width digital oscilloscope, which vector processor generator is more accurate than the voltmeter, can be error-prone in acquiring the voltage envelope— Figure 4. Real-time, cycle-accurate, energy measurement circuit. 1
2
July–August 2002
Authorized licensed use limited to: Univ of Calif Irvine. Downloaded on November 15, 2008 at 12:56 from IEEE Xplore. Restrictions apply.
PC
11
Embedded Systems
Clock FSM ϕ1 ϕ2 iDD VC1 VC2 VM
(a)
(b)
Figure 5. Conventional power measurement compared with new cycle-accurate energy measurement using switched capacitors: sampling points of the conventional (a) and new cycle-accurate (b) techniques.
and thus the energy consumption—because the power spectrum is usually significant up to hundreds of MHz, as Figure 5a shows. On the other hand, the SES technique requires only two samples per clock period, as Figure 5b shows. Because SES requires much fewer samples to achieve accuracy comparable to existing techniques, we can build an affordable data acquisition system for energy measurement in the field using commercial offthe-shelf components. SES requires fewer samples because the capacitor voltage’s transient state does not affect the measurement process; the technique finds only the initial and final voltages meaningful. SES eliminates the noise more easily with only two samples. In addition, we compensate for the effect of the on- and offchip bypass capacitors during measurement, both of which are connected in parallel to the power supply and ground rails. Memory energy estimator. Instead of directly
measuring the memory system’s energy consumption, SES uses a trace-driven memory
12
energy simulator. The simulator estimates memory energy consumption with memory traces and memory energy models. The energy measurement board collects memory traces and transfers them to the memory energy simulator. A memory trace consists of address bus, data bus, and control signals sampled at each cycle. SES takes a hybrid approach to estimating memory power consumption. Manufacturers of embedded-systems products commonly develop a family of products rather than a single product. Products in the same family line are usually based on the same embedded microprocessor but have different memory configurations. A hybrid approach is more useful for embedded systems because a single energy measurement board can be used across the complete line by simply modifying the memory system configuration. Further, unlike software-based CPU power estimation, a software power model can accurately estimate a memory’s energy consumption. The memory energy simulator includes a cache simulator and estimates the memory system’s energy consumption based on the current configuration of the cache, memory, and bus. The cache simulator divides memory traces into cache hits and misses. SES then uses the cache-miss memory traces to estimate the energy consumption of the external memory system. The existing literature has buildable examples of software power models for the cache, external memory, and bus.9 A user can easily change the cache configuration, memory, or bus by modifying the corresponding configuration parameters. By exploiting this reconfiguration function of the memory energy estimator, programmers can use SES in exploring the design space of energy-efficient memory systems. The cache simulator design assumes separate instruction and data caches. The user can configure the index size, associativity, cache block size, and the cache’s replacement policy. Similarly, the memory controller can configure the bus clock frequency, burst length, CAS latency, burst refresh, precharge mode, and so forth. For the bus, the user can configure the bus drivers, driver I/O capacitance, transmission line capacitance, and load capacitance. IEEE Design & Test of Computers
Authorized licensed use limited to: Univ of Calif Irvine. Downloaded on November 15, 2008 at 12:56 from IEEE Xplore. Restrictions apply.
Energy analysis module To provide users with source-level energy consumption information, SES matches the cycle-level energy profile to the source code at three different levels—assembly, C source, and function—in the energy analysis module. Because the ARM7TDMI processor has a three-stage pipelineinstruction fetch, instruction decode, and executewe found associating the energy measurement data with the corresponding instruction to be a little tricky. For example, when the energy measurement board samples a single energy consumption data at time t, the processor executes three different instructions simultaneously. Because it is impossible to accurately divide the measured energy cost among three executed instructions, SES attributes the measured energy to the instruction in the execute stage. As the instruction fetch and instruction decode stages work similarly regardless of the instruction types being fetched or decoded, we believe that our approach is reasonable. SES handles more complex instructions—like multicycle, memory-access, and branch—slightly differently in attributing the energy profile to the instructions. After matching the energy profile to assembly instructions, SES uses the assembly-level energy information to construct the C-sourceand function-level energy information. When a compiler heavily optimizes a program—such as under the-O2 option in the armcc compiler—an assembly instruction might not be matched to a single C statement. In this case, a group of assembly instructions is associated with a region of multiple C statements.
Energy monitoring examples Two energy monitoring examples demonstrate how designers can use SES to develop energy-aware software. Both case studies assume that the ARM7TDMI core runs at 266 MHz with the instruction and data caches each configured as 4K-byte, two-way, set-associative caches. MPEG-4 energy optimization To show how programmers can use SES for optimizing an embedded application’s energy efficiency, we started with a video-decoder program adopted from the MPEG-4 video verifica-
tion model. The video decoder implements only the simple profile and does not support shaped video objects. SES monitoring results showed that the original version of the MPEG-4 video decoder, denoted as Porig, consumed 225,353 µJ and took 33 million cycles to decode a sequence of four picture frames (an IPPP). Figure 6a (next page) shows the energy distribution of Porig using the per-procedure energy distribution graph. The idct procedure consumes a significant amount of energy. An analysis of the caller-callee relationship verifies that the next four largest energy-consuming procedures—_dadd, _fp _mult_common, _fp_addsub_comm, and _dmul—are library routines, all of which simulate floating-point operations. These routines were necessary because the ARM7TDMI processor did not have a separate floating-point coprocessor. As Figure 6b shows, to reduce the overhead of simulating floating-point operations using library routines, the second version of the MPEG4 video decoder, denoted Pfixed, implemented a fixed-point version of the idct module. This MPEG version reduced energy consumption of the idct procedure by 72.8%, from 37,756 µJ to 10,264 µJ. This version reduced the total energy consumption by 61.8% compared to Porig. In Pfixed, however, the programmer moves energy hot spots to the predict, addpredict, and clearblock procedures. The predict and addpredict procedures implement motion compensation, while the clearblock procedure implements array initialization for the coded image blocks. SES’s monitoring of these routines showed that they introduce many unnecessary cache misses from redundant copy and initialization operations. The third version of the video decoder, Pmem_opt, removed these redundant operations. As Figure 6c shows, this version consumed 20% less than Pfixed. The predict and addpredict procedures of Pmem_opt consumed 35% less than Pfixed. Pmem_opt merged the predict and addpredict routines into the predict routine. The energy consumption of the clearblock procedure is reduced by 50% as well. The getblock procedure’s energy consumption increased because this version moved some of the clearblock procedure’s operations to the getblock pro-
July–August 2002
Authorized licensed use limited to: Univ of Calif Irvine. Downloaded on November 15, 2008 at 12:56 from IEEE Xplore. Restrictions apply.
13
Embedded Systems
Procedures
idct _dadd __fp_mult_common __fp_addsub_common _dmul predict addpred __fp_e2d clearblock copyref getpicture copyblk getblock iquant_intra __fp_norm_op1 others
CPU Memory
0
10
5
(a)
15 20 25 Energy consumption (mJ)
30
40
Procedures
predict addpred idct clearblock copyref getpicture copyblk getblock iquant_intra fillbfr getbits1 showbits getbits iquant_non_intra getmvdata others
35
CPU Memory
0
5
(b)
10 15 Energy consumption (mJ)
Procedures
predict idct copyref getblock clearblock copyblk getpicture iquant_intra getbits1 fillbfr getbits showbits iquant_non_intra flushbits init others
20
CPU Memory
0 (c)
5
10 15 Energy consumption (mJ)
20
Figure 6. Energy distribution for the original MPEG-4 video decoder program, Porig (a); the second version of the decoder program, Pfixed (b); and the third version, Pmem_opt (c).
14
cedure. Doing so, however, reduced the total energy consumption of both the clearblock and getblock procedures. Reducing loop overhead further improved the energy efficiency of several procedures. Figure 7 shows partial energy-monitoring results of the predict procedure of Pmem_opt. SES annotates each C statement with the CPU energy consumption, memory energy consumption, and cache miss rate. In Figure 7, assembly instructions at addresses 0xdd0, 0xdd4, and 0xdd8 correspond to the for statement of line 641. These instructions consume 425,928 nJ, which is about 7% of the selected region’s total energy consumption. Because the loop body, line 642, only has 10 instructions, three loop-overhead instructions consume a relatively large amount of energy. In the fourth version of the MPEG-4 decoder, Ploop_opt, we unrolled several loops, such as the one in the predict procedure. This version consumes 14% less energy than Pmem_opt. The SES monitoring results for all four versions of the MPEG-4 video decoder program showed that the memory system consumes a large portion of the total energy. To see whether program size affects energy consumption, we compiled the Ploop_opt version of the MPEG-4 video decoder program for the Thumb instructions, denoted as PThumb. Although this change decreased the program size of PThumb by 4%, the energy consumption increased by 28% compared to Ploop_opt. An increase in execution time of 38% caused PThumb’s increased energy use compared to Ploop_opt. Table 1 shows that the final version, Ploop_opt, consumes only 26.4% of the energy that Porig consumes.
IEEE Design & Test of Computers
Authorized licensed use limited to: Univ of Calif Irvine. Downloaded on November 15, 2008 at 12:56 from IEEE Xplore. Restrictions apply.
Energy characterization of embedded Linux As embedded applications become more complex, many run on top of real-time operating systems. We use SES to characterize the energy consumption of µClinux, an embedded Linux operating system.10 Although the literature contains information about the energy characterization of small operating systems such as µC/OS and eCos, to the best of our knowledge, this is the first analysis of embedded Linux’s energy consumption.11,12 We ported the µClinux operating system, a variant of an embedded Linux, to the SES board. We focused on characterizing the energy consumption of µClinux system Figure 7. Partial energy monitoring results of the predict procedure of Pmem_opt. calls and standard library functions, as Table 2 (next page) shows. These results can help programmers and cpy, atoi, and malloc—have energy conapplication developers select the most energy- sumption dependent on the current system staefficient system calls or library functions for tus as well as input arguments. For strcpy implementing energy-efficient programs on top and atoi, energy consumption linearly of embedded operating systems. For example, depends on the input parameter value—that is, in Table 2, systems can use both open and string length. SES can represent the energy confopen before accessing a particular file. sumption of strcpy and atoi as a function Because the fopen library function consumes of input parameters as follows: about 3.11 times more energy than the open system call, choosing the open system call is a E(strcpy, n) = 42.62 nJ × n + 334.58 nJ more energy-efficient implementation, but it E(atoi, n) = 40.29 nJ × n + 269.71 nJ might require more custom code. Making this type of optimization decision requires an under- where n is the length of the input string to strstanding of the exact energy gains from choos- cpy and atoi. ing lower-level operating-system primitives. The malloc function has a more compliUnlike those listed in Table 2, some system cated energy consumption behavior because calls and library functions—including str- the current status of memory allocation, as well Table 1. The energy consumption of the five versions of the MPEG-4 video decoder program. Program
Energy (nJ)
Cycles
Normalized energy
Optimization policy
Porig
225,353,964
33,190,594
1
No optimization
Pfixed
86,062,153
13,306,996
0.382
Fixed-point operations
Pmem_opt
69,586,309
10,956,664
0.309
Redundant-array copies and initializations removed
Ploop_opt
59,584,068
9,535,632
0.264
Loop unrolling
PThumb
76,531,291
12,348,761
0.340
Thumb instructions
July–August 2002
Authorized licensed use limited to: Univ of Calif Irvine. Downloaded on November 15, 2008 at 12:56 from IEEE Xplore. Restrictions apply.
15
Embedded Systems
Table 2. Energy consumption of µClinux system calls and standard library functions. System calls Function
Average (nJ)
Library functions Function
Average (nJ)
open
20,523
fopen
63,880
wait
2,112
fclose
17,492
pipe
12,680
fputc
765
1,148
fgetc
547
stat
34,484
srand
453
chmod
41,348
rand
799
nice
1,350
time
1,311
mmap
1,583
setjmp
chdir
24,981
remove
39,370
create
47,254
rename
51,523
vfork
70,849
isupper
65
getpid
368
as the input parameter value, affect the energy consumed by malloc. SES characterizes the energy consumption of malloc as E(malloc,n) = 3.87 nJ × n + 4825.68 nJ + = E(get_free_page) × k = 3.87 nJ × n + 4825.68 nJ + = 2239.75 nJ × k where the get_free_page function allocates a memory page, n denotes the size of the requested memory block, and k denotes the number of get_free_page invocations during the malloc execution. The malloc function in µClinux allocates a requested memory block from the free pages previously allocated by the get_free_page function. If no free page is available, the malloc function calls the get_free_page function and allocates a new free page from system memory. The energy characterization equation for malloc is difficult to use because it cannot determine the exact value of k in advance—k depends on the free pages’ status. An alternative is to estimate the upper bound of k. When the size n of a requested memory block is smaller than page size p, the malloc function calls the get_free_page function at most once. When size n of a requested memory block is larger than page size p, the system calls the function at most n/p times. Therefore, the value of n/p can bound the value of k. Using the upper bound on
16
k, we can bound the energy the malloc function consumes as follows: E(malloc, n)≤ 3.87 nJ × n + 4825.68 nJ + 2239.75 nJ × n/p
TOOLS LIKE SES greatly simplify the challenging task of developing low-power embedded programs. With the fast-growing mobile market, we expect to see similar software development tools that focus on reducing the energy consumption of embedded programs. The current version of SES focuses on the energy consumption of the computation functions of embedded software. We plan to extend SES for the more networked mobile devices coming to market. We will develop SES into a complete system-level tool by monitoring the energy consumed by the communication functions of networked mobile devices. ■
Acknowledgments We thank Hyung Gyu Lee and Yongseok Choi for their assistance in developing the SES hardware board and Jungmin Yoon for his help with the embedded Linux case study. Dongkun Shin, Han-Saem Yun, and Jihong Kim were supported by grant No. R01-2001-00360 from the Korea Science and Engineering Foundation. The Research Institute of Advanced Computer Technology at Seoul National University provided research facilities for this study.
References 1. Green Hills Software Inc., The MULTI Performance Profiler, http://www.ghs.com/ products/MULTI_IDE.html (current May 2002). 2. Mentor Graphics Corp., QuickPower, http://www.mentor.com (current May 2002). 3. D. Brooks, V. Tiwari, and M. Martonosi, “Wattch: A Framework for Architectural-Level Power Analysis and Optimizations,”Proc. Int’l Symp. Computer Architecture (ISCA 2000), IEEE CS Press, Los Alamitos, Calif., 2000, pp. 83-94. 4. W. Ye et al., “The Design and Use of SimplePower: A Cycle Accurate Energy Estimation Tool,” Proc. 37th Design Automation Conf. (DAC 00), ACM Press, New York, 2000, pp. 340-345.
IEEE Design & Test of Computers
Authorized licensed use limited to: Univ of Calif Irvine. Downloaded on November 15, 2008 at 12:56 from IEEE Xplore. Restrictions apply.
5. T. Simunic, L. Benini, and G. De Micheli, “CycleAccurate Simulation of Energy Consumption in Embedded Systems,” Proc. Design Automation Conf. (DAC 99), ACM Press, New York, 1999, pp.
power systems and embedded systems. Shim has a BS in computer science and engineering from Seoul National University. He is a student member of the IEEE.
867-872. 6. S. Ghiasi and D. Grunwald, “A Comparison of Two Architectural Power Models,” Proc. Workshop Power-Aware Computer Systems (PACS 01), Lecture Notes in Computer Science, Springer-Verlag, Heidelberg, Germany, vol. 2008, 2001, pp. 137-152.
7. J. Flinn and M. Satyanarayanan, “Powerscope: A Tool for Profiling the Energy Usage of Mobile Appli-
Yongsoo Joo is a PhD student at the School of Computer Science and Engineering, Seoul National University. His research interests include low-power and embedded systems. Joo has a BS and MS in computer science and engineering from Seoul National University. He is a student member of the IEEE.
cations,” Proc. IEEE Workshop Mobile Computing Systems and Applications (WMCSA 1999), IEEE CS Press, Los Alamitos, Calif., 1999, pp. 2-10. 8. N. Chang, K. Kim, and H.G. Lee, “Cycle-Accurate Energy Consumption Measurement and Characterization, with a Case Study of the ARM7TDMI,” IEEE Trans. Very Large Scale Integration (VLSI) Systems, vol. 10, no. 2, Apr. 2002, pp. 146-154.
Han-Saem Yun is a PhD student at the School of Computer Science and Engineering, Seoul National University. His research interests include parallelizing and optimizing compilers, static program analysis techniques, and embedded systems. Yun has a BS and MS in electrical engineering from Seoul National University.
9. N. Chang et al., “Bus Encoding for Low-Power High-Performance Memory Systems,” Proc. 37th Design Automation Conf. (DAC 00), ACM Press, New York, 2000, pp. 800-805. 10. D.J. Dionne and M. Durrant, “Embedded Linux/ Microcontroller Project,” http://www.uclinux.org (current May 2002). 11. A. Acquaviva, L. Benini, and B. Ricco, “Energy Characterization of Embedded Real-Time Operating Systems,” Proc. Workshop Compilers and Operating Systems for Low Power, Kluwer Acade-
Jihong Kim is an associate professor in the School of Computer Science and Engineering, Seoul National University. His research interests include embedded systems, computer architecture, Java computing, and multimedia and realtime systems. Kim has a BS in computer science and statistics from Seoul National University, and an MS and PhD in computer science and engineering from the University of Washington. He is a member of the IEEE and ACM.
mic, Boston, 2001, pp.30-37. 12. R.P. Dick et al., “Power Analysis of Embedded Operating Systems,” Proc. 37th Design Automation Conf. (DAC 00), ACM Press, New York, 2000, pp. 312-315.
Dongkun Shin is a PhD student at the School of Computer Science and Engineering, Seoul National University. His research interests include low-power systems, computer architecture, and embedded and real-time systems. Shin has a BS in computer science and statistics, and an MS in computer science, both from Seoul National University. He is a student member of the IEEE and ACM. Hojun Shim is a PhD student at the School of Computer Science and Engineering, Seoul National University. His research interests include low-
Naehyuck Chang is an assistant professor in the School of Computer Science and Engineering, Seoul National University. His research interests include embedded and low-power systems. Chang has a BS, MS, and PhD in control and instrumentation engineering from Seoul National University. He is a member of the IEEE and ACM. Direct questions and comments about this article to Jihong Kim, School of Computer Science and Engineering, Seoul National University, Shilim-dong, Kwanak-ku, Seoul, Korea 151-742;
[email protected]. For further information on this or any other computing topic, visit our Digital Library at http://computer. org/publications/dlib.
July–August 2002
Authorized licensed use limited to: Univ of Calif Irvine. Downloaded on November 15, 2008 at 12:56 from IEEE Xplore. Restrictions apply.
17