Energy Profiling using IgProf Kashif Nizam Khan∗† , Filip Nyb¨ack† , Zhonghong Ou† , Jukka K. Nurminen∗† , Tapio Niemi∗ , Giulio Eulisse‡ , Peter Elmer§ and David Abdurachmanov¶ ∗ Helsinki Institute of Physics, Helsinki, Finland † Department of Computer Science, Aalto University, Espoo, Finland ‡ Fermilab, Batavia, USA § Department of Physics, Princeton University, Princeton, USA ¶ Digital Science and Computing Center, Faculty of Mathematics and Informatics, Vilnius University, Vilnius, Lithuania Email: †
[email protected], ∗‡§¶
[email protected] Abstract—Energy efficiency has become a primary concern for data centers in recent years. Understanding where the energy has been spent within a software is fundamental for energy-efficiency study as a whole. In this paper, we take the first step towards this direction by building an energy profiling module on top of IgProf. IgProf is an application profiler developed at CERN for scientific computing workloads. The energy profiling module is based on sampling and obtains energy measurements from the Running Average Power Limit (RAPL) interface present on the latest Intel processors. The initial profiling results of a single-threaded program demonstrates potential, showing a close correlation between the execution time and the energy spent within a function. Keywords-Energy Profiler; Profiling; Energy Efficiency;
I. I NTRODUCTION The ever-increasing demand of computation- or dataintensive applications has soared the energy consumption in data centers. As a specific example, the CERN LHC Grid [1] runs more than one million jobs per day and, at peak rate, transfers 10 gigabytes (GB) of data every second. These number are expected to grow continuously in the near future. Meanwhile, the hardware heterogeneity further complicates the situation [2], [3]. Thus, it is vital to improve energyefficiency (from both the internals and externals) of data centers. In this paper, we look at energy efficiency from the data center internals. Specifically, we are interested in understanding where the energy has been spent within a program, at function or module level. This understanding is fundamental to improve energy-efficiency of the whole program. Once we pinpoint the energy hotspots, we can take appropriate approaches to improve them accordingly. There exist a number of application profilers and libraries for profiling the performance of different subsystems of desktops, workstations, and servers. For example, the gprof profiler is part of the GNU binutils collection of development tools, which uses statistical sampling and static function instrumentation to perform the profiling. The Google Performance Tools (google-perftools) comprises an implementation of the memory allocation function malloc called tcmalloc, a heap checker, a heap profiler, and a CPU profiler (performance profiler). OProfile relies on hardware
performance counters when measuring the performance of an application. Intel VTune is a commercial profiler that relies on hardware performance counters and timers. It reports the execution time spent in functions and code segments. HPCToolkit is a collection of tools that focus on parallel programs and rely on statistical sampling for performance profiling. IgProf [4] is an application profiler that measures and analyses the memory and performance characteristics of programs. The key benefit of IgProf is that it operates completely in user space and does not require root privileges and can handle dynamically loaded shared libraries. Nevertheless, none of the profilers mentioned above include an energy profiling module, which makes energy profiling within a program largely an untouched domain. In this paper, we are taking initial efforts towards that direction by providing an energy profiling module on top of IgProf. By leveraging the latest Running Average Power Limit (RAPL) interface [5] on Intel X86 architecture, we build an energy profiling module on IgProf to evaluate energy distribution within an application. Preliminary results demonstrate good potential. We find out that the energy consumption of individual functions has a good correlation with its respective performance. II. BACKGROUND In this section we discuss the basics of IgProf and Performance API (PAPI) library [6]. The proposed energy profiler module in IgProf uses PAPI library to obtain energy measurements from RAPL interface. A. IgProf IgProf is a profiler developed within the Compact Muon Solenoid (CMS) experiment at CERN (the European Organization for Nuclear Research). The CMS software is used to analyse data and perform simulations related to CMS experiments. Unlike other profilers, e.g. gprof, IgProf does not require the application to be recompiled or relinked before profiling. The main principles of operation are statistical sampling and dynamic instrumentation of functions. B. PAPI PAPI is an open source performance library that provides a platform independent interface to hardware performance
counters. PAPI uses the perf events interface of the Linux kernel as of version 2.6.32. If earlier versions of Linux are used, PAPI uses the perfctr or perfmon interfaces. PAPI does not require any special compilation of the application being profiled and supports profiling dynamically loaded libraries [7]. PAPI is actively developed and support for measuring energy consumption with RAPL has recently been added [6]. This is one of the features that inspires us to use PAPI library in the energy profiling module added to IgProf. C. The RAPL interface Recent Intel processors (SandyBridge processors and later) implement the RAPL interface that allows energy usage to be limited and monitored. The interface is implemented as model-specific registers (MSR) in the processor. The registers are updated approximately once every millisecond and the energy measurements are reported in units of 15.3 µJ. The RAPL interface provides energy measurements for four energy domains: processor package, power plane 0, power plane 1, and DRAM. A processor package describes a processor die that can contain multiple cores, on-chip devices and other uncore components (components other than the cores) [5]. A computer can have several processor packages and each processor package provides its own energy measurement. Power plane 0 (PP0) describes the CPU cores. In recent desktop and server grade processors, there are usually multiple cores in one processor package. Power plane 1 (PP1), on the other hand, describes some “specific device in the uncore”. The components of a processor package that are not part of the cores are referred to as the uncore collectively. In practice an on-chip graphics processing unit (GPU) is usually a PP1 component on desktop grade processors [5]. The DRAM plane describes energy consumption of directly attached DRAM. Energy measurements for processor packages and PP0 are available on desktop and server grade processors. PP1 is available only on desktop grade processors and not on server grade processors. The DRAM plane is available on server grade processors from Intel. There are few important issues that should be kept in mind when using RAPL; firstly, RAPL values are not actual measurements but modeling of architectural events and secondly the individual RAPL updates do not have any timestamps and so it is difficult to keep track of the actual RAPL updates realtime [8]. III. E NERGY PROFILING IN I G P ROF The new energy profiling module obtains energy measurements from the RAPL interface at a constant interval and attributes the current energy measurements to the current location of execution. In this section we provide a brief description of its principle. A. Usage of the PAPI library IgProf does not read the MSR files directly, but uses the PAPI library as an interface. This has the advantage
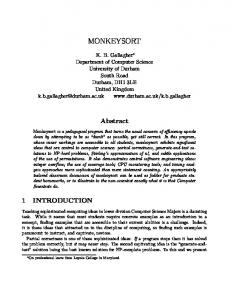
of decoupling IgProf from the msr kernel module. When new energy measurement components become available, little work is needed to make use of these components through PAPI. Recent processors of the AMD family 15h provide power measurements through a model-specific register. There are also plans to support this interface in future versions of PAPI [9]. The energy profiling module performs the following five steps to prepare PAPI for energy measurements: 1) the PAPI library is initialized; 2) the RAPL component of PAPI is located; 3) an event set containing RAPL events is created; 4) memory is allocated for the energy readings; 5) the event set is activated. The first step is to ensure that the version of the PAPI shared library (available at the time of execution) is compatible with the version of PAPI that is used when the application (e.g. IgProf) is compiled. The second step locates the RAPL component. The third step is to create an event set. In our case, it is an RAPL event that represents a certain amount of energy being used by a component in one of the four energy domains of RAPL. The fourth step is to allocate space for two arrays. One array is used to store the most recent energy readings, whereas the other array contains the previous readings. Finally, as the fifth step, the event set created in step three is activated. B. The energy profiling module When the initialization is completed successfully, and IgProf has set up the signal handler and the interval timer, the energy profiling module is running. Figure 1 illustrates how the energy profiling module operates. At a certain interval the current energy consumption and location of execution are sampled. The difference between the current and the previous energy readings is attributed to the current location of execution. E
amount of energy
t update interval of RAPL registers ∼1 ms
Figure 1.
sampling interval ∼5 ms
Principle of operation of the energy profiling module.
The energy profiling module uses four counters to represent energy consumption of the four RAPL energy domains: the NRG PKG for all processor packages, the NRG PP0 counter for all the cores, the NRG PP1 counter for all the PP1 components, and the NRG DRAM counter for all the DRAM components. Because only three of the four
The energy profiling module is evaluated in two ways. First, the total energy consumption of an application measured by the energy profiling module is compared with the energy consumption measured by a separate energy measurement tool. This comparison evaluates how the energy profiling module distributes the energy over the energy domains as a whole. Second, energy profiles of applications are compared with performance profiles. The results of this comparison indicate certain correlation between energy and time spent in functions. The measurements in this section are conducted on a desktop computer equipped with an Intel Core i7 processor. A small tool is written that measures the energy consumption over the whole execution of an application. The tool, measure-rapl, uses the PAPI library to obtain energy measurements from the RAPL interface. The preexisting likwid tool set [10] provides similar functionality. However, the likwid tool set does not account for overflows in the 32bit RAPL registers, a shortcoming that is addressed in the measure-rapl tool. Figure 2 depicts the total energy consumption as measured by the measure-rapl tool and the energy profiling module of IgProf. The application being measured and profiled is a simple test program performing insertion sorting. The first four sets of measurements show the energy as measured by the measure-rapl tool. The following four sets of measurements show the energy as measured by the energy profiling module of IgProf. The values in each energy domain are very similar
nrg_pp0 nrg_pp1
m ea s
ur e-‐ ra m pl ea su re -‐ra m pl ea su re -‐ ra m p ea l su re -‐ra pl Ig Pr of Ig Pr of Ig Pr of Ig Pr of
Energy (J)
nrg_pkg
Figure 2. Energy consumption as measured by the measure-rapl tool and the energy profiling module of IgProf.
between the different sets of measurements, both between sets of measurements from the same tool and between the two tools. The same finding is observed when the energy consumption of the stream benchmarking tool and a piece of CMS software (described below) is measured with both the energy profiling module and the measure-rapl tool. The stream benchmarking tool [11] is profiled for energy consumption and performance using IgProf. The stream benchmarking tool performs four types of vector operations to generate workload, namely, Add, Copy, Scale, and Triad operation. The stream tool is compiled with the -DTUNED flag, in order for the four operations to be implemented as separate functions. 40
700
35
600
30
500
25
400
20
300
15
Energy (J)
IV. E XPERIMENTS AND E VALUATION
400 350 300 250 200 150 100 50 0
Energy measurement tool
Execu.on .me (s)
energy domains usually are available on any processor implementing the RAPL interface, one of the four counters is left unused. The energy profiling module is based on the performance profiling module, because they both make samplings at a regular interval. Both modules utilize an interval timer and a signal handler to implement the sampling. Inside the signal handler, the RAPL measurements are queried through the PAPI library. The energy profiling module keeps the previous set of measurements in order to calculate the delta values. Each delta value together with the current stack trace is added to the counter that corresponds to the energy domain of the delta value. To profile energy consumption using IgProf, the -np or --energy-profiler argument is given to IgProf. The igprof script is extended to recognize and validate these arguments. The output of igprof-analyse comprises a flat cumulative profile, a flat self profile, and a call graph profile. The flat cumulative profile tells how much energy is spent in each function, including the energy spent in child functions; whereas the flat self profile only includes the energy spent in the function itself. The call graph demonstrates the relation between functions, i.e., the parent and child functions of each function.
perf_:cks nrg_pkg
10
200
nrg_pp0
5
100
nrg_pp1
0
0 Add
Copy
Triad
Scale
Func.on
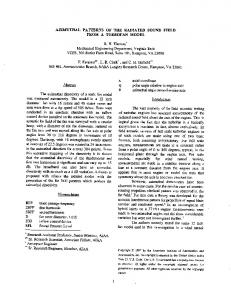
Figure 3.
The results of performance and energy profiling of stream.
Figure 3 shows the results from performance and energy profiling of the stream tool. The X-axis describes the four functions Add, Copy, Triad and Scale. The energy consumption of the processor package domain and the power plane 0 (describing the CPU) appear to follow the time spent in the functions, whereas the energy consumption of power plane 1 (describing the GPU) appears to be fairly constant. In addition to the stream tool, a piece of CMS software is also profiled for performance and energy. The software is multi-threaded, and is much more complex than the simple stream tool. The processing time of the program is around an hour and a half. Figure 4 shows the results from performance and energy profiling of the piece of CMS software. The X-axis describes the top functions, in this case numbered instead of named for brevity. The top twenty functions of
1.4
1600
1.2
1400 1200
1
1000
0.8
800 0.6
Energy (J)
Execu.on .me (s)
the performance profile (self time) and top twenty of each energy domain in the energy profile are shown in the plot. The plot shows 37 functions, which is less than the total number of entries (80) in the four top twenty lists (perf ticks, nrg pkg, nrg pp0 and nrg pp1), because the top twenty lists have many functions in common. Unlike the profiling results of the stream tool (see Figure 3), the profiling results of the CMS software does not show a clear relation between the time and energy spent in a function.
600
0.4
400
0.2
200
0
0 0
5
Figure 4.
10
15
20 Func.on
25
30
35
perf_0cks nrg_pkg nrg_pp0 nrg_pp1
40
Performance and energy profiling of CMS software.
V. C ONCLUSION The total energy consumption measured by the energy profiling module during the whole execution of an application appears to correspond well with the energy consumption measured by a separate energy measurement tool. This is true for both small single-threaded programs and larger multi-threaded software. The profiling results show a correlation between the execution time and the energy spent in a function for the simple single threaded benchmarking tool. There is no obvious relation between energy consumption and execution time for the multi-threaded CMS software though. It is very likely that the multiple threads of the application cause issues, because the energy profiling module does not take into account multiple threads or processes. Another problem that is observed in the energy profiling module is that the energy consumption of short pieces of code executing faster than the update interval of the RAPL registers, i.e. approximately 1 ms, cannot reliably be measured using the RAPL interface without synchronization. A potential solution to this is called HAECER [12], which performs more fine-grained measurements by synchronizing the start of execution of the function to an update in RAPL registers. However, HAECER adds execution overheard to the instrumented program and also requires recompilation of every single program we want to profile which is not the case in our method. The update interval of the RAPL registers is not exactly 1 ms, but has a variation of ±0.02 ms
[12]. This may be critical when measuring short fragments of code, but when profiling big applications the differences in update interval should even out. In the future, we will develop an improved version that has a better strategy for distributing the measured energy over the running threads of the application being profiled and other processes. R EFERENCES [1] G. Hager and G. Wellein, Introduction to high performance computing for scientists and engineers. CRC Press, 2011, iSBN 978-1-4398-1192-4. [2] Z. Ou, B. Pang, Y. Deng, J. Nurminen, A. Yl¨a-J¨aa¨ ski, and P. Hui, “Energy- and cost-efficiency analysis of arm-based clusters,” in 12th IEEE/ACM International Symposium on Cluster, Cloud and Grid Computing (CCGrid), 2012, pp. 115– 123. [3] Z. Ou, H. Zhuang, A. Lukyanenko, J. Nurminen, P. Hui, V. Mazalov, and A. Yl¨a-J¨aa¨ ski, “Is the same instance type created equal? exploiting heterogeneity of public clouds,” Cloud Computing, IEEE Transactions on, vol. 1, no. 2, pp. 201–214, 2013. [4] G. Eulisse and L. Tuura, “IgProf, the Ignominous Profiler,” web page. http://igprof.org/. Accessed 2015-01-29. [5] Intel, Intel 64 and IA-32 Architectures Software Developer’s Manual Volume 3 (3A, 3B & 3C): System Programming Guide, 2014, http://www.intel.com/content/dam/www/public/ us/en/documents/manuals/64-ia-32-architectures-softwaredeveloper-system-programming-manual-325384.pdf. Accessed 2015-01-29. [6] V. M. Weaver et al., “PAPI 5: Measuring power, energy, and the cloud,” IEEE International Symposium on Performance Analysis of Systems and Software (ISPASS), pp. 124–125, 2013. [7] Innovative computing laboratory, Uni. of Tennessee, “PAPI - user guide,” http://icl.cs.utk.edu/projects/papi/ Accessed files/documentation/PAPI USER GUIDE.pdf. 2015-01-29. [8] D. Hackenberg, T. Ilsche, R. Schone, D. Molka, M. Schmidt, and W. Nagel, “Power measurement techniques on standard compute nodes: A quantitative comparison,” in Performance Analysis of Systems and Software (ISPASS), 2013 IEEE International Symposium on, April 2013, pp. 194–204. [9] F. Nyb¨ack, “Improving the support for ARM in the IgProf profiler,” Master’s thesis, Aalto University, 2014. [10] J. Treibig, G. Hager, and G. Wellein, “Likwid: A lightweight performance-oriented tool suite for x86 multicore environments,” in Proceedings of PSTI2010, the First International Workshop on Parallel Software Tools and Tool Infrastructures, 2010. [11] J. D. McCalpin, “STREAM: Sustainable memory bandwidth in high performance computers,” web page. http://www.cs. virginia.edu/stream/. Accessed 2015-01-29. [12] M. H¨ahnel, “Energy/utility for L4Re,” Master’s thesis, Dresden University of Technology, 2012.