Australian Journal of Basic and Applied Sciences, 9(1) January 2015, Pages: 41-50
AENSI Journals
Australian Journal of Basic and Applied Sciences ISSN:1991-8178
Journal home page: www.ajbasweb.com
Enhancement of Loadability Limit of Deregulated Power System via Adaptive RealCoded Biogeography-Based Optimization 1
Ramesh Kumar Arunachalam and 2Dr. Premalatha Logamani
1
Assistant Professor, Department of Electrical and Electronics Engineering, SMK Fomra Institute of Technology, Anna University, Chennai-603103, Tamilnadu, India. 2 Professor, Department of Electrical and Electronics Engineering, Anad Institute of Higher Technology, Anna University, Chennai-603103, Tamilnadu, India. ARTICLE INFO Article history: Received 19 September 2014 Received in revised form 19 November 2014 Accepted 22 December 2014 Available online 2 January 2015 Keywords: Total transfer capability; biogeography-based optimization; adaptive Gaussian mutation; Flexible AC Transmission System; deregulated power system.
ABSTRACT Background: With the growing demand for power in the open market, the augmentation of TTC (total transfer capability) is one solution close at hand. Objective: This paper proposes an algorithm, based on adaptive real-coded biogeography-based optimization (ARCBBO), to determine the optimal location and capacity of FACTS devices such as thyristor-controlled series capacitor and static VAR compensator to increase the loadability and boost power transfer capability of the system. This problem has been considered as an optimal power flow (OPF) based enhancement of total transfer capability. Experiments were performed without and with FACTS devices. The proposed technique aims to improve the searching ability, enhance population diversity and maintain smooth convergence characteristics by using adaptive Gaussian mutation. Results: The proposed algorithm has been tested on standard 30-bus and IEEE 118-bus systems and outcomes compared with those of existing population-based methods. Conclusion: The solution quality of the proposed method is superior over other techniques reported in recent literature. Due to its simple framework, and smooth and quick convergence characteristics, the ARCBBO algorithm is suggested to be ideal to solve the multi-constrained large-scale power systems.
© 2015 AENSI Publisher All rights reserved. To Cite This Article: Ramesh Kumar A. and Dr. Premalatha L., Enhancement of Loadability Limit of Deregulated Power System via Adaptive Real-Coded Biogeography-Based Optimization. Aust. J. Basic & Appl. Sci., 9(1): 41-50, 2015
INTRODUCTION Load growth in a power system is increasing faster than the transmission capability. In the past decade, the increase in transmission capability has been almost 50% of the increased generation capability. The transmission system thus faces several challenges. In the extant open-access power system where everybody can sell or buy energy, there is increasing need for improvements in the transmission capacity of the system whereas maintaining system reliability and security (Y.H. Song and X. Wang, 2003). Due to huge investment for transmission system, determination of loadability limit is an important role for future development of power systems. A loadability limit of power system is related to thermal, voltage stability and security monitoring. It is the margin between the operating point of the system and the maximum loading point. Recently, various techniques are used to determine the maximum loadability limit (G.D. Irisarri et al., 1997), (A. Shunmugalatha and S. Mary Raja Slochanal, 2008), (K. Gnanambal and C.K. Babulal, 2012). The North American Electrical Reliability Council (NERC) has recognized a structure for formative ATC of interconnected networks (NERC report, 1997). Continuation power flow, repeated power flow based approaches were used by various researchers to determine ATC and TTC (G.C. Ejebe et al., 1998), (V. Ajjarappu and C. Christy, 1992), (Y. Ou and C. Singh, 2002). During the evaluation of TTC, the system operator needs valuable information regarding the proficiency of an interconnected network to consistently transfer bulk power between two nodes or between different areas of the network without causing threat to system reliability. It has been well demonstrated that the location of the devices and their control parameters significantly affect TTC, which could be overcome with the use of FACTS devices. The capability of the transmission system has improved with FACTS technology (Xiao Ying et al., 2003), (H. Sawhney and B. Jeyasurya 2004), (N.D. Ghawghawe and K.L. Thakre, 2009), (R. Mohan Mathur and Rajiv K. Varma, 2002), (Y. Xiao et al., 2001), (Y. Xiao et al., 2003). Corresponding Author: Ramesh Kumar A., Assistant Professor, Department of Electrical and Electronics Engineering, SMK Fomra Institute of Technology, Chennai-603103, Tamilnadu, India. E-mail:
[email protected]
42
Ramesh Kumar Arunachalam and Dr. Premalatha Logamani, 2015 Australian Journal of Basic and Applied Sciences, 9(1) January 2015, Pages: 41-50
FACTS devices can offer effective TTC enhancement with low operation and maintenance cost. Several evolutionary algorithms have been used to identify the optimal location and size of FACTS devices. For example, a probabilistic based method was employed for complex and large-scale power systems (M.A. Khaburi and M.R. Haghifam, 2010). A hybrid real-coded genetic algorithm (RCGA) is demonstrated in (T. Nireekshana et al., 2012), and a hybrid mutation particle swarm optimization is demonstrated in (H. Farahmand et al., 2012). Recently, a biogeography-based optimization (BBO) algorithm was proposed for solving optimization problems (D. Simon, 2008). In this approach, islands or habitats were modeled to represent solutions, and immigration and emigration of species between islands denote sharing of features between solutions. For optimization problems of economic load dispatch in power systems, this method has been tested (A. Bhattacharya and P.K. Chattopadhyay, 2010). Adaptive real coded biogeography based optimization (ARCBBO) is developed by implementation of adaptive Gaussian mutation with BBO algorithm. Adopting the ARCBBO technique, the paper aims to enhance loadability limit and TTC with the use of FACTS controllers like TCSC and SVC. Active and reactive power control as well as adaptive voltage magnitude control can be regulated simultaneously by ARCBBO. So, this problem is considered as optimal power flow problem (OPF). ARCBBO is used to solve OPF problem and it has been tested on standard 30-bus and IEEE 118-bus systems. 2. Problem Formulation: ATC is calculated according to the NERC procedure. It is the difference between total transfer capability (TTC) and the sum total of existing transmission commitment (ETC), transmission reliability margin (TRM) and capacity benefit margin (CBM) (NERC report, 1997). TTC is limited by the system characteristics including thermal, voltage and stability limits. ETC is calculated from base case power flow analysis. TRM is usually a constant (i.e. 10% of the TTC). CBM is calculated from the market values of energy contractors. It can be expressed as (1) ATC TTC (TRM CBM ETC)
TTC MinimumThermal ,Voltage, Stability
(2) The goal of intensification of TTC is a multi-constrained optimization problem whose solution is expected to find the best location and size of FACTS devices. The objective function is to maximize the system loadability limit and hence TTC is improved. Repeated power flow method is used to solve the following power flow equations. N pq
Maximize f i
(3)
PDi PDi0 (1 i )
(4)
i 1
TTC
S
k NL
(5)
k
Subjected to (i) Power flow constraints
(6)
QGi Q Di ViV j Gij sin( i j ) Bij cos( i j ) 0 i 1,2,..., N b
(7)
PGim in PGi PGim ax i 1,2,..., N g
(8)
m in m ax i 1,2,..., N g QGi QGi QGi
(9)
PGi PDi ViV j Gij cos( i j ) Bij sin( i j ) 0 i 1,2,..., N b Nb
j 1
Nb
j 1
Vi m in Vi Vi m ax
i 1,2,..., N pq N g
S k S km ax
(10) (11)
where λi is the loadability factor for each load bus, P Gi & QGi are the active and reactive power injected at bus i, PDi & QDi are the active and reactive power demand at bus i, V i & δi are the magnitude and phase angle of voltage at bus i, Gij & Bij are the real and imaginary part of admittance of transmission line, N b, Ng & Npq are the number of bus, number of generator and number of load bus, respectively. S k is the thermal limit of the kth transmission line. min and max represents the minimum and the maximum limits of the parameter, respectively. (ii) FACTS device constraints Here, SVC is used as a reactive power absorption device, as explained in equation (12). 2 QSCV BSVC Vref
(12)
43
Ramesh Kumar Arunachalam and Dr. Premalatha Logamani, 2015 Australian Journal of Basic and Applied Sciences, 9(1) January 2015, Pages: 41-50
100MVAr Q
SVC
100MVAr
(13)
(14) 0.8XL XTCSC 0.2XL where BSVC is the susceptance added by placing SVC in the bus, X TCSC is the reactance added by placing TCSC, XL is the reactance of the line where TCSC is connected, and Q SVC is the reactive power injected at the bus by connecting SVC. Finally, the objective function with all constraints combined for the OPF problem is given by lim 2 Min F G Pg ( PGi PGilim ) 2 Qg (QGi QGi ) V (VLi VLilim ) 2 Pf ( S i S imax ) 2 PDi i N iNg iNpq iNL (15) where G is a constant and Pg , Qg , V and Pf are penalty factors. g
3. Review of Biogeography-Based Optimization: BBO has been proposed by Dan (D. Siman, 2008) as a comprehensive algorithm for solving optimization problems and is based on the study of geographical distribution of species. The BBO approach has two main operators, namely migration operator and mutation operator. 3.1 Migration Operator: Migration is the process by which each individual in the habitat is probabilistically modified by sharing information with other individual solutions. A geographical area with high habitat suitability index (HSI) is said to be well suitable for biological species. It tends to have a large number of species, high emigration rate, and low immigration rate. Suitability index variables (SIVs) are those that characterize the habitat of the species. Therefore, a habitat with a high HSI tends to be more static in its species distribution. A habitat with a high HSI is analogous to a good solution, and a habitat with a low HSI is analogous to a poor solution. The individuals in a habitat share features based on the migration rate. Immigration rate, λ k, and emigration rate, μk, are functions of the number of species in a habitat. When there are no species in a habitat, its immigration rate is maximum. λ k can be found by: k (16) k I 1 n where I is the maximum possible immigration rate, k is the number of species of kth individual, and n is the maximum number of species. μk can be found by: k (17) k E n where E is the maximum possible emigration rate. 3.2 Mutation Operator: Mutation tends to increase the diversity among individuals in a habitat in approaching a better solution. Due to natural events, the HSI of a habitat may change dramatically, resulting in a species count distinct from its equilibrium value. Species count may be associated with a probability value (Pi). If the probability value is very low, an individual’s solution is assumed to have been mutated with other solutions. So, mutation rate of individual solution can be calculated using species count probability, given by: 1 Pi (18) Mi M max Pmax where Mi is the mutation rate, Mmax is the maximum mutation rate, which is a user-defined parameter, and Pmax is the maximum probability of species count. 4. Adaptive Real-Coded Biogeography-Based Optimization: In BBO, Migration operator can improve the performance of BBO. It is used to modify habitat by simply replacing similar kind of habitat that means habitat shares less information from the others. Hence, migration operator is lacking of exploration ability. In order to share more information in between habitats, BBO is inspired with DE, the migration operator is improved by applying DE mutation strategy. The following operation is used as migration operator in this paper, (19) X i X best F ( X r1 X r 2 ) Where Xi is the ith individual, Xbest is the best individual, Xr1 and Xr2 are the random individuals among the total population and F is the scaling factor. In BBO, individuals are encoded by a floating point for the continuous optimization problems and random mutation is used which deficient the exploration ability. In RCBBO (Wenyin Gong et al., 2010), individuals are
44
Ramesh Kumar Arunachalam and Dr. Premalatha Logamani, 2015 Australian Journal of Basic and Applied Sciences, 9(1) January 2015, Pages: 41-50
represented by a D-dimensional real parameter vector, and a probabilistically based Gaussian mutation operator is used, which improves the diversity of the population and its searching ability. The Gaussian mutation characteristic function is given by: (20) X i' X i N ( , i2 ) where N ( , i ) represents the Gaussian random variable with mean μ and variance σ2 . The values of mean and variance are considered 0 and 1, respectively (Wenyin Gong et al., 2010). Generally, a probability-based mutation operation affects the convergence characteristics. Therefore, adaptive Gaussian mutation is applied in the present work to improve the solution of worst half of individuals in the population. In equation (19), μ = 0, and is found using the following equation: 2
i
i
i 1
i m in
F f n
X
m ax i
X
m in
(21)
i
where is the scaling factor or mutation probability, Fi is the fitness value of ith individual, and fmin is the minimum fitness value of the habitat in the population. Adaptive mutation probability is given by m in (22) m ax m ax T Tm ax where m ax 1 , min 0.005 , Tmax is the maximum iteration, and T is the current iteration. The method of adaptive mutation has the ability to prevent premature convergence and hence to produce a smooth convergence. This method of mutation can be easily used with real-coded variables, which have been widely used in evolutionary programming (EP), and hence to carry out local as well as global searches. The pseudo code of an ARCBBO algorithm is given below: Initialize the ARCBBO parameters Generate the individuals (SIV) randomly within their feasible region X k X km in rand (0,1) ( X km ax X km in ) Calculate the fitness (HSI) value for each habitat in the population While halting criteria is not satisfied do Sort the SIVs from best to worst according the fitness value Map the HSI values to the number of species Compute immigrate rate and emigration rate for each individual For i=1 to NP Select Xi according to immigration rate i For j=1 to NP Generate two integer randomly r1≠r2 Select Xj according to emigration rate
j
If rand 0,1 j Xi X
j
Else X i X HSI best F ( X r1 X r 2 ) End If End For End For // Adaptive Gaussian Mutation (Mutate only the worst half of population) For i = (NP/2) +1 to NP For j=1 to Nvar F ij i X i j X i ( j ) Fm in
X ij' X ji Normrnd (0, ij ) End For End For Compute HSI for new habitats Sort SIV from best to worst
45
Ramesh Kumar Arunachalam and Dr. Premalatha Logamani, 2015 Australian Journal of Basic and Applied Sciences, 9(1) January 2015, Pages: 41-50
End While: Generators active power, system loadability factor for each load bus, FACTS devices location and ratings are the individuals (SIV) of the habitat. Fitness value (HSI) is calculated from objective function, equation (15). RESULTS AND DISCUSSION The proposed ARCBBO algorithm is applied to improve the loadabilty limit and enhance the total transfer capability of system under consideration of with and without FACTS devices. Loadability limit and TTC are calculated under intact case and contingency condition. It has been implemented on the MATPOWER 30-bus and IEEE 118-bus systems and the results are presented here. Power flow calculations by Newton–Raphson method were performed using MATPOWER 4.1 (R.D. Zimmerman et al., 2011). The optimal control parameters for the algorithm are chosen from number of simulation results. They are: habitat size = 50, habitat modification probability = 1, immigration probability = 1, step size for numerical integration = 1, maximum immigration and emigration rate = 1, mutation probability= 0.005 and maximum number of iterations = 100. The results show the corresponding objective functions for 50 independent trails. 5.1
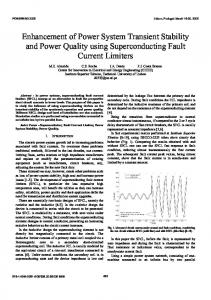
IEEE 30-bus System: The system consists of 6 generator buses and 24 load buses. Bus 1 is taken as slack bus. The system load is 189.2 MW and 107.2 MVAR. The details of bus data and line data are taken from MATPOWER package (R.D. Zimmerman et al., 2011). Convergence characteristic of proposed method for 30 bus system is depicted in Fig. 1, which indicates smooth convergence of ARCBBO. For intact case, loadability limits of each load buses are presented in Table 1. Maximum loadability limit obtained for this system by proposed method is compared with different optimization techniques, is presented in Table 2. Loadability limit obtained by the proposed method is 319.3081MW which is better than result reported in (A. Shunmugalatha and S. Mary Raja Slochanal, 2008), (K. Gnanambal and C.K. Babulal, 2012). TTC is calculated by the proposed method with FACTS and without FACTS devices under intact case and contingency condition, results are presented in Table 3.
Fig. 1: Convergence characteristics of ARCBBO for 30 bus system. Table 1: Active power demand at each load buses for 30 bus system. Bus No. Without FACTS With FACTS 3 16.9486 16.0738 4 25.9129 32.1941 5 21.1438 22.8444 6 22.2846 26.0667 7 6.0826 3.5292 8 18.9991 21.3314 9 11.9278 26.0000 10 0.3365 18.5126 11 7.8250 11.1130 12 23.1213 21.1893 14 1.4763 4.4651 15 6.1937 10.1522
Bus No. 16 17 18 19 20 21 24 25 26 28 29 30
Without FACTS 14.5522 4.8770 10.1016 2.4932 11.6741 0 24.9703 4.0056 3.8875 32.1709 17.3830 6.0409
With FACTS 7.6851 0.2915 0 2.5400 3.7730 4.6822 19.3836 2.4209 6.3852 13.9862 13.3354 13.2127
46
Ramesh Kumar Arunachalam and Dr. Premalatha Logamani, 2015 Australian Journal of Basic and Applied Sciences, 9(1) January 2015, Pages: 41-50
Table 2: Comparison of maximum loadability in MW. System ARCBBO(with ARCBBO(without FACTS) FACTS)
30 bus 118 bus
326.0674 7892.3
319.3081 7855.9
Table 3: Enhancement of TTC for 30 bus system. Case Loadability TTC (MVA) (MW) Intact without FACTS Intact with FACTS Contingency without FACTS Contingency with FACTS
DEPSO (K. Gnanambal and C.K. Babulal, 2012)
DE (K. Gnanambal and C.K. Babulal, 2012) 267.09 5654.3
269.74 5701.56
SVC Capacity (MVAR) -
Line location -
MAHPSO (A. Shunmugalatha and S. Mary Raja Slochanal, 2008) 260.808 5645
TCSC Level of compensation -
319.3081
621.4888
Bus location -
326.0674
632.5870
11
23.0337
28
0.2285
302.8279
577.6207
-
-
-
-
307.1221
633.2993
9
48.7606
15
0.0294
Limiting point Line flow at line 29 Line flow at line 29 Line flow at line 30 Line flow at line 30
Under intact case, network TTC are being 621.4888 MVA and 632.5870 MVA without and with FACTS devices respectively. So network TTC is improved by 11 MVA, connecting SVC at bus 11 and TCSC at line 28. Enhancement of TTC is limited by the system thermal limit, at line 29. Under contingency condition (line no. 2 is outage); network TTC is 577.6207MVA which is lesser than TTC in intact case. TTC is improved to 633.2993MVA, by connecting SVC at bus 9 and TCSC at line 15. TTC is limited by the system thermal limit, at line 29. Power flow constraints of generator active power, reactive power, bus voltages and line flows are within the limits which are shown in Fig. 2 to 5 respectively.
Fig. 2: Generator active power output for 30 bus system.
Fig. 3: Generator reactive power output for 30 bus system.
47
Ramesh Kumar Arunachalam and Dr. Premalatha Logamani, 2015 Australian Journal of Basic and Applied Sciences, 9(1) January 2015, Pages: 41-50
Fig. 4: Bus voltages for 30 bus system.
Fig. 5: Line flow for 30 bus system. 5.2 IEEE 118-bus System: The system consists of 54 generators, 64 load buses, and 186 transmission lines. The system load is 4242 MW and 1438 MVAR. Bus 69 is taken as slack bus. Details of bus data and line data are available in MATPOWER (R.D. Zimmerman et al., 2011). Convergence characteristic of proposed method for IEEE 118bus system is depicted in Fig. 4. For intact case, loadability limits of each load buses are presented in Table 4. Maximum loadability limit obtained for this system by proposed method is compared with different optimization techniques, is presented in Table 2. Loadability limit obtained by the proposed method is 7855.9MW which is better than result reported in (A. Shunmugalatha and S. Mary Raja Slochanal, 2008), (K. Gnanambal and C.K. Babulal, 2012).
Fig. 6: Convergence characteristics of RCBBO for 118 bus system.
48
Ramesh Kumar Arunachalam and Dr. Premalatha Logamani, 2015 Australian Journal of Basic and Applied Sciences, 9(1) January 2015, Pages: 41-50
Table 4: Active power demand at each load buses for 118 bus system. Bus No. Without FACTS With FACTS 2 23.0586 79.9044 3 98.1735 96.9886 5 96.3530 86.8049 7 100.0000 99.9005 9 83.5788 78.0128 11 80.3167 85.8058 13 53.9803 75.3256 14 33.6117 89.5740 16 72.7967 48.3855 17 98.9483 95.0239 20 33.0375 63.0651 21 21.1931 4.7420 22 43.2734 15.5592 23 98.6558 80.9256 28 99.2395 99.3429 29 93.3293 97.0154 30 100.0000 98.2078 33 65.1049 89.8368 35 99.9795 95.6184 37 87.5565 97.0489 38 100.0000 83.4558 39 83.1275 99.8287 41 100.0000 85.3500 43 43.8970 62.4266 44 70.3243 63.4835 45 100.0000 59.1034 47 91.1520 98.1230 48 99.3886 100.0000 50 100.0000 50.2750 51 16.8021 16.4511 52 37.2497 28.5217 53 17.5923 34.2051
Bus No. 57 58 60 63 64 67 68 71 75 78 79 81 82 83 84 86 88 93 94 95 96 97 98 101 102 106 108 109 114 115 117 118
Without FACTS 81.3289 79.2579 100.0000 100.0000 100.0000 99.1669 82.9532 99.2755 99.6552 99.1639 96.5270 60.5157 99.1433 51.0489 84.7483 73.2564 85.5662 39.2316 67.8757 71.3100 90.8709 99.6233 91.0107 84.5546 81.6207 82.6082 98.1115 71.6877 90.3965 98.9341 66.5761 79.1353
With FACTS 45.4217 43.4419 96.6523 95.9065 94.3537 100.0000 89.0645 98.6430 98.0307 73.1352 100.0000 93.8465 84.7319 77.0457 64.9145 97.0659 86.3975 96.5508 91.8598 96.1851 85.2284 99.7388 99.2103 78.3387 80.5135 96.7077 66.3685 95.4820 97.6445 99.5025 3.3476 99.6629
TTC is calculated by the proposed method with FACTS and without FACTS devices under intact case and contingency condition, results are presented in Table 5. Network TTC are 12947 MVA (without FACTS) and 13051 MVA (with FACTS) under intact case where TTC is limited by system voltage limit at bus 108 and 109 respectively. TTC is improved by connecting SVCs at buses 49 & 77 and TCSCs at lines 174 & 184. Under contingency condition (transformer connected in line 5-8 is outage), network TTC is 12710 MVA (without FACTS) and 13335 MVA (with FACTS). TTC is improved by 5%, connecting SVCs at buses 45 & 51 and TCSC at lines 145 & 184. Power flow constraints of generator active power, reactive power and bus voltages are within the limits which are shown in Fig. 7 to 9 respectively.
Fig. 7: Generator active power output for 118 bus system.
49
Ramesh Kumar Arunachalam and Dr. Premalatha Logamani, 2015 Australian Journal of Basic and Applied Sciences, 9(1) January 2015, Pages: 41-50
Fig. 8: Generator reactive power output for 118 bus system.
Fig. 9: Bus voltages for 118 bus system. Table 5: Enhancement of TTC for 118 bus system. Case Loadability TTC (MW) (MVA) Intact without FACTS Intact with FACTS Contingency without FACTS Contingency with FACTS
SVC
7855.9
12947
Bus location -
7892.3
13051
95,96
7644.7
12710
-
7674.7
13335
51,45
TCSC
Limiting point
Capacity (MVAR) -
Line location -
Level of compensation -
54.5651, 38.8503 -
141, 169
0.6,0.6
-
-
98.9971, 95.6895
145, 184
0.6,0.065
Voltage at bus 108 Voltage at bus 109 Voltage at bus 57 Voltage at bus 21
6. Conclusion: In this paper, ARCBBO algorithm was successfully applied to OPF based enhancement of loadability limit and TTC of the power system. This algorithm is tested to be efficient in identifying the optimal location and size of FACTS devices for improvement of TTC in standard 30-bus and IEEE 118-bus systems under intact and contingency conditions. The solution quality of the proposed method is superior over other techniques reported in recent literature. This solution is very useful to independent system operator (ISO) in deregulated power system, because enhancement of total transfer capability may be used for future transaction in transmission system, against the investment of new transmission lines. Due to its simple framework, and smooth and quick convergence characteristics, the ARCBBO algorithm is suggested to be ideal to solve the multi-constrained large-scale power systems. REFERENCES Ajjarappu, V. and C. Christy, 1992. The continuation power flow: A tool for steady state voltage stability analysis, IEEE Transaction on Power System, 7(1): 416-423. Bhattacharya, A. and P.K. Chattopadhyay, 2010. Biogeography-based optimization for different economic load dispatch problems, IEEE Transaction on Power System, 25: 1064-1077.
50
Ramesh Kumar Arunachalam and Dr. Premalatha Logamani, 2015 Australian Journal of Basic and Applied Sciences, 9(1) January 2015, Pages: 41-50
Ejebe, G.C., J. Tong, J.G. Waight, J.G. Frame and X. Wang, 1998. Available transfer capability calculations, IEEE Transaction on Power System, 13(4): 1521-1527. Farahmand, H., M. Rashidinejad, A. Mousavi, A.A. Gharaveisi, M.R. Irving and G.A. Taylor, 2012. Hybrid mutation particle swarm optimization method for available transfer capability enhancement, International Journal of Electrical Power and Energy Systems, 42: 240-249. Ghawghawe, N.D. and K.L. Thakre, 2009. Computation of TCSC reactance and suggesting criterion of its location for ATC improvement, International Journal of Electrical Power and Energy Systems, 31: 86-93. Gnanambal, K. and C.K. Babulal, 2012. “Maximum loadability limit of power system using hybrid differential evolution with particle swarm optimization,” International Journal of Electrical Power and Energy Systems, 43: 150-155. Irisarri, G.D., X. Wang, J. Tong and S. Mokhtari, 1997. Maximum loadability of power systems using interior point non-linear optimization methods, IEEE Transaction on Power Systems, 12(1): 162-172. Khaburi, M.A. and M.R. Haghifam, 2010. A probabilistic modeling based approach for total transfer capability enhancement using FACTS devices, International Journal of Electrical Power and Energy Systems, 32: 12-16. Nireekshana, T., G. Kesava Rao and S. Siva Naga Raju, 2012. Enhancement of ATC with FACTS devices using real-code genetic algorithm, International Journal of Electrical Power and Energy Systems, 43: 12761284. North American Electric Reliability Council (NERC), 1997. Available transfer capability definitions and determination. NERC report. Mohan Mathur, R. and Rajiv K. Varma, 2002. Thyristor –Based FACTS Controllers for Electrical Transmission Systems, John Wiley & Sons. Ou, Y. and C. Singh, 2002. Assessment of available transfer capability and margins, IEEE Transaction on Power Systems, 17(2): 463-468. Sawhney, H. and B. Jeyasurya, 2004. Application of unified power flow controller for available transfer capability enhancement, Electric Power Systems Research, 69: 155-160. Shunmugalatha, A. and S. Mary Raja Slochanal, 2008. Maximum loadability of a power system using multi agent-based hybrid particle swarm optimization, Electric Power Components and Systems, 36: 575-586. Simon, D., 2008. Biogeography-based optimization, IEEE Transaction on Evolutionary Computation, 12: 702-713. Song, Y.H. and X. Wang, 2003. Operation of Restructured Power Systems. Operation of Market-Oriented Power System, Springer Verlag, 1: 1-12. Wenyin Gong, Zhihua Cai, X. Charles and Ling Hui Li, 2010. A real-coded biogeography-based optimization with mutation, Applied Mathematics and Computations, 216: 2749-2758. Xiao, Y., Y.H. Song and Y.Z. Sun, 2001. Application of unified power flow controller to available transfer capability enhancement, IEEE Power Engineering Review, 72: 66-68. Xiao Ying, Y.H. Song, Liu Chen-Ching and Y.Z. Sun, 2003. Available transfer capability enhancement using FACTS devices, IEEE Transaction on Power Systems, 18(1): 305-312. Zimmerman, R.D., C.E. Murillo-Sanchez and R.J. Thomas, 2011. MATPOWER: steady-state operations, planning and analysis tools for power systems research and education, IEEE Transaction on Power Systems, 26(1): 12-19.