we put these propositions to the test. .... software issues in assert or the units under test (UUTs). In Section 7 we dive ..... tance by providing an easy to use topology maker interface ..... periment the last step of the Experiment Wizard allows the.
Enhancing ASSERT: Making an Accurate Testbed Friendly Ehsan Nourbakhsh, Ryan Burchfield, S. Venkatesan, Neeraj Mittal, Ravi Prakash Department of Computer Science University of Texas at Dallas Richardson, TX 75080
{ehsaan,ryanb,venky,neerajm,ravip}@utdallas.edu
ABSTRACT
• accurately reflect wireless network behavior (accuracy),
This article discusses lessons learned from use of our publicly available wireless networking testbed, assert[1]. In [1] we discussed the design and implementation phase of a testbed based on a set of propositions. By opening the testbed to users not familiar with underlying architecture of assert, we put these propositions to the test. While fidelity of the testbed is a major challenge for developers, users assume the fidelity as a given and look for ease of use comparable with a simulator. We list the main demands by users of our testbed and the way we addressed these demands during an enhancement phase.
• provide enough control to configure topology and environment conditions (controllability), • emulate mobility of the nodes (mobility), • conduct experiments that are reproducible and easily repeatable (repeatability), • be cost effective in terms of hardware, manpower, space and time requirements to set up, run experiments on and maintain (cost effectiveness),
Categories and Subject Descriptors
• provide necessary tools to collect and analyze data (data collection),
C.2.1 [Computer-Communications Networks]: Network Architecture and Design—Wireless communication; D.2.5 [Software Engineering]: Testing and Debugging—Distributed debugging; C.4 [Performance of Systems]: Measurement Techniques
• be able to share the available resources to conduct multiple experiments without interfering with each other (resource sharing),
General Terms Measurement, Design, Experimentation
Keywords ASSERT, Wireless, Sensor, Testbeds
1.
INTRODUCTION
In recent years multiple wireless testbeds have been designed and implemented by the wireless networking research community. Examples of such testbeds include Netbed [2], Kansei [3], Trio [4], ExScal [5], Mint-m [6], MeshTest [7] and other testbeds at U.C. Berkeley [8]. Based on the strengths and weaknesses of these testbeds, we proposed the following nine main propositions in [1]. We suggested that an ideal wireless testbed should adhere to these propositions to provide valid results with a user-friendly interface. We proposed that an ideal testbed should:
Permission to make digital or hard copies of all or part of this work for personal or classroom use is granted without fee provided that copies are not made or distributed for profit or commercial advantage and that copies bear this notice and the full citation on the first page. To copy otherwise, to republish, to post on servers or to redistribute to lists, requires prior specific permission and/or a fee. WiNTECH’11, September 19, 2011, Las Vegas, Nevada, USA. Copyright 2011 ACM 978-1-4503-0867-0/11/09 ...$10.00.
• have multi-nodal capability .e.g., support many types of nodes, and • have the ability to scale to a large number of nodes (scalability). While building assert (Advanced wireleSS Environment Research Testbed) we made many software and hardware design choices necessary to accomplish our goals set forth by the above propositions. However, the ultimate success of our testbed depends not only on its compliance with these propositions, but also on its acceptance as a useful tool by the users. User feedback led us to the realization that, like most well-intentioned researchers, in our emphasis on creating a high fidelity testbed we had under-emphasized its usability. For a testbed to attain the highest level of usage that it can achieve, its users need accessories to design, instrument and monitor their experiments. Proper usage of the testbed should not require comprehensive knowledge of the design and implementation of the testbed. As developers of the testbed we tend to implicitly assume that users are as knowledgeable of the testbed as we are. This creates a steep learning curve for users. Based on user feedback, we extended the implementation phase to an enhancement phase. In the initial implementation phase, we were more concerned about validity of obtained results and general behavior of the testbed over time. But we have learned that a user is exposed to the testbed only for the duration of his/her experiments and is more interested in the ability to accurately specify an experiment
and retrieve extensive performance logs for post facto analysis. Satisfaction of users is dependent on fulfillment of their expectations for individual experiments followed by consistency of multiple related experiments. In other words, while the initial design and implementation phase was “functionality centric,” we have since graduated to a “user centric” enhancement phase. In this paper we provide the lessons learned during this transition. We hope future developers of small or large scale testbeds can benefit from our experience. We first review some of the other testbeds most related to our work. In the next section we provide a summarized description of assert. In Section 4 we discuss the main expectation from the testbed from the point of view of a user : a researcher who is using assert to run experiments without much knowledge of its internal design. In the following three sections we discuss the improvements we made to address these expectations. Section 5 shows how how we provided tools to simplify creation of complex scenarios. In Section 6 we describe challenges users face in validating their experiments, and the tools we provided to make this possible. This validation requires not only ways to report errors in their applications, but also possible hardware and software issues in assert or the units under test (UUTs). In Section 7 we dive deeper into data collection proposition, mechanisms to synchronize all data gathered and the extra information we were able to provide to users.
2.
RELATED WORK
Creating wireless testbeds to test and validate new protocols and hardware designs has been an area of interest in the past few years. The different approaches to create such testbeds can be categorized as follows. The first category of testbeds, such as MoteLab [9] and ORBIT [10] use over-the-air communication between nodes. As a result, the researcher is not able to control the exposure of the UUT to background noise and interference from other nodes. The distance between nodes is limited to the physical placement of the devices. Although the size of the network they are able to create is larger, they are not able to partition them effectively. Mint-m [6] and Mobile Emulab [11] address the mobility and controllability requirements by employing added attenuation between UUTs and small robots to move the UUTs around the test area. Pharos [12] uses a similar approach of using robots, but the environment is set outdoors. These approaches still do not eliminate the problem of uncontrolled and non-quantifiable exposure to background noise or interference from other testbed devices. Also, mobility is either limited to the speed of the robots or is not supported as a design feature. A second category of efforts such as work done in CMU [13] digitize the outgoing signal of the UUTs and use existing RF propagation models to emulate effects such as distance and multipath effects on the signal. The resulting altered signal is fed to the destination devices. The accuracy of this method is limited to the precision of the applied RF propagation model. Furthermore, signal alteration requires sophisticated calculations. So, for larger number of nodes the processing power requirements are harder to meet, failing to address the cost effectiveness and scalability requirements. The third category of testbeds focus on simply using coaxial cables to connect different nodes. Attenuators and RF
Figure 1: Block diagram of one site and the related RF, data and command lines
Figure 2: ASSERT RF Grid and control plane switches are used to emulate topologies and distance between nodes. MeshTest [7] is one example of such set up with a design close to our work. However, their method requires complex design for higher number of nodes. High cost of the switch matrices used might be another obstacle to building larger networks, failing to address cost effectiveness requirement.
3. ASSERT DESIGN The following is a general overview of assert in terms of the software and hardware design choices that we made during the “functionality centric” phase. For more details of the design phase please refer to [1].
3.1 Hardware Our testbed currently consists of forty devices, known as “sites” in this context. It is best to think of assert hardware as a graph (as in Figure 2), with nodes representing sites in the testbed, and edges representing RF links between sites. Each site consists of a custom digital board (Figure 3) and a custom RF board (Figure 4). The digital board has a processor, memory, FPGA and serial interfaces where the Unit Under Test (UUT) can be connected. The site processor is running Linux and is connected to an Ethernet network for network storage and communication. The software processes executing on the digital board can control the operations of the UUT, monitor the experiment, and gather results as described in Section 3.2. The main functionality of the FPGA is to set the attenuators on each RF connector as instructed by the microprocessor, and poll the RSS meter on a millisecond basis. The attenuators are set to values either calculated based on a theoretical model, or based on real life recorded attenuation values such as work done by Lee et. al. [14] addressing the
accuracy requirement. These real life readings can be gathered once for some generic scenarios and then used multiple times to compose more complex terrains. The RF board connects to the FPGA connectors on the digital board. It also provides a coaxial interface for the antenna port of the UUT. The UUT interface leads to a 1 × 16 power divider/combiner. Each output port of the power divider/combiner leads to a programmable attenuator (controllable by the digital board through FPGA) which can provide signal attenuation between 0dB and 63.5dB, in steps of 0.25dB. The attenuators from two different RF boards can be connected via a coaxial cable forming an RF link between two sites. Thus the signal on this link can be attenuated in the range 0dB to 127dB: a maximum of 63.5dB attenuation provided by each of the two programmable attenuators on the path. This 1-to-16 connection means we are able to expand our testbed just by adding sites, addressing the scalability as well as cost effectiveness requirements.
Figure 3: One Site Board. Each Site Board is paired with one RF board
Figure 4: One RF Board We synchronize the clocks on sites through our hardware clock distributors so that we are able to set the attenuations on the 16 connectors on all sites synchronously. The clocks are synchronized by a millisecond precision. This will allow us to control how the sites are “virtually” moving with reference to each other with a high precision, addressing the mobility requirement. The block diagram of a site is shown in Figure 1. As shown in Figure 2, a front-end computer called Control PC is connected to all sites through Ethernet and is responsible for getting experiment definition from user, sending control information and gathering the results. Our design choices ensure that we are able to scale to at least one thousand nodes without unreasonable processing power requirements. Continuing with the graph theoretic description, the digital and RF boards together correspond to a node with a maximum of sixteen incident edges. The components on the RF board can currently support all communication bands between 720 MHz and 1125 MHz. The sites, each with a degree of sixteen, are connected to form a mesh. The quality of links can be manipulated by changing the level of signal attenuation as rapidly as once every millisecond.
3.2 Software The software is divided into slices, with each slice implementing a specific functionality. We now describe the software architecture in the context of the creation and execution of a user’s experiment. The diagnostics slice runs both periodically and on demand to check the integrity of RF links on the testbed. This involves selecting sites sequentially, having them send signals along each incident link, and measuring the received signal strength for different values of attenuation along the link. This slice registers a link in the database between two sites if both can receive the signal generated by each other. A run of the diagnostics slice gives a snapshot of the topology of the testbed in terms of which links are functional and which links are broken and need to be repaired. The user interface slice, running on the central controller provides a graphical user interface to the users. If the topology the user wishes to emulate is not present in the library, the user can specify it as a graph with vertices and links between vertices. The user can also specify the characteristics of the wireless links between vertices. This addresses the controllability requirement. Once the user has specified the desired topology, the user interface slice invokes the experiment control slice. The experiment control slice first gathers the current state of the testbed by querying the system state slice, which returns state of all the sites as well as the set of reservations currently running on the testbed. Then the experiment control slice invokes the topology mapper slice. The topology mapper slice computes the topology based on user input as a subgraph of the portion of the testbed that is not running any experiment. If the topology mapper slice is successful, the experiment control slice invokes the reservation slice. The reservation slice reserves the corresponding testbed sites for the experiment as extendable leases of finite duration. Then the experiment control slice invokes the attenuator control slice at all the reserved sites. As part of this invocation, the experiment control slice informs each reserved site about the properties of the links incident on it. To implement the desired link characteristics the sites at either end of the emulated wireless link work cooperatively. Consistent with the producer-consumer model employed by operating systems, acting as a producer each site generates a sequence of attenuation values along with the time offset from the beginning of the experiment when these attenuation values are to be used on a link. Acting as a consumer, the FPGA on the site hardware reads these values and sets the attenuation values accordingly once it is informed that the experiment has started. Concurrently, the experiment control slice informs the unit under test to start executing the experiment through the UUT control slice. Thus, as the unit under test is running the experiment and sending and receiving messages along the emulated wireless links, the attenuator control slice is manipulating the characteristics of these links. The functionality of reservation, attenuator control and UUT control slices satisfy the resource sharing requirement. For the entire duration of an experiment running on assert, the system state slice monitors the state of the sites. The logging slice records all error and control messages generated by all the participating sites. The UUT logging slice records information that the UUT writes to serial port of the site as it is running. This data can be used by the experi-
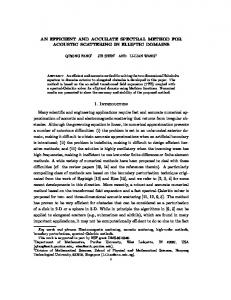
Figure 9: Uploading multiple mote images
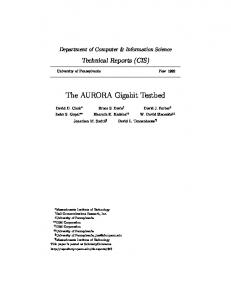
Figure 10: RSS Log GUI extension, annotation added for transmissions menter to debug the UUT. Timestamps associated with all testbed logs allow the testbed user to precisely compare the debugging logs to logs of other sites and the experiment results at any time instant. This satisfies the data collection requirement. Finally, on the completion of the experiment the experiment control slice invokes the reservation slice to release all the sites reserved for the experiment. In a nutshell, all the software slices together can be thought of as the operating system for assert.
4.
FEEDBACK ANALYSIS
The first item testbed users were looking for was a visual representation of testbed sites and links. For a physical testbed, a geographical map of node locations may suffice. But in our case we were able to draw the cabling map using cable connectivity gathered by the Diagnostic slice. This visual representation allows the user to decide the details of their desired experiment setup. As a result, users were also expecting tools to design new topologies based on the
Figure 11: Link table of sites
testbed facilities, and also tools to dynamically map a designed topology to available resources. The users also expected to be able to easily upload their custom images to UUTs and also pass their specific startup parameters to each node. Users also were interested in ability to verify proper start of the experiment and its correct progress. For a remotely accessed testbed, either a remote shell needs to be provided or near real-time data gathering is expected. Furthermore, tools for debugging and investigating collected data were demanded. Some users demanded or preferred to have access to extra information such as general data provided by a spectrum analyzer, but adding such devices to all nodes was not feasible. We were able to provide similar functionality on a per node basis, which proved to be a significant debugging tool. One user demand that was specific to our testbed was the possibility to create customized distribution models. This task can be achieved by either adding two distributions together or coding a new distribution object by the user. In the next sections we describe how we addressed each of these needs by software and hardware extensions.
5.
CAPABILITY AND FLEXIBILITY
In comparison with an ad hoc setup, a testbed provides higher level of control over creation and execution of an experiment. The main goal of a testbed is to yield correct results which are consistent over multiple runs. Our initial design, like many other testbeds, focused on the fidelity of the results. But we realized the main method for attracting new researchers, users of the testbed, was providing tools to easily design and run experiments. The added value of such tools can be a major consideration for a researcher when choosing a testbed to conduct experiments By providing the cable map tool (Section 5.1) the user can be aware of available links between sites. They can also visually verify the links used in an earlier experiment. With this information, the user can use our visual topology maker tool (Section 5.2) to design a new experiment. This new experiment can use a static assignment of sites and links, or can allow the topology mapper (Section 5.3) to dynamically select those sites and links that are currently available.
Figure 5: Visual tool to create a topology and its related events
Figure 7: History of past experiments of current user
5.1
Cable Map
Through the diagnostics software slice we are able to keep track of existing links between sites. We make this information available to the users both through a textual link table (Figure 11) and visual representation of the sites and links as a graph (Figure 8). A user can also highlight sites and links used in an experiment using the visual tool. This information is stored in a database and is accessible to the topology mapper slice (Section 5.3) to either validate designed topologies that users submit, or to generate new topologies based on user input. We would like to mention that even in a testbed of a small size, the visual representation of cable map is confusing at best. We propose that a GUI should give the option to the user to only plot one cluster of sites at a time, with the outgoing edges from the cluster clearly marked.
5.2
Topology Maker
Our initial version of the testbed required the topology to be indicated using a textual script file. This approach, similar to many existing testbeds and simulators, would imply that the user is familiar with underlying testbed software. While we did provide a variety of example scripts designed
Figure 6: Real time log viewer for a testbed site
Figure 8: Graphical view for cables. Links and sites used in selected experiment are highlighted for familiar test scenarios, we quickly realized the high demand for a visual editor. While the burden of writing a topology script seemed reasonable to developers, users were reluctant to learn this new “script.” We addressed this reluctance by providing an easy to use topology maker interface through the GUI. While users are expected to be familiar with general concepts such as attenuation and link profiles, the GUI provided help at each step and for almost every input field. A sample created topology is shown in Figure 5. Users will first create a graph of sites and their links. Then the user can provide UUT type, image type and UUT application parameters. We describe these in more details in Section 5.5. To simplify creation of large topologies each link can belong to a group of links. The characteristics of each group of links can change over time, through definition of events. Each event indicates when a new profile for a group of links will be set, and what are the parameters for the said profile.
5.3
Topology Mapping
As discussed in the software description (Section 3.2), users provide their desired topology of sites. Once this submission is done, the topology mapper slice validates avail-
ability of sites, the type of UUTs connected and the links required to satisfy the given topology. However, the collected user feedback indicated demand for a more capable topology mapper. Users were burdened by having to manually map their desired network topology to our testbed. To relieve the user of this burden we enhanced the topology mapper to allow the specification of site aliases with wildcards in the topology file. With this syntax the user is able to specify a topology using node aliases throughout the file. At experiment run time topology mapper resolves the aliases by mapping them to physical sites. In its most general form this resolution process is the problem of subgraph isomorphism that has been proven to be NP-complete. To solve the problem more efficiently one may adopt heuristic approaches and optimized software implementations. Our solution began with a brute-force recursive implementation of a mapping algorithm. This approach attempts to map every site to every alias and then tests if the testbed cabling can support that mapping. One exception to this behavior is when the user specifies the site ID instead of the wildcard for an alias. That mapping is not modified by the topology mapper. In our initial tests we found the running time of this algorithm to be acceptable for small experiments. To evaluate the scalability of our approach we generated a topology consisting of 24 sites with 92 links for an average of 8 neighbors per site. In the present system the order in which aliases are resolved is random based upon a hash of the user’s alias for a given site. To fairly evaluate our system we measured the time taken to map the topology 20 times, each time with a different set of randomly generated alias names. The mapping process took an average of 15.8 seconds with a maximum of 47.3 seconds. We then devised a heuristic to improve performance. The heuristic eschews random resolution of aliases to physical sites. Instead, it maps aliases in descending order of node degree: from most incident links to fewest. Tested under the same circumstances the heuristic improved performance to an average time of 1.6 seconds with a maximum of 3.7 seconds. We then identified the second source of variability as the ordering of sites in the list of possible mappings for an alias. In its original state this list was effectively randomly sorted. We then added a second heuristic: a descending sort of sites in the possible mapping list for every alias. The sort criteria was once again the number of links present at the site. With both heuristics in effect the mapping time averaged over a 100x improvement to 0.143 seconds with a maximum of 0.4 seconds. In order to better understand the problem space we conducted trials with all possible combinations of these heuristics and tested ascending sorts. The findings of our experiments are summarized in Table 1. We observe that the best performance occurs when both heuristics are used in descending order. We find this result to be expected because it maximizes the number of choices the algorithm has early on resulting in fewer failed assignments. We also note that the standard deviation of this configuration has become quite small. This indicates that alias names of the sites no longer have a significant bearing on algorithm performance. Interestingly, we observe that when both heuristics are applied in ascending order the results are very comparable. It seems that as long as the two lists maintain an approximate ordering consistent with each other the performance improves. We believe that the use of
these heuristics will greatly reduce the time required to map the topology for most experiments. Once the mapping step is completed successfully, user is provided with the option to download the updated topology. This will be useful if small changes are supposed to be made to the topology or if user wishes to re-run the experiment later. If the subgraph cannot be mapped, user is notified that this topology is not feasible. Table 1: Topology Mapping Time for Various Heuristic Combinations Heuristic Mean Std. Dev. Min Max None 15.79 13.94 0.60 47.30 1 Desc. 1.45 1.45 0.10 3.30 1 Asc. 68.24 49.63 18.40 183.70 2 Desc. 19.58 28.45 0.60 97.70 2 Asc. 7.30 8.68 0.10 27.80 1 Desc. + 2 Desc. 0.14 0.15 0.006 0.40 1 Asc. + 2 Desc. 99.17 69.04 25.6 256.00 1 Desc. + 2 Asc. 4.56 0.96 3.80 8.00 1 Asc. + 2 Asc. 0.21 0.31 0.02 1.20
5.4
Distribution Cleanup
One comment we received from users of assert was that specifying link attenuation distribution was cumbersome and non-intuitive for some distributions. We realized that this difficulty originated from an early design decision to represent as many distributions as possible using the parameters mean and variance. This decision facilitated rapid development but hampered the specification of new experiments. Consider the uniform distribution. It is more relevant and understandable if user had to specify this distribution in terms of minimum and maximum values instead of mean and variance. While correcting this shortcoming the link attenuation distribution implementation as a whole was revised to include a new object oriented class hierarchy, database schema for parameter storage and less code duplication in the Topology Mapper parse code. The net effect of these changes was the conversion of parameter specification to intuitive prompts and a more flexible code-base for easier addition of distributions by future developers.
5.5
Application Parameters
Initial assumptions during design phase of assert viewed the UTTs as black boxes. The only interaction with a UUT was to record the messages it wrote to the serial port, as described in UUT logging feature (Section 7.1). However, we quickly realized the problems with this assumption. While it would make our design very inclusive without any expectation from the UUTs, it also complicated the setup phase of each experiment. Each node had to be programmed individually before installation in the sites. A re-image would require physically disconnecting and re-connecting the UUTs, or using automated serial forwarding over the network provided by our testbed. During the implementation phase, even before the enhancement phase, we added two slices called “Mote Image Creator” and “UUT Control” that addressed this problem. Mote Image Creator would create images for Mica2 motes based on a generic image provided by the user. UUT Control would use the serial interface to flash the images on
Task Create Images Reservation Synchronizing Clocks Upload images to UUTs Create Attenuation Model Restarting UUTs Enabling Logs Renew Reservation Run experiment Disable Logging Abort Reservations Total (excluding run experiment)
corresponding motes. Through user feedback we realized that development of the software for motes would be even more simplified if we provided the possibility to set variables inside the generic image. For example, in a sensor network which senses the temperature, users could provide only the generic base image and indicate value of the temperature variable for each node. This could be done in the GUI as part of the Topology Maker extension (Section 5.2). Later, we also added the possibility that nodes be grouped and each group be assigned one entirely different image type, e.g., sink versus regular sensor images. Once the created topology is loaded to run an experiment, users can upload all these images directly through the GUI (Figure 9).
6.
VERIFICATION
Our success in facilitating easy creation and running of experiments encouraged the users to extend the duration of experiments from hours to days. However, this quickly resulted in greater expectations of error reporting and experiment output. With the increase in amount of data and logs created during experiments, identifying possible errors became increasingly hard. Meanwhile, detecting an error ideally should not require the entire experiment to finish. It has become common practice for researchers to quickly examine initial results of an experiment while it is still running to verify that it does not require a restart with updated parameters. The errors we target might be either in the topology or the application designed by the user, or in the state of the testbed due to hardware or software failures. To address these demands, we enhanced the log viewing capability of the GUI based on user feedback (Section 6.1). We also provided multiple remote access methods for accessing the testbed, making monitoring experiments quick and painless (Section 6.2).
6.1
Log Viewer
Log viewer is an extension of the GUI which provides access to warning and error messages of the testbed software. Figure 6 shows the log viewer extension in our GUI. Each log message can have a significance level of Debug, Info, Error and Ceil. The user interface can filter log messages based on slice name, function name, a regular expression of the log message content and the error severity type. Multiple log viewers can be started to compare log messages of different sites or experiments. Since the sites have synchronized times, we are able to identify if an issue was local or network wide.
6.2
Remote Access
While command line interaction with assert is possible, the most preferred method of interaction with the testbed is through the GUI. Our web based GUI can be invoked from any remote machine which has proper Java installation and browser plugins. Users can log in with their username and password through a secured SSL channel and review their past experiments or create new ones. They also can download the UUT and RSS logs of their previous experiments, as well as the topology used for each experiment. All other features such as cable mapping, site and link status, log viewer, topology creator and RSS viewer are also embedded in this GUI. Average running time of each item of an experiment is shown in Table 2.
Average Time (s) 5.3 4.2 18 17.1 0.01 1.4 0.9 2.6 1941.5 1.7 1.2 52.9
Table 2: Average time for each task over three runs for a 30 minute experiment with 24 nodes While an experiment is running, the status of that experiment is shown as “running” in the experiment table and changes to either “success,” “aborted” or “failed” on termination (Figure 7). The topology mapping file as well as UUT and RSS logs can be downloaded using this interface (Section 7.2). Upon termination of an experiment, either with success or failure, the return status of the experiment is available both through the experiment table in the GUI and Twitter.com. Users may opt to receive text messages when the experiment terminates. If the experiment fails, user is able to quickly assess the reason using log view functionality (Section 6.1).
7.
DATA COLLECTION
As discussed before, the testbed user wishes to quickly design and run experiments and verify their correctness. But all of this would be of no use if the user could not gather detailed logs from the application running on the unit being tested. We expedite data gathering and analysis by providing facilities to log and retrieve UUT output messages (Section 7.1). While these UUT logs are the information reported by the application running on the UUT, we also provide user RF signal information gathered by the testbed itself during the experiment (Section 7.3). This information, synchronized with UUT logs, can also inform the user of the wireless network activity of their application which is very effective in debugging problems (Section 7.2).
7.1
Timestamp Adjustments in UUT Logs
assert collects log files written by each UUT to the serial port of its corresponding site. This is used for collecting data for user who are interested in the output of their own application. This is different from testbed logs, which are information regarding status of the testbed and execution of the experiments. Each UUT log message recorded by the testbed has a timestamp associated with it. This proved to be a powerful tool for experiment execution, as output logs of different UUTs could be synchronized using the precise timestamps attached. We extended this feature by synchronizing the UUT log timestamps with RSS logs and the attenuator starting times with a millisecond precision. The logs start when each UUT is started, so the boot messages of each UUT are captured. The experiment may in fact start after UUTs reboot, in which case the timestamps up to this moment are negative.
We mark the start of the experiment with a marker in the log file, and the timer is set to zero at this moment. When collecting data, the user can compare different UUT logs as well as RSS log files with millisecond precision. This is very useful to see if a wireless transmission scheduled in UUT application did happen in RF domain, or not and who were the receiving nodes. One can also verify that a reception in physical layer actually made its way to the application. These are assuming UUT application has proper log messages for transmission or reception. For example, simply using printf.h for Mica2 motes to log application messages is compatible with our UUT logging slice.
7.2
Log Download
Prior to adding a complete remote access system to assert, experiment logs were viewed via a secure shell (SSH) and through text based scripts. This process was time consuming because users had to navigate to the correct folder and find the log file for a specific experiment given a timestamp or the experiment number. As part of the remote access goal we added a mechanism for transmission of all experiment logs through the GUI. On completion of an experiment the last step of the Experiment Wizard allows the user to specify a location to download RSS and UUT logs for the previous experiment. If users later wish to retrieve the logs again they can do so by selecting the corresponding option in the experiment table’s right click context menu.
7.3
RSS Log
By adding a Received Signal Strength (RSS) meter between UUT and the divider/combiner, as shown in Figure 1, we are able to monitor received signal strength right at the UUT antenna. We extended use of this RSS meter to gather dBm values measured by the meter. This requires periodic calibration of the sites, which was automated. We also synchronize the timestamps of the logged values using the hardware clocks. This will allow a user to compare RSS logs of different sites to see who has received a transmission, or study the effect of transmission power of UUTs. This also serves as a verification tool to verify attenuation levels between nodes. We added an extension to the GUI to plot simple line graphs for RSS logs of multiple nodes. By plotting these lines on the same graph, user can visually verify transmissions and receptions and duration of each. User can customize and save the plotted graph through the GUI. An example of the RSS GUI extension, with some annotations added, is shown in Figure 10.
8.
CONCLUSION
We provide the lessons learned from development of features demanded by researchers using our testbed, assert [1]. We test our previous propositions in [1] using feedback from users running experiments. We collect and address main demands from users, which are mainly extensions of our earlier propositions. We emphasize that the ease of use and existence of data collection and analysis tools are the keys to creating a usable testbed for the research community. A testbed based on hardware emulation is expected by the users to provide fidelity of outdoor field experiments with ease of use comparable with simulators. By providing experiment automation, remote access and log collection, we
significantly reduced user involvement when compared to a field experiment.
9. REFERENCES
[1] E. Nourbakhsh, J. Dix, P. Johnson, R. Burchfield, S. Venkatesan, N. Mittal, and R. Prakash, “ASSERT: A Wireless Networking Testbed,” in Proceedings of TridentCom ’10: LNICST 46, 2010, pp. 209–219. [2] B. White, J. Lepreau, and S. Guruprasad, “Lowering the Barrier to Wireless and Mobile Experimentation,” in In Proceedings of HotnetsI, 2002. [3] E. Ertin, A. Arora, R. Ramnath, V. Naik et al., “Kansei: A Testbed for Sensing at Scale,” Proceedings of the fifth international conference on Information processing in sensor networks, 2006. [4] P. Dutta, J. Hui, J. Jeong, S. Kim, C. Sharp, J. Taneja, G. Tolle, K. Whitehouse, and D. Culler, “Trio: enabling sustainable and scalable outdoor wireless sensor network deployments,” in Proceedings of IPSN ’06, 2006. [5] A. Arora, R. Ramnath, E. Ertin et al., “Exscal: Elements of an extreme scale wireless sensor network,” Proceedings. 11th IEEE International Conference on Embedded and Real-Time Computing Systems and Applications, Aug. 2005. [6] P. De, A. Raniwala, R. Krishnan, K. Tatavarthi et al., “MiNT-m: An Autonomous Mobile Wireless Experimentation Platform,” in Proceedings of the 4th international conference on Mobile Systems, Applications and Services, 2006. [7] T. Clancy and B. Walker, “MeshTest: Laboratory-Based Wireless Testbed for Large Topologies,” in TridentCom ’07, 2007. [8] “Soda Hall wireless and sensor network testbeds.” [Online]. Available: http://www.millennium.berkeley.edu/sensornets/ [9] G. Werner-Allen, P. Swieskowski, and M. Welsh, “MoteLab: A Wireless Sensor Network Testbed,” in Proceedings of the 4th International Symposium on Information Processing in Sensor Networks, 2005. [10] D. Raychaudhuri, I. Seskar, M. Ott, S. Ganu et al., “Overview of the ORBIT Radio Grid Testbed for Evaluation of Next-Generation Wireless Network Protocols,” Wireless Communications and Networking Conference, 2005 IEEE, vol. 3, 2005. [11] D. Johnson, T. Stack, R. Fish, D. M. Flickinger, L. Stoller, R. Ricci, and J. Lepreau, “Mobile Emulab: A Robotic Wireless and Sensor Network Testbed,” Proceedings of INFOCOM ’06, April 2006. [12] D. Stovall, N. Paine, A. Petz, J. Enderle, C. Julien, and S. Vishwanath, “Pharos: An Application-Oriented Testbed for Heterogeneous Wireless Networking Environments,” The University of Texas at Austin, Tech. Rep. TR-UTEDGE-2009-006, 2009. [13] G. Judd, “Using Physical Layer Emulation to Understand and Improve Wireless Networks,” Ph.D. dissertation, Carnegie Mellon University, School of Computer Science (available as Tech Report CMU-CS-06-164), 2006. [14] H. Lee, A. Cerpa, and P. Levis, “Improving Wireless Simulation Through Noise Modeling,” in Proceedings of IPSN ’07, 2007, p. 30.