to the advanced capabilities of hardware performance monitoring units currently ..... (2) SPECjbb2000, which is a Java-based application server workload; and ...
Enhancing Operating System Support for Multicore Processors by Using Hardware Performance Monitoring Reza Azimi
David K. Tam
Livio Soares
Michael Stumm
Department of Electrical and Computer Engineering, University of Toronto, Canada {azimi, tamda, livio, stumm}@eecg.toronto.edu
Abstract Multicore processors contain new hardware characteristics that are different from previous generation single-core systems or traditional SMP (symmetric multiprocessing) multiprocessor systems. These new characteristics provide new performance opportunities and challenges. In this paper, we show how hardware performance monitors can be used to provide a fine-grained, closely-coupled feedback loop to dynamic optimizations done by a multicore-aware operating system. These multicore optimizations are possible due to the advanced capabilities of hardware performance monitoring units currently found in commodity processors, such as execution pipeline stall breakdown and data address sampling. We demonstrate three case studies on how a multicore-aware operating system can use these online capabilities for (1) determining cache partition sizes, which helps reduce contention in the shared cache among applications, (2) detecting memory regions with bad cache usage, which helps in isolating these regions to reduce cache pollution, and (3) detecting sharing among threads, which helps in clustering threads to improve locality. Using realistic applications from standard benchmark suites, the following performance improvements were achieved: (1) up to 27% improvement in IPC (instructions-per-cycle) due to cache partition sizing; (2) up to 10% reduction in cache miss rates due to reduced cache pollution, resulting in up to 7% improvement in IPC; and (3) up to 70% reduction in remote cache accesses due to thread clustering, resulting in up to 7% application-level improvement.
Categories and Subject Descriptors C.4 [Computer Systems Organization]: Performance of Systems—measurement techniques, modeling techniques; D.4.8 [Operating Systems]: Performance—measurements, modeling and prediction General Terms
Experimentation, Performance
1. Introduction The recent emergence of multicore processor architectures represents a fundamental shift in design and not simply a transient technology trend. Multicore architectures address three fundamental challenges in further increasing processor clock frequencies. First, the widening gap between processor and memory speeds has caused processors to spend most of their time waiting for memory to provide data, mak-
ing frequency increases ineffective. Secondly, energy consumption and heat dissipation of processors, which are tied to frequency, are approaching their physical limits [12]. Finally, higher frequencies require deeper execution pipelines, making the design and verification of already complex processors even more challenging. For these reasons, multicore processors have become the new mainstream architecture, and hence warrant prime attention from software developers. From a software perspective, the ability to utilize the full potential of numerous execution cores in a single computer has proven to be difficult, as it involves several layers of software. At the highest level, either each core is utilized to run a different application, or a single application must be parallelized, either manually or automatically, into multiple threads. However, even when application level parallelism is extracted and expressed explicitly, there are at least two challenges in achieving scalable performance that are inherent to multicore architectures: Contention on Shared Resources: Compared to traditional SMP (symmetric multiprocessor) systems, individual cores in a multicore architecture have more shared resources on the common path. Some of these shared resources include on-chip shared caches, the memory controller, and the interconnect to other processor sockets or the I/O fabric. Having unregulated contention in any of these shared resources may result in suboptimal system throughput and hinder scalable performance. Non-Uniform Inter-Core Communication Latency: Unlike conventional SMP systems, due to the increasingly hierarchical nature of multicore systems, the communication latency between two cores may vary substantially depending on their physical proximity. For example, cores on the same chip or subchip bundle can communicate at least an order of magnitude faster with each other, through on-chip caches, than cores that reside on different chips. This aspect of multicore architectures has similarities to traditional NUMA (non-uniform memory access latency) multiprocessor systems. In essence, multicore systems add extra levels to the memory hierarchy and, as a result, make the non-uniformity of communication latency much more pronounced than in traditional NUMA systems.
We believe that dealing with these challenges lies, in part, within the scope of the operating system. In addition to being aware of the underlying hardware architecture, the operating system can extract and incorporate information about the dynamic nature of the running system, including how well the hardware, and how well the software applications are performing, enabling the operating system to manage resources more effectively. In order to do this, the operating system needs to accurately identify and quantify the latencyinflicting events in a complex multicore system. Hardware Performance Monitoring Units (PMUs), available in most modern processors, are prime sources of information on system performance and potential bottlenecks. PMU capabilities, such as counting and sampling detailed micro-architectural events, can be used in higher-level analysis in order to identify the causes of suboptimal system performance as well as the instructions or data addresses that are involved in high-latency events. In addition, PMUs are capable of providing quantitative data on the interaction among cores in a multicore environment. In this paper, we provide an overview of our collective effort, over the last several years, in utilizing the advanced capabilities of modern PMUs to enhance operating system support on multicore processor systems. Using three case studies, we demonstrate the agility and low runtime overhead of PMU-based monitoring, which enables new opportunities for multicore runtime optimizations at the operating system level. We show how raw, low-level PMU-generated information can be used to build higher level abstractions that accurately identify the intensity of communication or contention among threads. In all three cases, with minor modifications to the operating system, much of the inter-thread communication or contention can be reduced, resulting in substantial performance improvements when running workloads such as SPECcpu2000, SPECcpu2006, SPECjbb2000, SPEComp2001, VolanoMark, and RUBiS. We have structured this paper as follows. First, we describe the challenges of bottleneck analysis on a traditional single-core processor. Techniques developed for bottleneck analysis serve as conceptual building blocks for analyzing the performance of multiprocessor systems built out of several multicore chips. We then present two approaches for dealing with the issue of contention in shared on-chip caches. The first approach, which we describe in Case Study 1, uses guided software cache partitioning to address the issue of uncontrolled contention among applications in a multiprogrammed environment, resulting in up to 27% IPC (instructions-per-cycle) improvement. The second approach, which we describe in Case Study 2, reduces the harmful effects of pollution in a shared cache within a single multithreaded application, resulting in up to 10% reduction in cache miss rates, leading up to 7% IPC improvement. Finally, in Case Study 3, we describe our effort in addressing the issue of non-uniform inter-core communication latency
by automatically detecting sharing among threads and then migrating threads to improve locality, which results in up to 70% reduction in remote cache accesses, leading up to 7% application-level improvement.
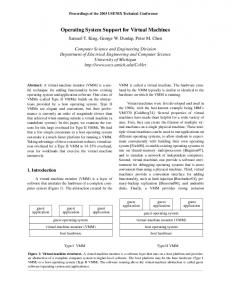
2. Hardware Performance Monitoring Most modern microprocessors contain PMUs that can be used to monitor and analyze performance in real time. By using several registers, often called hardware performance counters (HPCs), PMUs support the counting or sampling of detailed micro-architectural events. The number of HPCs in today’s PMUs is often too small for online performance monitoring of a system. To cope with this, we use finegrained HPC multiplexing to make a much larger set of logical HPCs available [3]. In this section, we describe the two PMU features that we have extensively utilized in our operating system-level optimizations: stall breakdown, and data address sampling. 2.1 Stall Breakdown It is often difficult to directly interpret the values of performance counters because they count detailed low-level microarchitectural events of a complex system consisting of many interacting components. Measuring the impact of each individual event on processor performance is non-trivial because several unpredictable factors are involved. For instance, the significance of having a 1% miss rate in the L2 cache depends on the penalty that each L2 miss incurs directly (by causing latency in the execution of instructions) or indirectly (by causing other execution pipeline structures to saturate, or other useful cache lines to be replaced). This penalty is even more difficult to measure in out-of-order processors because many instructions are simultaneously in-flight so as to hide memory latency. Our approach in tackling this problem on out-of-order pipelined processors is to build a simplified average cyclesper-instruction (CPI) breakdown model, where processor cycles are attributed to either completion cycles or stall cycles [3]. A completion cycle is a cycle in which there is at least one instruction at the end of the execution pipeline, which can be retired. In contrast, a stall cycle is a cycle in which there are no instructions at the end of the execution pipeline, due to a variety of reasons, and therefore there are no instructions that can be retired. By exploiting PMU features, such as on IBM POWER processors, stall cycles can be attributed to specific causes, such as a cache miss, branch misprediction, or TLB (translation look-aside buffer) miss. Figure 1 shows an example of the stall breakdown for fft during execution. The key observation in this particular example is that misses in the TLB address translation data structures are a primary source of many stalls during certain phases of the program. While the stall breakdown model may involve some inaccuracies, focusing solely on stall cycles is adequate to
Figure 2. Partitioning a shared cache. Figure 1. The stall breakdown of fft over a period of 40 billioncycles, obtained using the IBM POWER5 PMU.
.
identify potential performance bottlenecks in the processor, which often cause many of these stall cycles. Our experience with this model in several case studies shows that having the operating system focus on alleviating significant sources of stall indeed results in substantial performance gains at the application level [31, 34, 36, 40]. 2.2 Data Address Sampling Hardware support for data address sampling is present in many modern micro-architectures including the IBM POWER5 [30], Intel Itanium [16], Sun UltraSparc [26], and AMD 10h processors (e.g., Barcelona and Shanghai) [1]. In most architectures, a special data address register (DAR) is dedicated for sampling data addresses. The DAR is automatically updated by the PMU with the operand of a memory instruction (load or store) upon certain user-specified events such as a data cache miss or a TLB miss. Hardware data address sampling is particularly useful for analyzing the performance of multicores since the interaction among cores typically occurs through the sharing of data. Therefore, if the PMU is capable of identifying the source from which a sampled data address is fetched, one can characterize the specific data sharing and general contention patterns of multithreaded applications running on multiple cores. In Section 5 we show how the operating system can characterize the sharing patterns of threads using data sampling features of the POWER5 multicore processor in order to co-locate sharing threads as close to each other as possible. Furthermore, by having accurate information on the general cache access pattern of applications, one can measure the intensity of contention on the shared on-chip cache and identify its patterns. In this paper we will provide two example case studies of this type of analysis. The first example, in Section 3, is based on the fact that the cache requirements of applications can be estimated by knowing the reuse-distance of individual cache lines. The second example, in Section 4, is based on the observation that some address regions constantly pollute the cache without benefiting from it.
2.3 Summary and Preview In the subsequent sections, we present three case studies in which we implement operating system-level optimizations that target multithreaded or multiprogrammed workloads on multicore systems. We show how stall breakdown and data address sampling can be used effectively in these optimization techniques. At the end, we propose minimal PMU extensions that we believe will facilitate the development of additional runtime optimization techniques for multicore systems, and are sufficiently simple to be implemented in future mainstream multicore processors. i
3. Case Study 1: Reducing Cache Contention 3.1 Problem Description On-chip shared caches that exist in most multicore processors are often contended resources because several cores can freely access the entire cache. This cache is traditionally not managed by the operating system, leading to uncontrolled cache contention among applications. This contention occurs because the current cache line replacement policy of least-recently-used (LRU), implemented in hardware, does not differentiate between cache lines belonging to different applications. This indifference can lead to scenarios where an application running on one core continually evicts useful cache content belonging to another application running on another core without obtaining a significant improvement for itself. Consider, for example, an MP3 player that streams through a lot of data without reuse. It severely and continuously pollutes the entire shared cache with an attendant drastic effect on the performance of other applications running on other cores of the processor. Uncontrolled cache sharing also reduces the ability to enforce priorities and to provide quality-of-service (QoS) guarantees. For example, a low priority application may run on one core, rapidly consuming the entire shared cache, causing it to remove the working set of a higher priority application that is running on another core. 3.2 Our Solution The problem of contention, caused by uncontrolled cache sharing among applications, can be addressed by partitioning the shared cache among the applications, such as shown in Figure 2. In effect, a large shared cache is partitioned into
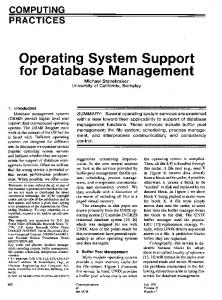
L2 Cache Miss Rate (MPKI)
Avg. Stall Cycles (millions)
1
180 160 140 120 100 80 60 40 20 0
Online Offline
0.8 0.6 0.4 0.2 0
0
2 4 6 8 10 12 14 16 L2 Cache Size (# of colors)
(a)
0
2
4
6
8
10 12 14 16
L2 Cache Size (# of colors)
(b)
Figure 4. (a) The cache stall-rate curve of vortex obtained using PMUs, and (b) The cache miss-rate curve of vortex obtained both offline and online. The sampling frequency in both cases is set to 1 billion cycles.
Figure 3. Page and cache line mapping. several smaller private caches, with each partition assigned to a different application. Extensions could include creating partitions that allow various degrees of sharing among specific applications, ranging from completely private to fully shared. Assuming that the partitioning mechanism is in place, the next requirement is to determine an appropriate cache partition size to allocate to each application while considering global system benefit. In general, the larger the allocated partition, the better the performance. However, marginal gains typically diminish as the partition size becomes larger, and at some point, it may be more profitable to allocate larger partition sizes to other applications that would experience larger marginal gains. Below, we describe how the cache partition mechanism can be implemented purely in software by the operating system, and we describe offline and online techniques to determining the appropriate partition sizes using PMUs. 3.2.1 Software-Based Cache Partitioning Our software-based implementation of the cache partitioning mechanism is described fully in [34]. We implemented the mechanism in the operating system to enable partitioning of the on-chip shared L2 cache by guiding the allocation of physical pages. More specifically, to provide software-based cache partitioning, we simply apply the classic technique of operating system page-coloring [5, 23, 29]. When a new physical page is required by a target application, the operating system allocates a page that maps onto a section of the L2 cache assigned to the target application. By doing so for every new physical page request of the target application, we isolate L2 cache usage of the application. Figure 3 illustrates the page-mapping technique in general. In a physically indexed L2 cache, every physical page has a fixed (unchangeable) mapping to a physically contiguous group of cache lines. The figure shows that there are several physical pages labeled Color A that all map to the same group of physically contiguous L2 cache lines labeled Color A. The figure also shows that physical pages of the
same color are given to the same application. For example, physical pages of Color A have been assigned solely to application process A. The operating system is responsible for this mapping of virtual-to-physical memory pages and it is this capability that enables control of L2 cache usage and isolation. We implemented this mechanism in Linux by modifying the physical page allocation component of the operating system. Other researchers have also applied this technique, demonstrating its viability [9, 10, 21, 22]. Architecture researchers have even proposed hardware designs and implementations of the cache partitioning mechanism for potential inclusion in future multicore processors [7, 14, 17, 18, 19, 27, 28, 33]. 3.2.2 Determining Partition Size In terms of determining the appropriate partition size, there are three possibilities: (1) the appropriate size could already be well-known to the system administrator based on domain expertise; (2) it could be determined by trying all possible sizes; (3) the appropriate size could be predicted by using an analytical model of allocated cache partition size versus resulting performance impact. One simple offline method of determining the appropriate partition size is to run each application multiple times in isolation, each time using a different partition size and measuring its resulting performance. The metric for measuring performance could be instructions-per-cycle (IPC), execution pipeline stall rate due to data cache misses such as shown in Figure 1, or cache miss rate, which can all be measured using PMUs. Higher application-level metrics are also possible, such as total run time, throughput, latency, or interactive response times. This particular offline method identifies the entire tradeoff spectrum between allocated cache partition size and resulting performance of an application. An example of such a trade-off spectrum, obtained using PMUs, is shown in Figure 4(a). It shows the resulting execution pipeline stalls due to cache misses as a function of the cache size. We refer to this particular graph as the cache stall-rate curve.
Combo IPC Improvement
twolf+equake 27% for twolf 0% for equake
vpr+applu 12% for vpr 0% for applu
ammp+3applu’s 14% for ammp 0% for 3 applu’s
Table 1.
The effect of cache partitioning using online L2 MRCs on the IPC of selected multiprogrammed workloads. The IPC improvements are measured compared to the default Linux scheduler (uncontrolled sharing).
As far as software-based online methods of determining the appropriate partition size, only trial and error techniques have been employed so far, although they typically use a form of binary search to reduce the number of trials [19, 22]. With these approaches, determining the best sizes for more than two applications is non-scalable because the number of possible size combinations grows exponentially with the number of applications. Using PMUs, however, we have developed a technique to obtain the L2 cache miss-rate curve (MRC) online [35]. MRC is a curve that shows the cache miss rate as a function of cache size for an application at a particular point in time. We show that using MRCs is a practical online means to determining the optimal cache partition size, capable of running on commodity processors. Figure 4(b) shows an example of the L2 MRC captured online, with the miss rate expressed in terms of misses-per-thousand-instructions (MPKI). To obtain the online L2 MRC on a POWER5 multicore processor, we exploit its data address sampling capability, as described in 2.2. We record the data address upon L1 data cache miss events to create a trace of nearly all L2 cache accesses over a short period of time. This trace is then fed into Mattson’s stack algorithm to produce the L2 MRC [24]. 3.3 Performance Results We demonstrate in [34] that a software-based cache partitioning mechanism can rectify the problem of uncontrolled cache sharing. Our implementation, in the Linux 2.6.15 operating system running on an IBM POWER5 multicore processor, is effective in reducing cache contention in multiprogrammed SPECcpu2000 and SPECjbb2000 workloads. By exploiting the PMU, our online method of determining cache partition sizes is capable of producing accurate MRCs for the L2 cache [35]. Figure 4(b) illustrates an example of this accuracy. Using online L2 MRCs to size cache partitions, IPC improvements of up to 27% were achieved for one of the applications without affecting the IPC of the other simultaneously running applications, as shown in Table 1.
4. Case Study 2: Reducing Cache Pollution 4.1 Problem Description Cache pollution can be defined as the displacement of a cache element by a less useful one. In the context of processor caches, cache pollution occurs whenever a non-reusable cache line is installed into a cache set, displacing a reusable
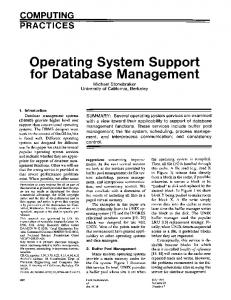
cache line. Reusability is determined by the number of times a cache line is accessed after it is initially installed into the cache but before its eviction. Processor cache pollution is an important contributor to performance degradation caused by interference between threads sharing a cache on a multicore processor. The use of multithreaded applications is particularly interesting since it is one class of applications for which coarse-grain, processlevel cache partitioning, as discussed in the previous section, is not applicable. 4.2 Our Solution To attack the problem of pollution in shared caches, we extend the operating system-based cache-filtering system presented in [31]. The idea behind the operating systembased cache-filtering system is to identify application pages that receive little benefit from caching, and restrict those pages to a small portion of the cache, which we refer to as the pollute buffer. Restricting the cache space occupied by pages that cause cache pollution allows for more efficient use of the remainder of the cache space. The expected result is an overall increase in cache performance. 4.2.1 Detecting Cache Pollution Online A metric commonly used to classify polluting cache lines is reuse distance. That is, cache lines with a large or infinite reuse distance, pollute the cache by displacing useful cache lines, which are those with a smaller reuse distance. As a practical online approximation of reuse distance, we use miss rate, which can be calculated from events available in the PMU of the processor. To identify pages that cause pollution in the shared cache, our system monitors L2/L3 cache hits and misses, recording their virtual addresses and constructing an online page-granularity cache profile of the application. This is done by using the data address sampling technique described in Section 2.2. Specifically, we are interested in monitoring cache pollution at the last-level cache (L3, in our platform) before reaching main memory. For this purpose, we apply data sampling to monitor L3 hits and misses, and derive per-page L3 miss rates. In a multicore system, all cores cooperate in constructing the profile by independently monitoring the locally scheduled thread. Samples from all cores are aggregated per address space. This enables the creation of online cache profiles for both multiprocessed workloads, which have separate address spaces, and multithreaded applications, which have a single shared address space. An example of a multithreaded page-granularity online cache profile is depicted in Figure 5. It shows the online L3 profile of the swim benchmark from SPEComp2001, executing with 2 threads on a POWER5 multicore processor. The depicted profile clearly shows that there are regions in the address space that do not benefit from caching because their pages exhibit low hit rates. For example, the region spanning virtual page index 100,000 to 150,000 does not
Number of Accesses (hits & misses)
Chip 1
1800 1600 1400 1200 1000 800 600 400 200 0
Chip 2
Chip 1
Chip 2
Misses Hits
0
5000
10000
15000 20000 Virtual page index
25000
30000
35000
(a) default
(b) clustered
Figure 5. Page-granularity L3 cache miss rate characterization of
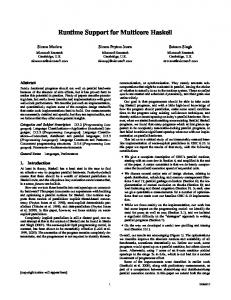
Figure 6. Default versus clustered scheduling. The solid lines
swim-OMP with 2 concurrent threads, obtained using PMUs. The histogram shows a compact view of the address space, with each bar representing the number of accesses to a page.
represent high-latency cross-chip communication traffic, while the dashed lines represent low-latency intra-chip communication traffic via the on-chip L1 and L2 caches.
5. Case Study 3: Improving Locality 5.1 Problem Description benefit from the cache because it experiences all misses and no hits. 4.2.2 Software-Based Cache Pollute Buffer With PMUs providing online information about cache pollution, the operating system can effectively reduce this problem by restricting the pages identified as cache polluters to a small partition in the cache, called the pollute buffer. The pollute buffer serves as a staging area for cache lines that exhibit bursty or no reuse before eviction. By restricting cache unfriendly pages to the pollute buffer, we eliminate competition between pages that pollute the cache and pages that benefit from caching. In our system, the pollute buffer is implemented using page coloring as described in Section 3.2.1. In essence, a single partition of the cache is designated as the pollute buffer. The cache indexing of the POWER5 processor allows for 16 separate partitions. Therefore, our implementation of the pollute buffer comprises 1/16th of the cache, which equals to 120 kB of the L2 cache and 2.25 MB of the L3 cache. Since the address space, and hence virtual-to-physical page mapping, is shared among multiple threads of a process, the pollute buffer is naturally shared among all threads. In addition, initial experiments with multiprocessed workloads indicate that it is beneficial for all processes to share the same pollute buffer. Therefore, our implementation dedicates a single fixed partition to serve as a global pollute buffer, irrespective of the address space. 4.3 Performance Results We have evaluated our pollute buffer-based technique on the SPEComp2001 benchmark suite using the reference inputs, on a POWER5 multicore processor. In our experiments, we enabled 2 threads, scheduled on 2 cores located on the same chip. These cores share a 1.8 MB L2 cache and a 36 MB L3 cache. L3 miss rate reductions of up to 10% were observed, leading to 7% improvement in IPC.
A key difference between traditional SMP multiprocessors and systems built out of several multicore processors is that the communication latency between two cores is not constant but varies depending on their physical proximity. For cores that reside on the same chip, communication typically occurs through the shared on-chip cache, with a latency of 10 to 30 cycles. However, cores that reside on separate chips communicate through the memory interconnect with an average latency of hundreds of cycles. Operating system schedulers typically do not take the non-uniform sharing latencies into account. As a result, threads that heavily share data will not typically be colocated on the same chip. Figure 6 shows an example where two clusters of threads are distributed across the processing units of two chips. The distribution is usually done as a result of a dynamic load-balancing scheme in the operating system scheduler. If the volume of intra-cluster sharing is high, a traditional scheduling algorithm may place threads as shown in Figure 6(a), resulting in a lot of high-latency cross-chip communication, shown by the solid lines. If the operating system can detect thread sharing patterns and schedule the threads accordingly, then threads that communicate heavily could be scheduled to run on the same chip, causing most of the communication to occur in the form of on-chip L1 or L2 cache sharing, as shown by the dashed lines in Figure 6(b). However, automatically detecting sharing patterns of threads is challenging and has been thought to require either special hardware monitoring support or intrusive instrumentation. In this case study, we briefly demonstrate how the data address sampling capabilities of the POWER5 PMU can be used online to efficiently identify high-latency sharing among threads, allowing the operating system to cluster threads accordingly. 5.2 Our Solution Our thread clustering approach consists of four phases. In the first phase, by using the stall breakdown model described in Section 2.1, execution pipeline stall cycles are broken down and attributed to various processor components, enabling the operating system to determine whether cross-chip
Cache Stall Reduction (%) Speedup (%)
Table 2.
Figure 7. The stall breakdown of VolanoMark, obtained using PMUs. Stalls due to data cache misses are further decomposed according to the source of resolution.
communication is substantial. Figure 7 shows an example of the stall break down for VolanoMark, a multithreaded chat server workload, where remote cache misses are shown to be responsible for approximately 7% of the stall cycles. In the second phase, sharing patterns among threads are tracked using the data address sampling features of the PMU described in Section 2.2. In the third phase, threads are clustered based on their sharing patterns so that threads with a high degree of data sharing are placed into the same cluster. Finally, the operating system scheduler attempts to migrate threads so that threads of the same cluster are as close together as possible. In this paper, we only briefly describe our PMU-based scheme for detecting sharing patterns. However, the full details of our method for sharing detection and thread clustering are described in [36]. 5.2.1 Detecting Sharing Patterns Online We use data address sampling to monitor the addresses of remote cache misses and construct a summary data structure for each thread, called shMap. Each shMap is essentially a vector of 8-bit wide saturating counters. Each vector is given only 256 of these counters (entries) so as to limit overall space overhead. In essence, each counter corresponds to a region in the virtual address space and its value represents the amount of detected sharing of that region for that thread. We use a region size of 128 bytes, which is the unit of cache coherence in our system. Since the number of regions is much larger than the number of entries in a shMap vector, we use a simple hash function to map these regions to corresponding entries in the shMap. A shMap entry is incremented only when the corresponding thread incurs a remote cache access on the region. Note that threads that share data but happen to be located on the same chip will not cause their shMaps to be updated because they do not incur any remote cache accesses. We rely on the PMU to provide us with the addresses of remote cache accesses. Unfortunately, this feature is not
VolanoMark 32 5
RUBiS 25 7
SPECjbb2000 70 6
Thread Clustering performance results.
directly available in most PMUs, including our POWER5 PMU. Instead, we use an indirect method to capture the address of remote cache accesses with reasonable accuracy [36]. In this method the addresses of L1 cache misses are recorded continuously, using the PMU features of the POWER5 processor. However, a data address sample is taken only when a performance counter that counts the number of access to a remote source overflows. As a result, the “last” L1 data cache miss is likely to be the one to have required a remote cache access and caused its corresponding performance counter to overflow. To cope with the high volume of data, we record and process only one in N occurrences of remote cache access events. The value of N is further adjusted by taking two factors into account: (i) the frequency of remote cache accesses, which is measured by the PMU, and (ii) the runtime overhead. Also, given the small size of the shMap vector, the potential rate of hash collisions may become too high. In order to reduce the collision rate and eliminate its undesired aliasing effects, we use spatial sampling. Rather than monitor the entire virtual address space, we select a fairly small sample set of regions to be monitored for remote cache accesses. The regions are selected somewhat randomly, but there must be at least one remote cache access on a region to make it eligible to be selected. These inaccuracies and relaxed conditions are acceptable because we are only looking for rough indications of sharing and do not need full accuracy. The underlying idea is that once a high level of sharing is detected on a subset of cache lines, it is a clear indication that the actual intensity of sharing is high enough to justify clustering. 5.3 Performance Results We have designed and implemented our thread clustering scheme in Linux 2.6.15. We used three multithreaded commercial server workloads to evaluate our work: (1) VolanoMark, which is an Internet chat server workload; (2) SPECjbb2000, which is a Java-based application server workload; and (3) RUBiS, which is an online transaction processing (OLTP) database workload. The multiprocessor used in our experiments is an IBM OpenPower 720 computer. It is an 8-way IBM POWER5 machine consisting of 2 chips, each with 2 cores, each core containing 2 SMT (simultaneous multithreading) hardware threads. Table 2 demonstrates a summary of our experimental results which shows a reduction in remote cache access stalls by up to 70%, and performance improvements of up to 7% accross the selected applications.
6. Discussion Advanced PMU capabilities, especially those that are relevant to multicore processor systems, allow us to observe hardware behavior more precisely and make smarter decisions at the operating system level. We have shown how advanced PMU features, such as stall breakdown and data address sampling can be used to create new monitoring capabilities such as (i) identifying shared data at a fine granularity, such as at a single cache line, and (ii) measuring the level of contention in shared on-chip caches. With these new capabilities, we have demonstrated the value of hardware performance monitoring in dynamically enhancing the performance of a system composed of multicore processors. We should note that many of the optimization techniques that target multicore systems, such as the thread clustering method presented in this paper, are also applicable to traditional NUMA (non-uniform memory access latency) multiprocessor systems, as both architectures share some basic hardware characteristics such as non-uniform interprocessor communication latency. In fact, there has been a vast amount of work done on improving software performance in the realm of NUMA systems research from which the research effort on multicore systems can learn many lessons [2, 4, 6, 8, 11, 13, 20, 25, 37, 38, 39]. However, in retrospect, we observe that an important component that was missing in NUMA systems research is the advanced PMU features that are now available on commodity processors. 6.1 PMU Extensions Although we have shown some uses of existing PMUs in helping us achieve improved performance on multicore systems, we argue that there are additional PMU features that would enable further online optimization opportunities, and yet are sufficiently simple to be implemented in mainstream processors. 6.1.1 Trace Buffer The existing mechanism of raising and handling an exception in order to record each data sample has several drawbacks. First, it incurs high overhead and substantial measurement perturbation if used at high frequency. Secondly, due to execution pipeline flushes at exception handler invocation time, many concurrent memory instructions in the execution pipeline that are potentially eligible to be sampled will pass unnoticed, and therefore, the collected data access trace will be incomplete. Finally, data sampling cannot be conducted in critical areas such as in the operating system kernel where interrupts are temporarily disabled. Based on these observations, we believe that it would be useful for the PMU to be capable of tracing data addresses into a small trace buffer without having to interrupt the processor to record each individual sample. In this scheme, an overflow exception would be raised only when the buffer is full, amortizing the cost of exception handling over many
data samples and also substantially reducing perturbation. The PMU would also then be capable of recording all eligible memory instructions, despite having potentially several of them in-flight. Intel’s Precise Event-Based Sampling (PEBS) mechanism currently implements a similar buffering mechanism [32]. In this mechanism, the user allocates a buffer in main memory and configures a sampling performance counter. Once the sampling counter overflows, a micro-assist consisting of hardware microcode is triggered, which saves the current state of the execution into the user-designated memory buffer. In this design, a memory overflow exception is triggered only when the user buffer is full. However, there are three important drawbacks with the PEBS mechanism. First, PEBS does not directly provide the data address operand of memory instructions. In order to obtain data addresses, the operating system would have to perform complex and potentially costly decoding tasks on the running binary to identify the register operands of memory instructions. Secondly, PEBS saves all architectural registers into the memory buffer, making the mechanism unnecessarily expensive, both in terms of its effect on the common-path execution of the processor and its potentially large memory foot-print. For most data analysis, recording only data addresses and their sources would suffice. Finally, PEBS is an instruction tagging-based scheme, where specific instructions are randomly selected and tagged to be monitored by the PMU while they pass through the stages in the execution pipeline. The problem with instruction tagging schemes is that among the many instructions that are flowing in the execution pipeline, very few instructions (usually one) have a chance to be tagged, and as a result, potentially many important data accesses pass unnoticed through the execution pipeline. This becomes particularly problematic, for example, when attempting to capture and analyze reuse-distances of cache lines, such as done in Section 3.2.2 for online L2 MRC generation, where, at least for a short period of time, every cache access should be recorded. 6.1.2 Precise Data Source Information In our experience, it is important to be able to precisely identify the storage source from which the data is fetched. Different storage sources include the L1 cache, the local shared L2 or neighboring private L2 caches (in multicores), remote L2 caches (in SMP systems), local or remote L3 caches (in some SMP systems), and local or remote DRAM memory modules (in NUMA systems). Having the source information helps the operating system determine what data item is experiencing performance problems at which location in the hierarchy. Currently, there are two alternatives for extracting the data source information, and both have their own drawbacks. The first, is to use instruction tagging available in most mainstream processors, which are capable of providing the source of a cache miss to some extent. This capability is called Instruction Marking in the IBM POWER [15] and In-
tel processors [32], and Instruction-Based Sampling (IBS) in the AMD 10h processors (e.g., Barcelona and Shanghai) [1]. However, as explained above, these instruction tagging approaches can miss an unknown number of eligible events, and as a result, it is difficult to precisely control the sampling rate of a particular event. An alternative is the Continuous Data Address Sampling capability implemented in the IBM POWER5 processor: the data address register is continuously updated by the PMU as memory instructions with operands that match a selection criterion arrive in the pipeline and are issued. The main advantage of this approach is that all data addresses used as operands for memory instructions have an equal chance to be seen by software. This is an important property as it ensures that the software has full control over the actual sampling scheme. Unfortunately, the POWER5 does not provide accurate data source information for each update in the data address register, and as result, one must use speculative methods to determine the source of data indirectly, as described in Section 5.2.1 for detecting sharing patterns, with some attendant inherent inaccuracies. In essence, what is required is a continuous data sampling mechanism that records the source of data along with each data address that is sampled.
7. Concluding Remarks Multicore processors address fundamental challenges that have appeared in the evolution of processor architectures, such as the memory wall, power wall, and design complexity. This fundamental shift in processor architecture requires extensive support from systems software in order to achieve the full potential in terms of performance and power efficiency. In this paper, we have demonstrated our effort in utilizing the hardware performance monitoring features of modern multicore processors to serve as a component in dynamic optimization techniques. PMUs provide fine-grained and real-time information about the performance of a running system. We have demonstrated how simple features, such as hardware data sampling, can be used either to characterize cache contention and pollution in on-chip shared caches, or to identify sharing patterns among threads. Based on the features that are available in the IBM POWER5 multicore processor, such as data sampling and stall breakdown, we have implemented three runtime optimization techniques in the operating system that all result in significant performance improvements. By showing the utility of the PMU features of a real server processor for online optimizations, we intend to motivate the adoption of similar features in other mainstream processors (e.g., the X86 families). Our experience shows that PMUs are capable of providing accurate and timely information on the low-level behavior of multicore software, including inter-thread communication patterns and their contention on system resources. While existing PMU designs could certainly be enhanced in many ways, including the type of information they provide
and the runtime overhead they incur, we believe that operating system designers should provide more cases of real performance improvements, which are only made possible by using accurate PMU-generated information, in order to further motivate the evolution of PMUs. Perhaps the largest impediment to utilizing PMUs more generally is the fact that their capabilities and interfaces vary considerably across different processor architectures, or even within the same family of processors. We strongly argue that PMU interfaces and functionality should be standardized in an implementation-independent fashion so that they can be visible in the Instruction Set Architecture (ISA) specification. Otherwise, the large costs of constantly porting software as PMU features change from one processor revision to another, will seriously hinder the wide adoption of PMU capabilities.
References [1] BIOS and Kernel Developer’s Guide (BKDG) For AMD Family 10h Processors. AMD, Sept. 2007. [2] J. Appavoo, D. Da Silva, O. Krieger, M. Auslander, M. Ostrowski, B. Rosenburg, A. Waterland, R. Wisniewski, J. Xenidis, M. Stumm, and L. Soares. Experience distributing objects in an SMMP OS. ACM Transactions on Computer Systems (TOCS), 25(3):6:1–6:52, Aug. 2007. [3] R. Azimi, M. Stumm, and R. Wisniewski. Online performance analysis by statistical sampling of microprocessor performance counters. In Int’l Conf. on Supercomputing (ICS), 2005. [4] F. Bellosa and M. Steckermeier. The performance implications of locality information usage in shared-memory multiprocessors. J. of Parallel & Distributed Computing, 37(1):113–121, Aug. 1996. [5] B. Bershad, D. Lee, T. Romer, and J. Chen. Avoiding conflict misses dynamically in large direct-mapped caches. In Int’l Conf. on Architectural Support for Programming Languages & Operating Systems (ASPLOS), 1994. [6] R. Bryant, H.-Y. Chang, and B. Rosenburg. Operating system support for parallel programming on RP3. IBM J. of Research & Development, 35(5-6):617–634, Sept./Nov. 1991. [7] D. Chandra, F. Guo, S. Kim, and Y. Solihin. Predicting interthread cache contention on a chip multi-processor architecture. In Int’l Symp. on High Performance Computer Architecture (HPCA), 2005. [8] J. Chapin, A. Herrod, M. Rosenblum, and A. Gupta. Memory system performance of UNIX on CC-NUMA multiprocessors. In Int’l Conf. on Measurement & Modeling of Computer Systems (SIGMETRICS), 1995. [9] S. Cho and L. Jin. Managing distributed, shared L2 caches through OS-level page allocation. In Int’l Symp. on Microarchitecture (MICRO), 2006. [10] S. Cho and L. Jin. Better than the two: Exceeding private and shared caches via two-dimensional page coloring. In Workshop on Chip Multiprocessor Memory Systems and Interconnects (CMP-MSI), 2007.
[11] J. Corbalan, X. Martorell, and J. Labarta. Evaluation of the memory page migration influence in the system performance: the case of the SGI O2000. In Int’l Conf. on Supercomputing (ICS), 2003.
[27] M. Qureshi and Y. Patt. Utility-based cache partitioning: A low-overhead, high-performance, runtime mechanism to partition shared caches. In Int’l Symp. on Microarchitecture (MICRO), 2006.
[12] M. Flynn and P. Hung. Microprocessor design issues: Thoughts on the road ahead. IEEE Micro, 25(3):16–31, 2005.
[28] N. Rafique, W. Lim, and M. Thottethodi. Architectural support for operating system-driven CMP cache management. In Int’l Conf. on Parallel Architecture & Compiliation Techniques (PACT), 2006.
[13] B. Gamsa, O. Krieger, J. Appavoo, and M. Stumm. Tornado: Maximizing locality and concurrency in a shared memory multiprocessor operating system. In Symp. on Operating Systems Design & Implementation (OSDI), 1999. [14] F. Guo and Y. Solihin. An analytical model for cache replacement policy performance. In Int’l Conf. on Measurement & Modeling of Computer Systems (SIGMETRICS), 2006. [15] IBM PowerPC 970FX RISC Microprocessor User’s Manual. IBM, 2006. [16] Intel Itanium 2 Reference Manual: For Software Development & Optimization. Number 251110-003. Intel, May 2004. [17] R. Iyer. CQoS: a framework for enabling QoS in shared caches of CMP platforms. In Int’l Conf. on Supercomputing (ICS), 2004. [18] H. Kannan, F. Guo, L. Zhao, R. Illikkal, R. Iyer, D. Newell, Y. Solihin, and C.Kozyrakis. From chaos to QoS: Case studies in CMP resource management. In Workshop on Design, Architecture, & Simulation of Chip Multi-Processors (dasCMP), 2006. [19] S. Kim, D. Chandra, and Y. Solihin. Fair cache sharing and partitioning in a chip multiprocessor architecture. In Int’l Conf. on Parallel Architecture & Compiliation Techniques (PACT), 2004. [20] R. LaRowe, J. Wilkes, and C. Ellis. Exploiting operating system support for dynamic page placement on a NUMA shared memory multiprocessor. In Symp. on Principles & Practice of Parallel Programming (PPoPP), 1991. [21] J. Liedtke, H. H¨artig, and M. Hohmuth. OS-controlled cache predictability for real-time systems. In Real-Time Technology & Applications Symp. (RTAS), 1997. [22] J. Lin, Q. Lu, X. Ding, Z. Zhang, X. Zhang, and P. Sadayappan. Gaining insights into multicore cache partitioning: Bridging the gap between simulation and real systems. In Int’l Symp. on High Performance Computer Architecture (HPCA), 2008. [23] W. Lynch, B. Bray, and M. Flynn. The effect of page allocation on caches. In Int’l Symp. on Microarchitecture (MICRO), 1992. [24] R. Mattson, J. Gecsei, D. Slutz, and I. Traiger. Evaluation techniques and storage hierarchies. IBM Systems J., 9(2):78– 117, 1970. [25] J. Mellor-Crummey and M. Scott. Algorithms for scalable synchronization on shared-memory multiprocessors. ACM Transactions on Computer Systems (TOCS), 9(1):21–65, Feb 1991. [26] L. Noordergraaf and R. Zak. SMP system interconnect instrumentation for performance analysis. In Conf. on Supercomputing (SC), pages 1–9, 2002.
[29] T. Sherwood, B. Calder, and J. Emer. Reducing cache misses using hardware and software page placement. In Conf. on Supercomputing (SC), 1999. [30] B. Sinharoy, R. Kalla, J. Tendler, R. Eickemeyer, and J. Joyner. POWER5 system microarchitecture. IBM J. of Research & Development, 49(4/5):505–522, 2005. [31] L. Soares, D. Tam, and M. Stumm. Reducing the harmful effects of last-level cache polluters with an OS-level, softwareonly pollute buffer. In Int’l Symp. on Microarchitecture (MICRO), 2008. [32] B. Sprunt. Pentium 4 performance monitoring features. IEEE Micro, 22(4):72–82, Jul./Aug. 2002. [33] E. Suh, L. Rudolph, and S. Devadas. Dynamic partitioning of shared cache memory. J. of Supercomputing, 28(1):7–26, 2004. [34] D. Tam, R. Azimi, L. Soares, and M. Stumm. Managing shared L2 caches on multicore systems in software. In Workshop on the Interaction between Operating Systems and Computer Architecture (WIOSCA), 2007. [35] D. Tam, R. Azimi, L. Soares, and M. Stumm. RapidMRC: Approximating L2 miss rate curves on commodity systems for online optimizations. In Int’l Conf. on Architectural Support for Programming Languages & Operating Systems (ASPLOS), 2009. [36] D. Tam, R. Azimi, and M. Stumm. Thread clustering: Sharing-aware scheduling on SMP-CMP-SMT multiprocessors. In European Conf. on Computer Systems (EuroSys), 2007. [37] M. Tikir and J. Hollingsworth. Using hardware counters to automatically improve memory performance. In Conf. on Supercomputing (SC), 2004. [38] B. Verghese, S. Devine, A. Gupta, and M. Rosenblum. Operating system support for improving data locality on CCNUMA compute servers. In Conf. on Programming Language Design & Implementation (PLDI), 1996. [39] K. Wilson and B. Aglietti. Dynamic page placement to improve locality in CC-NUMA multiprocessors for TPC-C. In Conf. on Supercomputing (SC), 2001. [40] M. Zaleski. YETI: a graduallY Extensible Trace Interpreter. PhD thesis, Univ. Toronto, 2008.