A novel computer system hardware has been built for compressing main memory .... In Section 3 we describe the memory compression support we added to the.
To appear in the Memory Wall Workshop to be held in conjunction with the 27th Ann. Int. Sym. On Computer Architecture (ISCA’2000) Vancouver, B.C., June 11, 2000.
Operating System Support for Fast Hardware Compression of Main Memory Contents Bulent Abali and Hubertus Franke IBM T.J.Watson Research Center P.O.Box 218, Yorktown Heights, NY 10598 {abali,frankeh}@us.ibm.com
Abstract A novel computer system hardware has been built for compressing main memory contents. This presents to the operating systems an expanded real memory larger than the physically available memory. Two to one or better compression ratio has been observed for most applications. As the compression ratio of applications dynamically changes so does the real memory size that is managed by the OS. In this paper, we describe and evaluate the operating system techniques developed for compressed memory systems that can deal with such dynamically changing memory size conditions.
1. Introduction Data compression techniques are extensively used in computer systems to save storage space or bandwidth. Both hardware and software based compression schemes are used for storing data on magnetic media or for transmitting data over network links. While compression techniques are prevalent in various forms, hardware compression of main memory contents has not been used to date. Recent advances in parallel compressiondecompression algorithms coupled with improvements in silicon density and speed now makes main memory compression practical [1,2]. A high-end, Pentium based, server class compressed memory hardware has been designed and built at IBM Research [8]. In this paper, we describe and evaluate the operating system principles developed for compressed memory systems. We will often use the term “expanded memory” for the “real memory”, since compression increases the effective memory size and we will use the term “compressed memory” for the “physical memory” backing this expanded memory. Memory footprints of large number of applications show that main memory contents can be compressed by a factor of 2 to 1 or more in most cases. Only few applications’ data, which are already compressed or encrypted, cannot be further compressed. Two to one compression effectively doubles the amount of memory at the same cost, or in cost sensitive applications gives the same amount of memory at ½ the cost. The compressed memory architecture adds one more level to the conventional memory hierarchy. A distinction between “real” and “physical” addresses is made. Real addresses are the conventional memory addresses seen on the processor chip's external bus. Physical addresses are used for addressing the compressed memory. The compressed memory controller chip performs real to physical address translation. Standard operating systems, for example Windows NT and Linux, run on the new architecture with no changes for the most part. However, a boundary condition exists where compressed memory may be exhausted due 1
To appear in the Memory Wall Workshop to be held in conjunction with the 27th Ann. Int. Sym. On Computer Architecture (ISCA’2000) Vancouver, B.C., June 11, 2000.
to incompressible contents. This boundary condition must be taken care of for operating system reliability and full utilization of the compressed memory. In standard operating systems, the memory is described by a fixed number of page frames, which are managed by the virtual memory manager (VMM) of the OS. With compression support, the real memory and thus the number of page frames that can be actively maintained in the compressed memory depends on the compression ratio of the contents. Let PM be the physical memory and RM the real memory of the system. Let CR(t) be the compression ratio at time t, thus the maximum real memory that can be supported at a given time t is RM(t)=CR(t)*PM. This means that at high compression ratios the OS can hand out more pages than at low compression ratios. Independent of the OS, an applications data compression ratio changes dynamically, thus changing the physical memory utilization. When physical memory is exhausted, the OS can take actions that as a side effect either increase the CR(t) or reduce RM(t) to alleviate the physical memory pressure, Thus, operating system changes are required to actively manage the number of page frames that can be sustained at any given time. Our prototype uses both mechanisms, namely forcing additional page-outs thus reducing RM(t) and zeroing unused pages thus increasing the CR(t). In this paper, we describe the operating system mechanisms needed for making the Linux 2.x kernels compression-aware. As we show only minor modifications to the VMM of the Linux kernel are necessary. These mechanisms have been implemented and their efficiency in controlling the physical memory utilization has been demonstrated using several applications. In related work [3,4], the authors describe a method of estimating the number of page frames as a function of physical memory utilization. They further model the residency of outstanding I/O as they transfer data into the memory through the L3 cache, thus potentially forcing cache write backs that could increase the physical memory utilization. Using a time decay model they evaluate the system behavior using simulation. In contrast, our work focuses on a real implementation and ignores the I/O implications as a first approximation. In [5], an approach is described where a page-based hardware data compression engine sets aside a part of physical memory as a compressed paging space. In [6], a software solution is simulated that sets aside a part of the physical memory as a compressed paging space. In both cases, if the compressed paging space is filled up, compressed pages are swapped out, thus reducing the I/O overhead incurred. In the following Section 2 we give an overview of the compressed memory system architecture. In Section 3 we describe the memory compression support we added to the Linux operating system. In Section 4, we present experimental results of running applications on the compressed memory system.
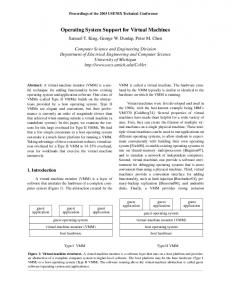
2. Compression Hardware Overview The organization of the expanded/compressed main memory system is shown in Figure 1. The main memory (SDRAM) contains compressed data and can be up to 16 GB in size. The L3 cache is a shared, 32 MB, 4-way set associative write-back cache with 1 KB line size. The L3 cache is made of double data rate (DDR) SDRAM. The L3 cache contains uncompressed data. It hides the latency of accessing the compressed main memory. The
2
To appear in the Memory Wall Workshop to be held in conjunction with the 27th Ann. Int. Sym. On Computer Architecture (ISCA’2000) Vancouver, B.C., June 11, 2000.
L3 Cache/Compressed Memory Controller is central to the operation of the compressed main memory hardware. The L3 cache appears as main memory to the upper layers of the memory hierarchy and its operation is transparent to the rest of the hardware including I/O. The controller compresses 1 KB cache lines before writing them to the compressed memory and decompresses them in to 1KB cache lines before reading from the compressed memory. The compression algorithm is a parallelized variation of the Lempel-Ziv algorithm known as LZ1. The compression scheme stores compressed cache lines to the compressed memory in a variable length format. The unit of storage in main memory is a 256 byte "sector". Depending on its compressibility, a 1 KB cache line may occupy 0 to 4 sectors in the compressed memory. Due to the variable length format, the controller translates real addresses to physical addresses. A 1KB cache line (real) address is remapped to 0 to 4 sector (physical) addresses in the compressed memory. The real address is the conventional address seen on the processor chip's external bus. The physical address is used for addressing the sectors in the compressed memory. The memory controller performs real to physical address translation by a lookup in the Compression Translation Table (CTT), which is kept at a reserved location in the
P6
P6
P6
P6 Bus 133 MHz
L3 Cache 32 MB
P6
real addr
L3 Cache and Compressed Memory Controller
I/O Bridge I/O Bridge
physical addr
Compressed Main Memory 16 GB Max SDRAM
Figure 1. Compressed Memory System Organization
memory. Each 1KB cache line address maps to one entry in the CTT and each CTT entry is 16 bytes long. A CTT entry contains control flags and four physical address pointers each pointing to a 256-byte sector. For example, a 1KB cache line, which compresses by 2:1, will occupy two sectors in the compressed memory (512B) and the CTT entry will contain two address pointers pointing to those sectors. The remaining two pointers will
3
To appear in the Memory Wall Workshop to be held in conjunction with the 27th Ann. Int. Sym. On Computer Architecture (ISCA’2000) Vancouver, B.C., June 11, 2000.
be NULL. For cache lines that compress to less than 120 bits, for example for a cache line full of zeros, a special CTT format exists. In that case, the compressed data is stored entirely in the CTT entry replacing the four address pointers. Therefore, in those special cases, a 1 KB cache line will occupy only 16 bytes in the compressed memory resulting in a compression ratio of 64:1. Note that the compression operations described so far are entirely done in hardware with no software intervention. The selection of 1KB line size was influenced by many factors. Directory size, which grows inversely proportional to the cache line size for a given cache size, and the compression block size that effects compression efficiency were the two most significant factors for the 1KB line size [8]. Shorter lines may not compress well and longer lines may impact performance due to longer compress/decompress times. A set of instrumentation registers exists in the memory controller to control and monitor the compression status of the system. For the purposes of this paper, the most interesting ones are the SUR and SUTxR registers. The Sectors Used Register (SUR) reports to the operating system the compressed memory usage. The Sectors Used Threshold Registers (SUTHR, SUTLR) can be used to interrupt the processors to warn for out-of-memory conditions. The SUTLR register is gated to the PCI interrupt line INTA and the SUTHR register is gated to the NMI interrupt. When compressed memory usage exceeds the SUTLR register threshold (for example 90%) a processor may be interrupted which can take action to prevent memory exhaustion.
3. Compression Support Under Linux Since the concept of compressed main memory is relatively new, common operating systems such as Linux or Windows NT do not have mechanisms to distinguish between real and physical memory nor do they deal with out-of-physical-memory conditions. Fortunately, minor changes in the VMM of the OS kernel are sufficient to make the OS “compression-aware.” In this section, we describe the operating system mechanisms needed for making the Linux 2.x kernels compression-aware. While the same objective can be accomplished outside the kernel, for example in a device driver, the implementation is easier inside the kernel, since device drivers do not have access to every kernel routine or data structure. Compressed memory hardware allows an operating system to use a larger amount of real memory than physically exists. During the boot process, the hardware BIOS reports more real memory than physical memory. For example, the particular system we used for software development has 512MB of (SDRAM) physical memory, although BIOS reports having 1 GB of memory. At this stage we need to introduce and make the distinction between the concepts of “static compression ratio” and “dynamic compression ratio”. Static compression ratio is fixed in the BIOS setup. It is the ratio of real memory size BIOS reports to the operating system to physical memory size, i.e. the actual amount of memory in the system. Static compression ratio is fixed at 2.0 in the current BIOS, because measurements show that 2:1 compression ratio is typical for a large number of applications. Dynamic compression ratio is a function of time and depends on the
4
To appear in the Memory Wall Workshop to be held in conjunction with the 27th Ann. Int. Sym. On Computer Architecture (ISCA’2000) Vancouver, B.C., June 11, 2000.
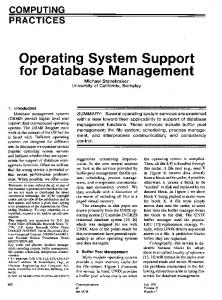
application. For example, during initial phases of execution, an application will have most of its allocated memory filled with zeroes and therefore it may exhibit a compression ratio of as high as 64:1. As execution progresses, the compression ratio will change depending on the memory contents. Theoretically, it is possible to provide a static compression ratio of up to 64:1, but this implies that the OS must support 64 times the physical memory in terms of page frames. Since page frame data structures are typically pinned this would require a significant tie-up of memory resource to represent such large number of page frames for an unlikely scenario. Linux and Windows NT run without any changes in the expanded memory, as long as the compressed physical memory is not exhausted. The OS is shielded from peculiarities of addressing the physical memory. However, to take full advantage of the memory compression capability, the physical memory exhaustion problem has to be dealt with. The OS must be ready to reduce the physical memory utilization when it is near exhaustion by reducing the real memory usage, i.e. lowering the real memory utilization, Current (PM) vs Target (PT) Physical Utilization PT
100%
slope=1
physical memory to reduce by Target
90% Objective Function
target utilization current utilization
85%
PM
85%
90%
100%
Figure 2 Memory Manager's Objective Function
or by increasing the dynamic compression ratio. The basic problem of running out of physical memory may be illustrated in the following example: A 1GB (1024MB) system may have only 600 MB allocated and therefore may appear to have 424 MB of free memory. However due to low compression ratio contents in the allocated memory, the physical memory usage may be near the 512 MB physical memory limit. Therefore, if the remaining 424 MB of “free memory” is allocated, or if compressibility of the
5
To appear in the Memory Wall Workshop to be held in conjunction with the 27th Ann. Int. Sym. On Computer Architecture (ISCA’2000) Vancouver, B.C., June 11, 2000.
allocated memory further decreases, then the system will run out of physical memory, even though it appears to the OS that free memory exists. Compression aware Linux kernel uses three primary mechanisms to control physical memory utilization. First, the low-memory watermark of the free page pool, which is a constant value in the conventional Linux kernel, is made a dynamically adjusted variable in the compression-aware kernel. When physical memory utilization exceeds the preset thresholds, the low-memory watermark is raised and the paging daemon is signaled to reclaim pages from the filesystem cache and processes. This action will eventually increase the number of free pool pages. Second, when physical memory utilization is above the preset thresholds, memory allocation is limited to prevent further exhaustion. As a result, VMM is forced to replenish pages in the free page pool. Third, reclaimed pages are zeroed before adding them to the free page pool. An L3 cache line filled with zeroes can be compressed to 1/64th of its original size as discussed in Section 2. Therefore, zeroing freed pages helps reduce the physical memory exhaustion. In the following we describe these mechanisms in more detail. In the Linux kernel free pages are maintained within the free_area by a buddy algorithm to ensure allocation of consecutive physical memory ranges. The interface to this is get_free_pages to allocate a power of two number of pages and free_pages to free a set of pages. On top of this page frame management, Linux provides a kmalloc interface for allocation of smaller chunks. It also provides an object SLAB allocator for its internal data structures [7]. The Linux kernel tries to maintain a minimum of 256 free pages (1MB) at all times for important kernel routines that should not fail during page allocation, such as interrupt service routines. This low-memory watermark is a constant value named freepages.min set at boot time. During page allocation, if the number of free pages in the system (nr_free_pages) falls below freepages.min, then the memory management routines are called in sequence to trim SLAB caches, shrink memory mapped files, get rid of shared memory pages, and finally swap out process pages to the swap disk until the number of free pages increases above the freepages.min threshold. A Linux paging daemon, called kswapd, also exists which accomplishes the same objective in a lazy manner. The kswapd process wakes up once a second and tries to free up pages if nr_free_pages drop below freepages.high which has been set to 3 * freepages.min at boot time. In our compression-aware kernel, the freepages.min and freepages.high watermarks are not constants anymore but made dynamically adjusted variables. In our prototype implementation, we check the physical memory utilization by polling the SUR register every 10 milliseconds during the OS clock interrupts and recalculate new watermark values if needed. We used polling instead of interrupts, because at the time of implementation interrupts were not working reliably. Polling adds negligible overhead to the CPU utilization. When physical memory utilization is below 0.85, the watermarks are kept at their original boot time values. When utilization is between 0.85 and 1.00, watermarks are governed by the equation shown in Fig. 2. The solid line indicates how much more physical memory usage is allowed. At every clock tick watermarks are
6
To appear in the Memory Wall Workshop to be held in conjunction with the 27th Ann. Int. Sym. On Computer Architecture (ISCA’2000) Vancouver, B.C., June 11, 2000.
recalculated based on the equation represented by the solid line. The Current=Target line (slope=1.0) and the objective function (solid line) intersect at 0.90, which means that we don’t want physical memory utilization to exceed 0.90. When utilization is between 0.85 and 0.90, the difference between target utilization (PT) and current utilization (PM) represents the amount of physical memory available for allocation. If more memory is demanded, the Linux virtual memory manager must free up pages from elsewhere before handing them to the caller. (Note that physical utilization also increases by processes changing the memory contents.) When utilization is above 0.90, PT is smaller than PM. Therefore compression management routines must reduce physical memory utilization. This is accomplished by setting the free page pool watermarks freepages.min and freepages.high to a number greater than the number of free pages. Then, the kswapd daemon is signaled. Kswapd, by design, has to start freeing up pages until number of free pool pages increase above the watermark freepages.high. Watermarks are calculated using the following equations. Let UP be the number of used pages in real memory and FP be the number of free pages in real memory, where total number of real pages is T=UP+FP. Then, UP*PT/PM = MP gives the target real page usage. Then freepages.high is set to T-MP. From Fig. 2 it can be seen that if PM < 0.90, then PT > PM which results in freepages.high < FP. If PM > 0.90, then PT < PM which results in freepages.high > FP. Thus in the latter case number of free pages are fewer than the required minimum and kswapd must retrieve used pages and add them to the free page pool. Note that increasing the number of free pages in the system alone does not achieve the reduction in physical memory utilization, as freed pages keep their content upon freeing in the conventional Linux kernel. The conventional Linux kernel zeroes pages only at allocation time and only for non-kernel processes for security. In the compression-aware kernel, pages are cleared when they are freed; hence all the pages in the free page pool are zero-filled. Recall that zero-filled pages consume 1/64th memory of their original size. Zeroing pages coupled with the dynamic adjustment of the free page pool watermarks allow us to control physical memory utilization. An application may rapidly change contents of its memory and therefore may rapidly increase the physical memory utilization. In such cases, the compression management schemes described so far may not be quick enough to reduce or keep memory utilization below 0.90 as the reduction in memory utilization is partly governed by the speed of swap disk access, while the increase is governed by the speed of memory access. We use busy kernel threads to stall execution of such applications. Kernel processes, one per processor, are created at boot time. These processes are normally idle. If physical memory utilization increases above 0.92, the idle processes are signaled to begin busy spinning. This has the effect of stalling other processes in the system hence they cannot execute and increase physical memory utilization until it falls below 0.90. In summary, the compression management schemes described here serve to keep physical memory utilization below preset limits. Above those limits, the compressed memory system behaves the same as a conventional system with insufficient memory and therefore exhibits increased paging activity.
7
To appear in the Memory Wall Workshop to be held in conjunction with the 27th Ann. Int. Sym. On Computer Architecture (ISCA’2000) Vancouver, B.C., June 11, 2000.
1000000
A
600000
B 400000
200000
C D 0 0
50
100
150
200
250
300
350
400
300
350
400
300
350
400
Seconds
A real used B phys used C mem held D file cache 1200 1000 800 Pages
Kbytes
800000
600 400 200 0 0
50
100
150
200
250
Seconds page in
page out
100
10
1 0
50
100
150
200
250
compression ratio
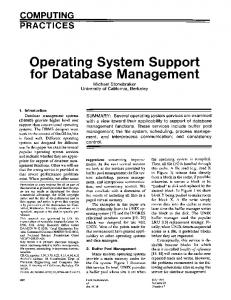
Figure 3(a)(b)(c). System Behavior for the fill.c benchmark
8
To appear in the Memory Wall Workshop to be held in conjunction with the 27th Ann. Int. Sym. On Computer Architecture (ISCA’2000) Vancouver, B.C., June 11, 2000.
4. Experimental Results In this section, we present experimental results that demonstrate the operation of the compressed memory system. In these experiments, our hardware had 512MB physical and 1 GB real memory, unless otherwise stated. The Compression Translation Table is placed by BIOS at the end of the physical memory and occupies about 8 MB space (16 bytes/cache line, 64 bytes/page). Therefore, 16 MB from the end of the 1GB memory is not available to the Linux kernel. The system is comprised of a single 450 MHz Xeon processor and a single IDE drive, which also contained the Linux swap partition. In the first experiment we use a test program for exercising the compression controls. The test program changes its memory contents to run compression ratio up and down rapidly. It misbehaves such that it attempts to cause physical memory exhaustion. Therefore, it is merely a test program and it does not represent a typical application. The second application is a logic simulation benchmark. Its compression ratio is quite stable throughout the execution and it fits well in to the real (and physical memory). Therefore, no compression controls are actively intervening during its execution, and this is typical for most applications.
4.1. Experiment 1: Fill.c The first application, called fill.c, is a simple C program that allocates 900 MB of memory and then rapidly changes the content of the allocated memory by writing mixture of zeros and random numbers. As stated earlier more zeros imply more compressibility. More random numbers imply less compressibility. The program makes several write and read passes over the allocated memory. Each write-read pass takes about 28 seconds if the application is in core. In each write pass, the ratio of zeros to random numbers is varied to change compressibility. Figs.3 (a), (b), (c) show the behavior of the compressed memory system/kernel while fill.c is running. Initially at time t=0 seconds (s), the system has 83 MB in use. The file cache uses 37 MB of that memory. In physical memory only 23 MB is in use resulting in a compression ratio of 3.6. At time t=8s, the program begins to allocate 900 MB of memory and completes its first write pass at t=25s. At that instant, 1005 MB of real memory and 262 MB of physical memory are in use, which include all the active processes in the system including the file cache. At t=38s, the program starts writing all zeros to its 900 MB of allocated memory, and at t=52s physical memory usage drops to 32 MB. The more interesting scenario begins at t=66s where the program starts writing a larger mix of random numbers to its memory. At time t=78s, the physical usage reaches 443 MB which is roughly 86% of physical memory usage and the compression controls kick in. The Figure shows an increase in the “memory held”, the amount by which the free page pool watermarks have been increased. The file cache also shrinks to make more real memory available. One second later at time t=79s, physical memory usage reaches 92%. Since the 0.90 threshold has been exceeded, the kswapd daemon starts paging out pages to reduce memory pressure as can be seen from Fig.3 (b). Consequently, a reduction in real memory usage is observed in Fig.3 (a). Each pass normally takes 28 seconds, however we can see from the graph that this particular pass starts at t=66 and ends at about t=270. Essentially, the system is “thrashing” during this period due to
9
To appear in the Memory Wall Workshop to be held in conjunction with the 27th Ann. Int. Sym. On Computer Architecture (ISCA’2000) Vancouver, B.C., June 11, 2000.
excessive paging as can be verified from Fig.3 (b). During this period, our data also shows that physical memory usage never exceeds 0.926. In summary, the compressionaware kernel accomplishes its objectives. It prevents the system from running out of physical memory. The system is “thrashing” at times due to excessive paging activity. However, this is a problem of this particular test program whose data does not compress well and which also attempts to exhaust the physical memory.
4.2. Experiment 2: Logic Simulation
800000
A 700000 600000
400000
B
300000 200000
C
100000
D 0 0
1000
2000
3000
4000
5000
6000
7000
8000
9000
10000
9000
10000
Seconds
A real memory B physical memory C file cache D file buffer
Real Mem/Phys Mem
KBytes
500000
4.0 3.5 3.0 2.5 2.0 1.5 1.0 0.5 0.0 0
1000
2000
3000
4000
5000
6000
7000
8000
Seconds compression ratio
Figure 4(a)(b). System behavior for the logic simulation benchmark The second experiment is a logic simulation application that was executed on the compression system by a customer of IBM. The application is a design automation tool simulating a very large semiconductor chip. The simulator and the input files used in this experiment are used by the customer as a benchmark for evaluating computer systems. The simulator comprises a shell script unzipping at the beginning a data file describing the simulated chip and a set of processes doing the actual simulation. As shown in Fig.4 10
To appear in the Memory Wall Workshop to be held in conjunction with the 27th Ann. Int. Sym. On Computer Architecture (ISCA’2000) Vancouver, B.C., June 11, 2000.
(a), (b) simulation begins at about t=2300 seconds and ends at about t=8250 seconds. The simulator reads large amount of data from disk as evidenced by an increase in the file cache from 40 MB to 160 MB. The system real memory usage is as high as 750 MB vs. physical memory usage of 310 MB. This results in a compression ratio of about 2.4 throughout the execution as seen in Fig.4 (b). Note that there is a small dip in the compression ratio at the beginning of the simulation in Fig.4 (b). We believe this is because the simulator reads and unzips a large compressed zip file describing the simulated chip. Compressed files cannot be further compressed in hardware therefore it results in a dip in the compression ratio. In Fig.4 (b) at the end of the simulation at about t=8250, the compression ratio drops from 2.4 to 1.5 (as well as a drop in the real and physical memory usage). We believe this is due to the large compressed zip file still resident in the filesystem cache. As stated in Section 3, the Linux kernel leaves memorymapped files in the file cache in anticipation of future read requests, barring any demand for the occupied memory. These read-only pages in the file cache will be discarded and without any paging in case memory demand cannot be met from the free page pool.
5. Compression Ratio of Applications and Performance Impact of Compression We analyzed several applications’ compression ratio to justify using the compressed memory hardware as well as proving its benefits. We used SPEC CPU2000 benchmarks (http://www.spec.org/osg/cpu2000/) as these benchmarks require large memory (at least 256 MB of RAM) and they were designed to measure the performance of the memory as well as processor and compiler of the tested system. We used the 12 integer benchmarks in the CINT2000 package. These are namely, GZIP data compression utility, VPR circuit placement and routing, GCC compiler, MCF minimum cost network flow solver, CRAFTY chess program, PARSER natural language processing, EON ray tracing, PERLBMK perl utility, GAP computational group theory, VORTEX object oriented database, BZIP2 data compression utility, and TWOLF place and route simulator. During execution of the benchmarks, physical and real memory usages were monitored using the instrumentation interface of the memory controller. Note that the measured memory usages are for the whole system. Therefore, in addition to the benchmark apps memory usage, these measurements include possibly large data structures such as file cache and buffer cache that the OS maintains for efficient use of the system. Dynamic compression ratio is a function of time and it typically changes during execution of an application. We sampled the dynamic compression ratio at 2 second intervals. In a post processing, step we took the average of the samples to produce the average compression ratio of a given benchmark. Figure 5 summarizes the average compression ratios of the benchmarks. In this set of 12 benchmarks, the smallest compression ratio of 1.78 was observed for PERLBMK and the largest compression ratio of 2.68 was observed for the VORTEX benchmark. The average compression ratio was 2.30 over all 12 benchmarks in the CINT2000 suite. Thus, the static compression ratio 2.0 used by the hardware is well justified for this set of applications. All benchmarks had a compression ratio better than 2.0 except for PERLBMK. It is not clear to us why PERLBMK has the lowest
11
To appear in the Memory Wall Workshop to be held in conjunction with the 27th Ann. Int. Sym. On Computer Architecture (ISCA’2000) Vancouver, B.C., June 11, 2000.
ratio; it may be because the benchmark uses a dataset that contains random numbers that do not compress well. Finally we measured the execution time of the benchmarks to see the impact of compression on the memory subsystem performance. We ran all 12 benchmarks twice with compression on and then with compression off. Measured execution times were then compared. Compression was turned off through the BIOS that disables compressor/decompressor portion of the L3 Cache/Compressed Memory Controller chip. In the compression-off case, the L3 cache is still operational. The main difference between on and off cases is that data is saved uncompressed to the physical memory in the off case. Note that due to the presence of the large 32 MB L3 cache that comprises a double data rate (DDR) SDRAM, the compressed memory system is expected to perform better than off-the shelf memory controllers regardless of the compression status. Figure 3.00
2.68 2.38
Real/Physical Memory Usage
2.50
2.00
2.30
1.78
1.50
1.00
0.50
0.00 MIN (PERLMBK)
MAX (VORTEX)
MEDIAN OF ALL 12
AVERAGE OF ALL 12
Figure 5. Average Compression Ratio of SPEC CINT2000 Benchmarks
6 summarizes the compression penalty for the 12 benchmarks. In the worst case, for the VORTEX benchmark compression-on case ran 3.1% slower than compression-off case. In the best case, for the PARSER benchmark, compression penalty was 0.7%. The average penalty over all 12 benchmarks was 1.5%, which is negligible considering that system memory size was effectively doubled due to compression.
12
To appear in the Memory Wall Workshop to be held in conjunction with the 27th Ann. Int. Sym. On Computer Architecture (ISCA’2000) Vancouver, B.C., June 11, 2000.
Execution Time Relative To Compression OFF Case
1.100 1.031
1.013
1.007
1.015
1.000
0.900
0.800
0.700
0.600 MIN (PARSER)
MAX (VORTEX) COMPRESSION ON
MEDIAN
AVERAGE
COMPRESSION OFF
Figure 6. Performance Impact of Compression on SPEC CINT2000 Benchmarks
6. Conclusion In this paper we have described and evaluated a computer system that supports hardware main memory compression. We described the operating system changes that are necessary to support main memory compression and implemented them in the Linux kernel. These include the management of the free_pages pool as a function of the physical memory utilization and the effective compression ratio, coupled with zeroing pages at free time rather than at allocation time. We showed the efficacy in controlling the physical memory utilization of these kernel changes on a set of applications. Our future work is to enhance the prototype with interrupt control and to address the problem of outstanding I/O request as described in [4].
Acknowledgements: We are grateful to Brett Tremaine and Mike Wazlowski for describing us the operation of the L3 Cache/Memory Compression Controller chip. The project has been managed by T. Basil Smith, Lorraine Herger and Chuck Schulz.
References: [1] Hovis et al., “Compression architecture for system memory application,” US Patent 5812817, 1998
13
To appear in the Memory Wall Workshop to be held in conjunction with the 27th Ann. Int. Sym. On Computer Architecture (ISCA’2000) Vancouver, B.C., June 11, 2000.
[2] Franaszek, P, Robinson, J., Thomas, J. “Parallel Compression with cooperative dictionary construction,” In Proc. DCC’96 Data Compression Conf., pp.200-209, IEEE 1996 [3] Franaszek, P., Robinson, J., “Design and Analysis of Internal Organizations For Compressed Random Access Memory,” IBM Research Report RC21146, Yorktown Heights, NY 10598. [4] Franaszek, P., Heidelberger, P., Wazlowski, M.: “On Management of Free Space in Compressed Memory Systems”, Proceedings of the ACM Sigmetrics, 1999. [5] Wilson, P, Kaplan, S., Smaragdakis, Y.: “The Case for Compressed Caching in Virtual Memory Systems”, USENIX Annual Technical Conference, 1999. [6] Kjelso, M, Gooch, M., Jones, S.: “Empirical Study of Memory Data: Characteristics and Compressibility,” In IEEE Proceedings of Comput. Digit. Tech, Vol 45, No. 1, pp 63-67, IEEE, 1998. [7] Vahalia, U: “Unix Internals, The New Frontiers”, Prentice Hall, ISBN 0-13101908-2, 1996 [8] Arramreddy, S., Har, D., Mak, K., Smith, T.B., Tremaine, B., Wazlowski, M.: “IBM X-Press Memory Compression Technology Debuts in a ServerWorks NorthBridge,” To appear at the HOT Chips 12 Symposium, Aug.13-15, 2000.
14