Enhancing the Quality and Trust of Citizen Science Data Abdulmonem Alabri The University of Queensland eResearch Lab, School of ITEE Brisbane QLD 4072, Australia +61 7 3365 4533
[email protected]
ABSTRACT The Internet, Web 2.0 and Social Networking technologies are enabling citizens to actively participate in scientific programs and allow them to access and use both their own data and the collective data generated by others. However, the limited training, knowledge and expertise of contributors can lead to poor quality, misleading or even malicious data being submitted. Subsequently, the scientific community perceive this data as low quality and not worthy of being applied in scientific research. In this paper, I discuss a technological framework that will integrate data quality and trust metrics to assess and enhance the reliability and trust of citizen science data. I will also discuss how trust models can provide a simple and effective mechanism for filtering unreliable data, and hence will improve the quality and reliability of the community -generated data enabling its confident re-use by the scientific community .
Categories and Subject Descriptors H.2.8 [Database Management]: Database Applications Scientific Database. H.5.3 [HCI]: Group and Organizational Interfaces Collaborative Computing, Web-based Interaction.
-
General Terms Algorithm, Experiment, Reliability, Theory
Keywords Citizen Science, Data Quality, Trust M etrics.
Permission to make digital or hard copies of all or part of this work for personal or classroom use is granted without fee provided that copies are not made or distributed for profit or commercial advantage and that copies bear this notice and the full citation on the first page. T o copy otherwise, or republish, to post on servers or to redistribute to lists, requires prior specific permission and/or a fee. Doctoral Consortium, Joint JCDL/ICADL International Digital Libraries Conference 2010, June 21, 2010, Surfers Paradise, Gold Coast, Australia.
1. INTRODUCTION Citizen science projects have grown dramatically in the recent years. They combine web-based social networks with community-based information systems to harness collective intelligence and apply it to a particular scientific problem. Online communities of volunteers are now contributing data to projects that range from astronomy [1] to bird watching [2] and air quality [3]. In particular, the issues of climate change and associated environmental impacts are mobilizing people who want to contribute to the monitoring, management and maintenance of ecosystem health by capturing observational data. Such projects are democratizing science in that they enable public citizens to actively participate in scientific programs, and allow them to access and use both their own data and the collective data generated by others. However, there are some inherent weaknesses to citizen science and crowd sourcing projects. The limited training, knowledge and expertise of contributors and their relative anonymity can lead to poor quality, misleading or even malicious data being submitted [4]. The absence of the “scientific method” [5] and the use of non-standardised and poorly designed methods of data collection [6] often lead to incomplete or inaccurate data. Also, the lack of commitment from volunteers in collecting field data [4, 7] can lead to gaps in the data across time and space. Subsequently, these issues have caused many in the scientific community to perceive citizen science data as low quality and not worthy of being considered in serious scientific research [8]. In this study I propose a technological framework that combines data quality metrics and trust metrics to provide a measure of the reliability of citizen science data and to enable it to be reused with confidence. This framework will provide mechanisms for improving and measuring the quality of citizen science data through both subjective and objective assessments of the data. It will also enable trust between individuals in an online citizen science community to be measured, inferred and aggregated to generate trust metrics for contributed data based on its provenance. In addition, the system will also provide querying, visualisation and reporting services for scientists that take into account the reliability of the data.
M ore generally, I also plan on identifying if there are particular disciplines or areas of research that are most suited to citizen science methodologies. Specific questions I will tackle include: what collaborative and communication technologies are optimum to encourage professional scientists, volunteers, amateurs and citizen scientists to work together for mutual benefit? What are the technical requirements for designing most effective citizen science Web services and systems? What can we learn from current successful exemplars? [9].
1.1 Hypothesis A large amount of research has been undertaken into approaches to improve data quality. However data cleansing and data quality improvement technologies can only go so far in improving the data. For example, fairly simple technologies can be applied to validate data input (e.g., syntax, format and values) for compliance against schemas. M ore complex data quality assessment may require comparison with data sets from alternative sources or comparison with historical trends. However these approaches are problematic if there are no other sources of comparable data or there is no longitudinal data for trend analysis. An alternative and complementary approach to data quality enhancement services is to exploit social network analysis tools to provide a measure of the trust of the data. A number of different trust models and trust metrics have been developed by researchers in the context of Web 2.0 – but to date, none have been applied to citizen science data. M y hypothesis is that trust and reputation metrics (such as those developed to provide recommender services in online social networks) can usefully be applied to citizen science data. I believe that trust models can provide a simple and effective mechanism for filtering unreliable data, and hence will improve the quality and reliability of the community -generated data enabling its confident re-use by the scientific community.
2. LITERATURE REVIEW This section provides a review of related citizen science projects and other technologies of relevance to my research. The key areas discussed here include the concept of citizen science and its significance; an overview of some exemplary citizen science projects, a review of data quality metrics; and the application of social trust algorithms to citizen science data.
2.1 Citizen Science The term “citizen scientist” refers to a volunteer who collects and/or processes data to contribute to scientific research. M embers of the scientific community are turning toward citizen scientists for the data they need to monitor ecosystems and protect species under threat of extinction [10]. Silvertown [6] highlights that there has recently been an increase in the participation of citizen scientists in a number of projects including climate change, ecological restoration and water quality monitoring. The success of research projects that require the
collection of data on a large temporal and geographical scale depends on engaging volunteers in the data collection process. Citizen science has led to the development of substantial knowledge regarding species population distributions, species behaviours and the impact of human activities and climate change on flora and fauna. It is also contributing to the development of conservation policies for endangered and threatened species. Delaney et. al. [8] suggest that the benefits of citizen participation is two-fold as it assists both the scientists and the public with regards to increased personnel involvement in data collection and education opportunities through hands-on learning experiences. Citizen science data is often essential for the testing of scientific hypotheses or for assessing and validating predictive models that involve large-scale spatial and temporal extents. The necessary longitudinal datasets are often incomplete and outdated due to resource limitations with regard to funding and personnel availability. Citizen science can play an important role in reducing costs associated with research projects and the development of more comprehensive data collection. Furthermore, citizen science programs often lead to increased public awareness of environmental and scientific challenges, civic involvement, fulfilment of academic requirements (in the case of students), and improvement in decision making skills [7].
2.2 Citizen Science Examples There have been a number of citizen science projects that have successfully attracted a large number of contributors and collected an enormous amount of data over the years. However, few have attempted to apply data quality and trust metrics to the data contributed by the volunteers. Two citizen science projects that have attracted the attention of communities around the world are the Internet Bird Collection and NatureM apping. I have selected these projects to review in detail because they have both employed some successful techniques to enhance the quality of citizen science data in their domain. The Internet Bird Collection (IBC)1 [11] is a non-profit project with the key goal of providing information about the world's avifauna. It is an on-line audiovisual library of the world's birds that is available to the general public free of charge. The IBC website has implemented a number of techniques to encourage citizens to provide high quality material for their observations. These include assigning a trust rating to material uploaded by other members of the website; a point system where members of the website are rewarded points when they contribute a video, photograph or sound recording that will be the first for a species; community collaboration, the IBC relies on assistance from expert members of the website to correct the species
1
http://ibc.lynxeds.com
identification if a member provides wrong or inaccurate species identification [11]. The second citizen science project I have assessed is the NatureM apping Foundation project 2 [12]. It is an American organisation based in Washington State which aims to create a state and national public biodiversity database that is available to the public. It engages informal science education organisations to provide training and support to citizens and scientists working together on local research projects. The NatureM apping project educates citizens about how to apply their research data for local conservation efforts [12]. The NatureM apping program focuses more on the validation and integrity of the data than on providing trust measures between the participating members. The observational data submitted to the NatureM apping Program goes through several steps of scientific analysis to ensure the accuracy and integrity of the data. These include:
All incoming data is overlaid onto geological survey Gap Analysis Program (GAP) range maps. GAP analysis is used to identify significant plant and animal species, habitats, or important ecological features and where they occur [12]. If a data point falls within the map, it is accepted. If a data point falls outside of the expected range distribution map, NatureM apping staff contact the individual who submitted the record to collect additional information. In the case of a rare, threatened or endangered species, the data record is always subjected to a fine scale review and NatureM apping staff contact the individual who submitted the record. If a sighting has been tagged in the database as “unsure of the species” it will not be mapped. Instead the recording will be held in a separate file until it is verified. Additionally, if a sighting has been incorrectly tagged as “sure of the species” it will not be mapped until an investigation has been completed. NatureM apping Foundation provides educational modules, logistic support and workshops to train members of the community on collecting data and using their tool kits. For example, teachers attend a series of NatureM apping workshops before starting a project. The teachers then implement the project at their school and work with the students to collect data about nearby species. The data collected is then sent to the NatureM apping program for analysis [13]. The NatureM apping program grants ID numbers to members after registration. M embers are required to record their ID numbers before submitting data. This allows the NatureM apping administrators to contact the member if further information is required.
2
http://naturemappingfoundation.org
2.3 Data Quality According to Wand et. al. [14] data quality is a multidimensional measure of accuracy, completeness, consistency and timeliness. These dimensions can be used to specify whether data is of a high quality by measuring specific deficiency in the mapping of the data from the real-world system state to the information system state. Such dimensions can be used to develop data quality audit guidelines and procedures for improving the data quality; to guide the data collection process in the field and to compare the outcomes of different studies. Currently, most organisations develop data quality measures on an ad hoc basis to solve specific data quality issues where practical and usable data quality metrics are lacking [15]. In many cases these data quality measures are applied as a one-off static process either before or as the data enters the database. This is also apparent in citizen science projects where data quality measures are generally performed during the submission process only. Lee et. al. [16] proposed that the application of data quality metrics must be viewed as dynamic, continuous and embedded in an overall data quality improvement process as part of a data collection system.
Figure 1: TDQM Cycle. The M IT‟s Total Data Quality M anagement (TDQM ) research program has employed the TDQM cycle [15] to link quality to continuous improvement process. The TDQM cycle consists of continuous cycle of defining, measuring, analysing and improving data quality (Figure 1). Pipino et. al. [17] believe that it is necessary to consider both subjective and objective data quality dimensions. The subjective data quality assessments are based on the perception of individuals involved with the data. For example, if the stakeholders assess quality of data as poor then their behaviour will be influenced by this assessment. The objective dimensions assess the state of the data based on a set of regulations, rules and constraints. Similarly, if stakeholders of citizen science data perceive the data as poor quality data then their decision to use this data will be influenced by this assessment.
To achieve data quality improvement in citizen science context, it is necessary to identify the criteria for high quality data. These may include: accuracy, believability, relevance, timeliness, reputability, appropriate amount, completeness, interpretability, accessibility and understandability [18]. In the second step of the TDQM cycle, data quality metrics are developed based on the data quality criteria identified in the first step. For example, in the completeness dimension, the extent to which data is complete is measured as a percentage. This measured value is used to implement improvement activities in the third step. The third step involves analysis and interpretation of the measures and a decision on whether and how to improve the quality of data. For example, having a high percentage of values of incorrect data type will trigger investigations into mechanisms for checking the value and format of the input data. The fourth step is to improve data quality by changing the data values directly and changing the process by which the data is collected, generated or submitted. For example, notifying users at time of input that their data is incorrect and the reason why. The TDQM cycle repeats as improvement activities produce metrics for data quality. A decision can then be made whether the quality dimension is appropriate or a new data quality dimension needs to be introduced.
2.4 Social Trust
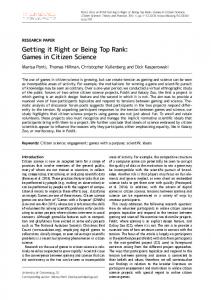
Advogato website3. This trust metric aims to accept as many valid accounts as possible in an online community and also reduce the impact of bogus ones. The Advogato website serves as a community discussion board for free software developers. Each user on the site has a single trust rating calculated from the perspective of designated seeds (authoritative accounts). Trust calculations are made using a network flow model. This trust metric composes certifications between members to determine the trust level of a person, and thus their membership within a group. Users can be certified at three levels: apprentice, journeyer, and master [21]. The core of this trust metric is a network flow operation. This mean if there is a rich web of interconnections, the flow should reach all the nodes of the network. In a social network, each account is a node and each connection between two accounts is a certification level. A breath-first searching algorithm is used to calculate capacity value for each node in the network. This is done by computing the shortest distance from a seed to each node. The diagram (Figure 2) shows an example of how Attack Resistance trust metric works. The comp romised nodes are valid account within the social network but have given certification to bad nodes (bogus accounts). The good nodes have only certifications to other good nodes and some compromised nodes.
A considerable amount of research has been recently conducted on trust, reputation and ranking systems with the primary focus on the content of social networking sites and social tagging sites [19]. There has been little or no previous research undertaken into using these in improving the quality and reliability of citizen science data. A number of researchers have presented different approaches for measuring trust in social networks. Golbeck [19] have used Recommender System to calculate trust based on user profile similarity. A collaborative filtering algorithm is used to create a predictive movie rating for a user that will best match the user‟s opinion. If the user does not have a direct trust value for a person who rated a particular movie, the system will move one step out in the trust network to find connections to users that rated the movie. The process is repeated then a predictive trust value is calculated between user i and user s according to equation 1. Where t ij is the trust between user i and user j and t js is the trust between user j and user s.
(1)
Figure 2: Example of Attach Resistance trust metric. The supersink is added to serve as a single sink for the network flow algorithm. The maximum network flow is then calculated using Ford-Fulkerson algorithm [21]. The number of bad nodes chosen by this metric over each compromised node “x” is computed by (C x – 1), Where Cx is the capacity of node x. The flow from a compromised node x to bad nodes cannot exceed (Cx – 1) as the total flow into x is bounded by Cx. A cut is made through all the edges from the good and compromised nodes to the supersink and from all the compromised nodes to the bad nodes where the total flow of this cut is equal to the number of bad nodes chosen.
M assa et. al. [20] have described Attack Resistance trust metric model developed by Raph Levin to calculate trust metrics in the 3
http://advogato.org
3. OBJECTIVES The primary objective of this thesis is to develop a technological framework for improving the quality and measuring the trust and reliability of citizen science data so it can be confidently re-used by scientists. M ore specifically the aims are:
To identify a set of criteria for measuring data quality in citizen science projects To develop a set of services for improving data quality in citizen science projects To evaluate, analyse, refine and optimize these data quality enhancement services – in the context of two exemplary citizen science projects To identify a set of criteria or attributes for measuring trust of citizen science data. For example these might include: o The contributor‟s role and qualifications (primary student, secondary student, PhD student, volunteer, council worker, scientist); o The quality and amount of past data that they have contributed; o The extent of training programs that they have completed; o Frequency and period of contributing; o The contributor‟s ranking from other members (direct, inferred or calculated using social trust algorithms) To survey alternative trust models and algorithms for measuring trust and identify those approaches most applicable to citizen science projects To develop tools for capturing the trust-related attributes and for calculating trust within citizen science projects (e.g., the optimum weightings that should be applied to the criteria listed above to determine the most accurate measure of the data‟s trust) To evaluate, analyse, refine and optimize these trust measurement algorithms, tools and services – in the context of two exemplary citizen science projects To understand the interactions between data quality and trust metrics – and determine the optimum combination of services for improving the reliability of citizen science data To measure the improvements in data quality that result from using trust metrics to filter or remove untrusted data or untrusted contributors To investigate and identify optimum mechanisms for displaying or communicating the trust, quality of data and reliability of contributors, to other members of the community, especially scientists who are considering using the community-generated data.
4. CASE STUDY This section provides an overview of the CoralWatch citizen science project and the preliminary implementations of its new system that I am developing. The Coral Watch project will be employed as a case study to evaluate the tools and services that comprise the overall technological framework.
CoralWatch is a citizen science project being managed by the University of Queensland that aims to “improve the extent of information on coral bleaching events and coral bleaching trends” Reid et. al. [22]. Currently, the CoralWatch project has over 1300 members from 80 countries around the world. Its members have collected over 29000 records as of M arch 2010. CoralWatch has a number of publications that aim to increase the awareness of coral bleaching effects including their latest book “Coral Reef and Climate Change: The guide for Education and Awareness”, CDs, presentations and other educational materials. CoralWatch provides simple colour charts (Figure 3) that can be used by anyone (scientists, tourists, divers, school children) to provide useful monitoring data on coral bleaching on a relatively large scale via an inexpensive, „user friendly‟ and non-invasive devices. The data collected through the CoralWatch program includes the coral species, coral colours, latitude and longitude of the location, reef name, water temperature, data and time and the activity in which the data is collected e.g. snorkeling, reef walking or fishing. As well as collecting monitoring data, the project aims to educate the public about coral bleaching and its overwhelming effect on coral reefs.
Figure 3: Use of Coral Health Chart in the field. A CoralWatch member will first register with the program through the CoralWatch website4. The member then can request a DIY Coral Health M onitoring Kit by submitting a kit request through the website to start recording observations. Each observation includes coral types and colour intensity of the coral. The user can use a colour chart to record the colour intensity of the coral specie observed. “The colour charts are based on the actual colours of bleached and healthy corals. Each colour square corresponds to a concentration of symbionts contained in the coral tissue. The concentration of symbionts is directly linked to the health of the coral” Reid et. al. [22]. All the user has to do is match the colour of the coral with one of the colours in the coral health monitoring chart while in field. The user then generates a survey online by recording the matching colour codes with coral type.
4
www.coralwatch.org
4.1 System Architecture The diagram in Figure 4 provides an overview of the system architecture of the revised CoralWatch web interface and database that I have developed in collaboration with the CoralWatch project managers. The system utilizes the PostgreSQL object-relational database management system for storing and processing CoralWatch data. PostegreSQL uses PL/R language extension that allows writing R statistical functions (e.g. performing statistical analysis of coral data to determine whether a bleaching event has occurred) through PostgreSQL functions and aggregate functions. PostGIS [23] offers useful geospatial operations such as high speed spatial queries, shape union and difference, geometry types such as points, polygons, multipolygons and geometry collections. The server component is built using mainly Java and Freemarker programming languages. The server will interface with third party systems and clients through the following; 1) Web browsers such as Firefox and Internet Explorer. 2) Smartphones. 3) Customised integration tools that will correlate the CoralWatch‟s data with other data repositories using ontology.
simultaneously. This provides a tracking mechanism of bleaching events and speed at which they are happening.
4.2 Implementation and Interface To date, I have completed the initial structure and data model of the CoralWatch web application. The website allows users to register and upload data. It also provides a simple data analysis tool to generate graphs based on the data submitted. I have also implemented a map interface that will provide visualization of the spatial and temporal aspects of the data. An authenticated user will be able to create a new survey by providing some metadata for the survey first. The metadata for a survey include the participant‟s details, the survey‟s location, time and date, the weather condition and water temperature. The users can use a small map widget to locate latitude and longitude of the survey‟s location. I will implement a validation process that will utilise metadata schemas and vocabularies to validate these data fields. Once the user creates a survey, the user is able to input observations of coral colours to the survey (Figure 5). Every time the user submits data for an observation, the data is instantaneously analysed on the server side. The charts generated from the data analysis show the colour distribution across the observed coral. The user can then detect whether there is a bleaching event happening in a particular reef by looking at the change in colour over time.
Figure 4: CoralWatch system architecture. Web browsers provide the main interface to the CoralWatch system - enabling users to upload their data, view surveys and reports, download data and interact with other users. A Smartphone interface will be developed for uploading data from the field. Utilising the smartphone cameras, GPS data, and date and time allows less chance for a citizen to upload incorrect data. The integration tools are a highly customised scripts and programs that are used to harvest data, images and files (e.g. IM OS satellite imagery data) from other repositories that provide similar observational data on coral. This data is then used as a benchmark “ground truth” for quality of the volunteers‟ data on CoralWatch. The system utilises Google M aps for the geospatial representation of coral bleaching surveys. The timemap framework allows the integration of spatial and temporal objects into a map (Google M ap) and a timeline (SIM ILE timeline)
Figure 5: S ubmitting data on CoralWatch web app. Once the data has been entered, the next step is to perform data quality and trust measures on it as described in next section. To date, I have developed user interfaces whereby members of the network assign trust rankings to other members or alternatively users can rank specific datasets. The community trust on a member is calculated by averaging the trust values of all members of the CoralWatch community on that member. The calculated community trust value is displayed as a 5 star rating in the user‟s profile (Figure 6) – visible only to the system administrator. These trust metrics are then associated with the data uploaded by that member.
framework (Figure 8) that will enable the objectives of this project to be achieved. These components will be implemented and tested using the CoralWatch citizen science project as a testbed.
Figure 6: User profile showing trust as 5 star rating. The screenshot in figure 7 shows the Home page of CoralWatch website. The main component of the Home page is the timemap view of the surveys. The coral bleaching surveys (represented by coloured markers on the map) are layered simultaneously on the map based on the location of the survey and layered on the timeline based on the date and time in which they were conducted. When the timeline is dragged horizontally to a specific date, the surveys that were conducted around that date are displayed on both the time line and the map. The user can click on the surveys (represented by markers) on both the timeline or on the map. This will bring up a balloon showing the survey metadata and data. The Home page also provides a sidebar to allow the user to search and interacts with the CoralWatch system. Users can also filter surveys based on the value of their rating (1-5 stars). The observations in Figure 7 are coloured according to trust metric.
Figure 8: Overview of the proposed framework.
5.1 Data Quality and Data Validation The first step involves the identification of both subjective and objective criteria and metrics of the quality of the citizen science data being considered. To do this, I will employ the TDQM cycle as described in section 2.3. This process includes: 1. Identifying the data quality dimensions 2. Performing data quality measures 3. Analysing the results from assessments and identifying discrepancies 4. Implementing tools that provide necessary actions to improve the quality of data To identify the data quality dimensions for a citizen science project, I will conduct questionnaires and interviews with the stakeholders of the data. Table 1 [24] shows some of the common data quality dimensions which are applicable to citizen science data. Table 1: Example of data quality dimensions.
Figure 7: User Interface of CoralWatch.
5. METHODOLOGY The aim of this project is to build an innovative technological framework that will improve the quality and provide a measure of the reliability of data captured by citizen scientists. In this section, I describe the different components of the proposed
There are three different forms for measuring the quality of data; the Simple Ratio, M in or M ax operations and Weighted Average. The “simple ratio” measures the ration of desired outcomes to the total outcomes e.g. completeness can be measured as the ratio of incomplete observations to the total number of submitted observations minus 1. The M in or M ax operation form is to handle dimensions that require multiple data quality variables. The Appropriate Amount of Data dimension is applicable to the M in operation form e.g. taking the minimum of two ratios: “data provided/data needed” and “data needed/data provided” used as metrics for this dimension. The Timeliness and Accessibility dimensions are more applicable to the M ax operation form. The Weighted Average form is used to measure data quality dimensions with many important variables e.g. believability. In the case of CoralWatch, the syntactic aspects of data quality are easy to measure – and in many cases easy to correct. They include problems with latitude and longitude ranges, spelling errors, invalid temperature, formatting errors. However, measuring the quality of the data with respect to ground truth may be very costly since it is difficult to identify or retrieve a ground truth for comparison. CoralWatch data can be correlated against and compared with related data collected by other agencies such as ReefCheck, NOAA satellite data and AIM S bleaching events data. These organisations collect data using other techniques such as sensors, satellite imagery and sea surface temperature to assess the health of coral reef. These data sets will provide a benchmark to perform the second and third step of the TDQM cycle. However, ontology is required to enable comparisons between the Coral Watch data collected by citizen scientists and existing data from these scientific agencies. To perform the fourth step of the TDQM cycle, I will implement a strict metadata and data validation process that will utilise controlled vocabularies and metadata (XM L) schemas. These will enable M embers to submit their data through a friendly user interface that performs form validation before the data is submitted. This will use controlled vocabularies and metadata schemas that will ensure the consistency and integrity of user input are adhered to. For example, country lists and reef names will be validated against the GPS data provided by the member. The input data will be continuously run through the TDQM cycle as more data is submitted and the citiz en science project progresses. If the data passes the TDQM assessment, it will be assigned a rating value or marked as verified data. If the data does not pass the TDQM assessment, it will be marked “unvalidated”. This approach also means that the metadat a schemas, controlled vocabularies and validation rules may need to be adapted over time.
5.2 Adding Social Trust Metrics To enhance the reliability and trust of citizen science data, I plan to develop a social trust metrics framework that combines both
assigning trust to members (member profiles) as well as assigning ranking to the data they submit. I will implement and test different approaches for incorporating trust metrics. Here I present two trust metrics models: the Recommender System trust metric and Attack Resistance trust metric. In the Recommender System trust metric, trust will be assigned to member profiles by allowing other members to rate how much they trust other participants. Collaborative filtering algorithms described by Golbeck [25] will be used to calculate a predictive trust value between members. Golbeck [19] argues that social trust is dependent on many social and personal factors. Users would be required to log tremendous amounts of information in the system for the real value of social trust to be calculated. Therefore, web-based social trust must be focused and simplified. In the CoralWatch context a simple definition for trust by Golbeck [19] is employed “Trust in a person is a commitment to an action based on a belief that the future actions of that person will lead to a good outcome”. Since trust is not a binary value, users and surveys are given a trust value with a range (e.g. 1 to 5 stars). Users can have friends, colleagues or family members listed in their friend list. Each user is asked to assign a trust rating to each friend to indicate how much they trust that friend about the data they collect. However, the users will be unaware of the trust value that has been assigned to them by other members. This information will be kept hidden from members of the social network but used to personalize search results based on individual and inferred trust rankings. In the FilmTrust website [25], a collaborative filtering algorithm is used to generate a recommended movie rating for a user for a particular movie. In the CoralWatch website this is used to generate a value that predicts trust between users (Figure 6). If user Alice has a direct trust on user Bob, the system will show the trust value from Alice to Bob. Otherwise, the Recommender System searches for rankers that Alice knows and who have ranked Bob. If there are no direct connections from Alice to any rankers, the system moves one step up the trust network and finds a path from Alice‟s friends to the rankers of Bob. The process is repeated until a path is found. I also plan to examine the application and viability of Attack Resistance trust metrics [16] in the context of citizen science data. The Attack Resistance trust metric is designed to filter out bogus users from a social network thus reducing the submission of invalid or bogus data. A FOAF Role-based Access Control Standard [26] can be adopted to define the relationships between members in a citizen science project. The named relationships will be the basis for certification levels of this approach. A simple relationship model of a trust network is represented by Figure 9 with named edges.
Figure 9: Named Relationships Model of a social network Each edge between nodes will be assigned a certification level which will be used to calculate the capacities of accounts. Periodic execution of this trust metric will be remove any bad nodes (uncertified accounts) within the network. This will ensure that only certified and genuine volunteers remain in the system.
5.3 Querying, Visualization and Tagging Incorporating Data Quality Finally, I plan to exploit these trust metrics, by developing filtering, querying and presentation methods that either remove, weight or highlight data based on its quality. A range of spatiotemporal visualization tools will be used to display the data via a GIS visual display (e.g., Google Earth). Through this interface users will be able to perform spatio-temporal and keywordbased queries and analysis of the citizen science data. These tools will also utilize a timeline to allow the user to browse, query and animate geospatial observations (by particular volunteers or of specific data quality) over time. Animations will simulate the behavior and trends of observed environmental systems. Users will also be able to specify the level of trust required. For example: “Show me all coral watch observations for M asthead Reef between 2007 and 2009 with a ranking of 3 or more stars”. In the CoralWatch testbed, I will develop analysis and reporting tools that will produce “Coral Health Reports” which take into account the trust and reliability of the data. For example, users will be able to query a geographical region for the health of the coral using data that has 4 star rating or above – or generate a coral health report using all data. These tools will enable scientists to filter and compare results based on the quality of the citizen science data. I also plan to extend and evaluate the social bookmarking (folksonomy) tools specifically for tagging and annotating geolocated citizen science data. I will adopt a similar approach to Rezel et. al.‟s [27] that enables users to add tags to data/observations through a mapping interface. For example, users will be able to attach ranking tags and other annotations to data to highlight data quality issues.
5.4 Evaluation Following the implementation of my proposed framework, I will evaluate the approaches that I have developed. Specific criteria that will be assessed include:
Which tools/services work best for improving which data quality parameters (precision, completeness, consistency, and validity); The performance, efficiency and scalability of the data quality enhancement tools; The best algorithms, weightings and approaches for measuring trust attributes and for calculating overall trust in the context of citizen science projects; The performance, accuracy, efficiency and scalability of the trust metric tools; Improvements in data quality that result from using trust metrics to filter or remove untrusted data or untrusted contributors. The CoralWatch data will be compared with ground truth data - before and after quality imp rovement and trust metrics are applied. The most appropriate mechanisms from a user perspective for displaying or communicating trust and quality of data and contributors The ease of adaptability of the approaches and software services that are developed, to other Citizen Science projects/disciplines (e.g., Coastal Algal Bloom Registry). I will also establish a feedback facility on the CoralWatch citizen science project to collect user feedback on the effectiveness of this work. The number of contributing volunteers and the retention of volunteers will also be monitored. I also plan to conduct surveys and interviews with citizen science users (volunteers, government workers and scientists) to evaluate the benefits, disadvantages and usability of this work.
6. CONCLUSION This paper describes the key issues and challenges that are associated with improving data quality and measuring the trust or reliability of citizen science projects. Citizen science is democratizing science in that it enables public citizens and the scientific community to work together in monitoring, managing, maintaining and improving the environment around us. A literature review has revealed that there is a critical the need for a framework to improve the quality and trust of citizen science data – and that there are a range of existing technologies from the data quality field and social trust field, that can potentially be combined to maximize the quality and re-use of citizen science data. To date there has not been a significant amount of research done that examines the integration of data quality and trust metrics to enhance the quality of citizen science data. M y research will focus on employing these technologies and concepts to citizen science data to address the quality and trust issues with this data. The result of this study will be a technological framework that will improve the quality and reliability of data captured by citizen scientists through the novel integration of a range of information technologies.
7. REFERENCES [1] Lintott, C. J., Schawinski, K., Slosar, A., Land, K., Bamford, S., Thomas, D., Raddick, M . J., Nichol, R. C., Szalay, A., Andreescu, D., M urray, P. and Berg, J. v. d. Galaxy Zoo : M orphologies derived from visual inspection of galaxies from the Sloan Digital Sky Survey. Monthly Notices of the Royal Astronomical Society, 389, 3 2008), 1179-1189. [2] Cooper, C. B., Dickinson, J., Phillips, T. and Bonney, R. Citizen science as a tool for conservation in residential ecosystems. City, 2007. [3] (M ESSAGE), M . E. S. S. A. G. E. Project Overview. M obile Environmental Sensing System Across Grid Environments (M ESSAGE), City, 2010. [4] Foster-Smith, J. and Evans, S. M . The value of marine ecological data collected by volunteers. Biological Conservation, 113, 2 2003), 199-213. [5] Paulos, E. Designing for Doubt Citizen Science and the Challenge of Change. In Proceedings of the Engaging Data: First International Forum on the Application and Management of Personal Electronic Information (M IT, 2009), [insert City of Publication],[insert 2009 of Publication]. [6] Silvertown, J. A new dawn for citizen science. Trends in Ecology and Evolution, 24, 9 2009), 2832-2842. [7] Galloway, A. W. E., Tudor, M . T. and Haegen, W. M . V. The Reliability of Citizen Science: A Case Study of Oregon White Oak Stand Surveys. Wildlife Society Bulletin, 34, 5 2006), 1425-1429. [8] Delaney, D. G., Sperling, C. D., Adams, C. S. and Leung, B. M arine invasive species: validation of citizen science and implications for national monitoring networks Biological Invasions, 10, 1 2007), 117-128. [9] Lyon, L. Open science at web-scale: Optimising participation and predictive potential. Report, 2009. [10] Sutter, J. D. Backyard scientists use Web to catalog species, aid research. CNN, City, 2009. [11] IBC FAQ. The Internet Bird Collection, City, 2010. [12] NatureM apping Nature Mapping Data. NatureM apping Foundation, City, 2010.
[13] Baker, M . How to Start Counting Critters. The George Lucas Educational Foundation, City, 2005. [14] Wand, Y. and Wang, R. Y. Anchoring data quality dimensions in ontological foundations. Commun. ACM, 39, 11 1996), 86-95. [15] Huang, K.-T., Lee, Y. W. and Wang, R. Y. Quality information and knowledge. Prentice Hall PTR, 1999. [16] Lee, Y. W., Pipino, L., Strong, D. M . and Wang, R. Y. Process-Embedded Data Integrity. Journal Database Management, 15, 1 2004), 87-103. [17] Pipino, L. L., Lee, Y. W. and Wang, R. Y. Data quality assessment. Commun. ACM, 45, 4 2002), 211-218. [18] Wang, R. Y. and Strong, D. M . Beyond accuracy: what data quality means to data consumers. J. Manage. Inf. Syst., 12, 4 1996), 5-33. [19] Golbeck, J. Trust and nuanced profile similarity in online social networks. ACM Trans. Web, 3, 4 2009), 1-33. [20] M assa, P., Souren, K., Salvetti, M . and Tomasoni, D. Trustlet, Open Research on Trust M etrics. Scientific International Journal for Parallel and Distributed Computing, 9, 4 2008), 341–351. [21] Advogato.org Advogato's Trust Metric. Advogato.org, City, 2010. [22] Reid, C., M arshall, J., Logan, D. and Kleine, D. Coral Reefs and Climate Change: The guide for education and awareness. CoralWatch, Brisbane, 2009. [23] PostGIS “What is PostGIS? PostGIS Website, City, 2010. [24] Kahn, B. K., Strong, D. M . and Wang, R. Y. Information quality benchmarks: product and service performance. Commun. ACM, 45, 4 2002), 184-192. [25] Golbeck, J. A. Computing and applying trust in web-based social networks. University of M aryland at College Park, 2005. [26] Grzonkowski, S. and Kruk, S. D-FOAF: Role-based Access Control Standard. DERI International, City, 2007. [27] Rezel, R. and Liang, S. SWE-FE: Extending Folksonomies to the Sensor Web. In Proceedings of the International Symposium on Collaborative Technologies and Systems (CTS 2010) (Chicago, USA, 2010), [insert City of Publication],[insert 2010 of Publication].