Decoding of Temporal Intervals From Cortical Ensemble Activity Mikhail A. Lebedev, Joseph E. O'Doherty and Miguel A. L. Nicolelis
J Neurophysiol 99:166-186, 2008. First published 14 November 2007; doi:10.1152/jn.00734.2007 You might find this additional info useful... This article cites 111 articles, 37 of which can be accessed free at: http://jn.physiology.org/content/99/1/166.full.html#ref-list-1 This article has been cited by 10 other HighWire hosted articles, the first 5 are: Decoding 3D reach and grasp from hybrid signals in motor and premotor cortices: spikes, multiunit activity, and local field potentials Arjun K. Bansal, Wilson Truccolo, Carlos E. Vargas-Irwin and John P. Donoghue J Neurophysiol, March 1, 2012; 107 (5): 1337-1355. [Abstract] [Full Text] [PDF]
Cell Assembly Sequences Arising from Spike Threshold Adaptation Keep Track of Time in the Hippocampus Vladimir Itskov, Carina Curto, Eva Pastalkova and György Buzsáki J. Neurosci., February 23, 2011; 31 (8): 2828-2834. [Abstract] [Full Text] [PDF] A Neural Representation of Sequential States Within an Instructed Task Michael Campos, Boris Breznen and Richard A. Andersen J Neurophysiol, November , 2010; 104 (5): 2831-2849. [Abstract] [Full Text] [PDF] Response Competition in the Primary Motor Cortex: Corticospinal Excitability Reflects Response Replacement During Simple Decisions Thomas Michelet, Gary H. Duncan and Paul Cisek J Neurophysiol, July , 2010; 104 (1): 119-127. [Abstract] [Full Text] [PDF] Updated information and services including high resolution figures, can be found at: http://jn.physiology.org/content/99/1/166.full.html Additional material and information about Journal of Neurophysiology can be found at: http://www.the-aps.org/publications/jn
This infomation is current as of March 6, 2012.
Journal of Neurophysiology publishes original articles on the function of the nervous system. It is published 12 times a year (monthly) by the American Physiological Society, 9650 Rockville Pike, Bethesda MD 20814-3991. Copyright © 2008 by the American Physiological Society. ISSN: 0022-3077, ESSN: 1522-1598. Visit our website at http://www.the-aps.org/.
Downloaded from jn.physiology.org on March 6, 2012
Measuring time with different neural chronometers during a synchronization-continuation task Hugo Merchant, Wilbert Zarco, Oswaldo Pérez, Luis Prado and Ramón Bartolo PNAS, December 6, 2011; 108 (49): 19784-19789. [Abstract] [Full Text] [PDF]
J Neurophysiol 99: 166 –186, 2008. First published November 14, 2007; doi:10.1152/jn.00734.2007.
Decoding of Temporal Intervals From Cortical Ensemble Activity Mikhail A. Lebedev,1,4 Joseph E. O’Doherty,2 and Miguel A. L. Nicolelis1,2,3,4 1
Departments of Neurobiology, 2Biomedical Engineering, 3Psychological and Brain Sciences and 4Center for Neuroengineering, Duke University, Durham, North Carolina
Submitted 29 June 2007; accepted in final form 11 November 2007
Proper timing of actions is essential for the survival of living organisms (Buhusi and Meck 2005; Durstewitz 2004; Ivry 1996; Ivry and Spencer 2004; Meck and Malapani 2004). Disorders that affect the processing of time have been linked to neurological conditions such as aphasia and dyslexia (Kolk 1995; Merzenich et al. 1996; Stein and Walsh 1997), Parkinson’s disease (Elsinger et al. 2003; O’Boyle et al. 1996; Riesen and Schnider 2001), attention-deficit/hyperactivity disorder (Toplak and Tannock 2005), and schizophrenia (Penney et al. 2005). Furthermore, lesions of cortical areas in humans produce disturbances in the reproduction of time intervals that are specific to the site of cortical site damage (Halsband et al. 1993; Wittmann et al. 2001). The first demonstrations of brain activity reflecting selftiming of voluntary movements were done in the 1960s using EEG recordings (Deecke et al. 1976; Kornhuber and Deecke 1964, 1965; Shibasaki and Hallet 2006). It is currently believed that at least two systems supervise temporal processing in the
brain during motor behavior (Buhusi and Meck 2005). The first system works in the millisecond range and involves the cerebellum. The second system controls behavioral events on the seconds-to-minutes range. Experimental evidence indicates that this system is composed of highly distributed corticostriato-thalamic networks. Indeed, recent neuroimaging studies in human subjects confirm the involvement of such neural circuits in tasks that require temporal processing (Coull et al. 2004; Harrington et al. 2004; Hinton and Meck 2004; Meck and Malapani 2004; Rao et al. 2001). Animal experiments also point to a distributed cortico-striato-thalamic network for temporal processing. Lesions of parts of cortico-striato-thalamic circuit disrupt behavioral timing in rats (Meck 2005). Moreover, our recent neurophysiological study showed temporally specific modulations in ensembles of cortical and striatal neurons in behaving rats during self-timed lever presses (Matell et al. 2003). In further support of a distributed mode of time processing, temporally specific modulations related to reward anticipation have been shown in the rat posterior thalamus (Komura et al. 2001) and even in primary visual cortex (Shuler and Bear 2006). A wealth of data linking modulations in cortical, striatal, and thalamic neurons to behavioral timing has been obtained in awake, behaving monkeys. The behavioral tasks used in these studies incorporated delays during which the monkeys had to withhold movements of the arm or the eye while mentally timing movement onset or anticipating upcoming trigger stimuli that signaled that the movement could be started. These studies showed that many neurons in different cortical areas exhibit climbing activity during the task delays (Durstewitz 2004). The neurons with climbing activity nearly monotonically increase or decrease their activity, as would be expected of a biological clock. Neurons with this pattern of activity have been observed in prefrontal cortex (Brody et al. 2003; Fuster 2001; Genovesio et al. 2006; Goldman-Rakic 1995; Janssen and Shadlen 2005; Kim and Shadlen 1999; Kojima and GoldmanRakic 1982; Lebedev et al. 2004; Miller et al. 1996; Niki and Watanabe 1979; Quintana and Fuster 1992; Rainer et al. 1999; Sakurai et al. 2004; Vaadia et al. 1988), premotor cortex (Crammond and Kalaska 2000; Lebedev and Wise 2000; Lucchetti et al. 2005; Mauritz and Wise 1986; Romo and Schultz 1987; Weinrich and Wise 1982), primary motor cortex (Roux et al. 2003), posterior parietal cortex (Janssen and Shadlen 2005; Leon and Shadlen 2003), frontal eye field (Schall 2001), and striatum (Lee and Assad 2003; Schultz and Romo 1988; Schultz et al. 1997). Climbing activity may be related to various functions that require temporal control. It has been suggested that monotonic changes in neuronal activity during the task delays have a role
Address for reprint requests and other correspondence: M. A. Lebedev, PO Box 3209, Dept. of Neurobiology, Duke Univ. Medical Center, 101 Research Dr., Durham, NC 27100 (E-mail:
[email protected]).
The costs of publication of this article were defrayed in part by the payment of page charges. The article must therefore be hereby marked “advertisement” in accordance with 18 U.S.C. Section 1734 solely to indicate this fact.
INTRODUCTION
166
0022-3077/08 $8.00 Copyright © 2008 The American Physiological Society
www.jn.org
Downloaded from jn.physiology.org on March 6, 2012
Lebedev MA, O’Doherty JE, Nicolelis MA. Decoding of temporal intervals from cortical ensemble activity. J Neurophysiol 99: 166 –186, 2008. First published November 14, 2007; doi:10.1152/jn.00734.2007. Neurophysiological, neuroimaging, and lesion studies point to a highly distributed processing of temporal information by cortico-basal ganglia-thalamic networks. However, there are virtually no experimental data on the encoding of behavioral time by simultaneously recorded cortical ensembles. We predicted temporal intervals from the activity of hundreds of neurons recorded in motor and premotor cortex as rhesus monkeys performed self-timed hand movements. During the delay periods, when animals had to estimate temporal intervals and prepare hand movements, neuronal ensemble activity encoded both the time that elapsed from the previous hand movement and the time until the onset of the next. The neurons that were most informative of these temporal intervals increased or decreased their rates throughout the delay until reaching a threshold value, at which point a movement was initiated. Variability in the self-timed delays was explainable by the variability of neuronal rates, but not of the threshold. In addition to predicting temporal intervals, the same neuronal ensemble activity was informative for generating predictions that dissociated the delay periods of the task from the movement periods. Left hemispheric areas were the best source of predictions in one bilaterally implanted monkey overtrained to perform the task with the right hand. However, after that monkey learned to perform the task with the left hand, its left hemisphere continued and the right hemisphere started contributing to the prediction. We suggest that decoding of temporal intervals from bilaterally recorded cortical ensembles could improve the performance of neural prostheses for restoration of motor function.
TIME DECODING FROM CORTICAL ACTIVITY
METHODS
Electrode implants and neuronal recordings All surgical and experimental procedures conformed to the National Research Council’s Guide for the Care and Use of Laboratory Animals (1996) and were approved by the Duke University Animal Care and Use Committee. Two female rhesus macaques were implanted with multielectrode arrays in the arm representation of the primary motor (M1) and dorsal premotor (PMd) cortices. Each electrode array was composed of 32 electrodes (tungsten, 35 m diam) spaced in a square or circular area, 6 mm in diameter, with 1-mm separation between the adjacent electrodes. Electrode tips were cut obliquely at 45°, which made them sharp enough to penetrate the brain without the need for pia removal. The surgeries were conducted under gas anesthesia, in aseptic conditions. To gain access to the cortical areas of interest, craniotomies were made based on stereotaxic coordinates. Dura mater overlying the brain was removed, and the locations of cortical areas targeted for the implantation were determined by visual inspection of the exposed cortical sulci (central sulcus, arcuate sulcus, and superior precentral dimple). Multielectrode arrays were slowly (⬃30 min/ array) inserted in the cortex at the depth of 1.5–2 mm. During the insertion, we monitored the electrical activity of cortical cells recorded by the electrodes. Once the electrodes were inserted, the array J Neurophysiol • VOL
was glued to the skull with dental cement. Bone screws were inserted in the skull to assure the firm attachment of the implant. After all the arrays were implanted, the assembly of the implanted electrodes and bone screws was secured with dental cement. The location of cortical implants is shown in Fig. 1. One 32electrode array was implanted in the M1 of left hemisphere in monkey 1, and four 32-electrode arrays, one for each M1 and PMd, were implanted in monkey 2 (left and right hemispheres). Neuronal waveforms were sorted and recorded using a multichannel acquisition processor (Plexon, Dallas, TX). Although we often recorded from the same neurons for several weeks, the recorded neuronal set was generally variable from one recording session to another. Accordingly, we recorded different number of neurons on different days. We recorded on average from 94 ⫾ 6 (SD) neurons in the left M1 in monkey 1 and from 103 ⫾ 4, 87 ⫾ 8, 55 ⫾ 6, and 72 ⫾ 8 neurons, respectively, in the left M1, left PMd, right M1, and right PMd in monkey 2.
Behavioral task During each recording session, a monkey was seated in a primate chair, which was equipped with a touch button mounted at the animal’s waist level (Fig. 2A). The working arm was free, whereas the other arm was restrained with velcro bands. The monkeys started each trial by touching the button with the working hand. To correctly execute the self-timing task, the monkey had to maintain contact with the button for ⱖ2.5 s and ⱕ4.5 s and release the button. If the monkey fulfilled this requirement, it received a fruit juice reward immediately after the button release. Behavioral training in this self-timed task took ⬃1 mo for each monkey. During the training, it was initially required that the monkey hold the button for a short period (0.2– 0.5 s). Hold time was gradually increased as training progressed. No external stimuli other than reward delivery were used to inform the monkey that it could touch or release the button. For the final task with the hold requirement of 2.5– 4.5 s, we collected neuronal and behavioral data in 8 experimental sessions in monkey 1 and in 14 sessions in monkey 2, during which the monkeys performed the task with the right hand. Monkey 2 was also trained to perform the task with the left hand. It was initially trained to perform the task with the right hand. After the recordings were conducted in this task, a 2-wk break ensued, after which the recordings resumed. The recording sessions before and after this break were analyzed separately because the recording quality of the left PMd array abruptly deteriorated. Therefore for the after-break sessions, we analyzed the M1 recordings only. During the after-break sessions, monkey 2 continued to perform the task with the right hand for 5 days (used as a control), and then it was required to perform with the left hand. During these sessions, the left arm was released from the restraint, and the right arm was restrained instead. The monkey failed to perform any trials with the left hand for 2 days, and then it started to use the left hand. We recorded five sessions in which this monkey worked with the left hand. During four of these recording days, after the monkey had performed with the left arm, the right arm was released, the left arm restrained, and the monkey resumed the task with the right arm, while the same sample of cortical neurons were recorded. The duration of each recording session was 20 – 40 min. To measure the activity of the monkey’s arm muscles, surface EMGs were recorded from four to five muscles simultaneously: biceps, triceps, wrist flexor and extensor muscle groups, and pectoralis (Fig. 2B).
Predictions To test our hypothesis that temporal parameters of motor behavior—in particular those encoded before overt motor acts— can be
99 • JANUARY 2008 •
www.jn.org
Downloaded from jn.physiology.org on March 6, 2012
in motor preparation (Romo and Schultz 1987; Weinrich and Wise 1982), anticipation of instructing cues (Mauritz and Wise 1986), sensorimotor transformation (Crammond and Kalaska 1994), spatial attention (Lebedev and Wise 2001; Lebedev et al. 2004), working memory (Fuster 2001; Goldman-Rakic 1995; Miller et al. 1996), motor timing (Niki and Watanabe 1979), anticipation of reward (Roesch and Olson 2005; Schultz 2006), and decision making (Kim and Shadlen 1999; Schall 2001; Sugrue et al. 2005). Recent studies in which monkeys have been taught to discriminate durations of visual stimuli indicate that climbing activity reflects time perception in a context-dependent manner (Janssen and Shadlen 2005; Leon and Shadlen 2003; Roux et al. 2003; Sakurai et al. 2004). In addition, in reaction-time tasks, cortical neurons exhibit climbing activity patterns, as well, with higher rates and rate of rise leading to shorter reaction times (Dorris and Munoz 1998; Hanes and Schall 1996; Kubota and Hamada 1979; Riehle and Requin 1993; Roitman and Shadlen 2002). Recently, climbing activity was reported in the avian prefrontal cortex using an experimental paradigm in which pigeons performed either reaction-time or delayed-response movements (Kalenscher et al. 2006). The overall conclusion from these neurophysiological studies is that neuronal modulations correlated with behavioral timing are present in many brain areas of several animal species and that these modulations do not encode time as a single parameter but rather reflect many additional variables, such as the properties of sensory stimuli, motor variables, and behavioral context. Thus experimental evidence points to a widely distributed neuronal circuitry as the carrier of temporal computations in the brain, which raises the need that this circuitry be studied using neuronal ensemble recording methods. In this study, we conducted simultaneous multielectrode recordings from multiple cortical areas (Nicolelis et al. 2003) to test the hypothesis that predictions of motor timing can be extracted from the activity of large ensembles of cortical neurons recorded in motor and premotor cortex in rhesus monkeys.
167
168
M. A. LEBEDEV, J. E. O’DOHERTY, AND M.A.L. NICOLELIS
predicted from cortical ensemble activity, we implemented a multiple linear regression model (or Wiener filter; Haykin 2002) in the form
冘 0
T共t兲 ⫽ b ⫹
w()n(t ⫹ ) ⫹ (t)
⫽⫺0.5s
(1)
where n(t ⫹ ) is a vector of neuronal firing rates (1 rate measurement per neuron) at absolute time t (e.g., time measured from the beginning of the recording session) and time-lag (negative lags correspond to past events), T(t) is the estimated temporal interval (or, generally, any other behavioral parameter) at time t, w() is a vector of weights for each neuron at time-lag , b is the y-intercept, and (t) is the residual error. Five time-lags preceding time t spaced at 100 ms were used for predictions. This prediction algorithm is shown in Fig. 3. Two intervals were predicted: the interval that elapsed after the monkey pressed the button, T1(t), and the interval until the upcoming button release, T2(t). To predict these temporal variables, the linear model inspected the neuronal ensemble activity during 0.5 s (i.e., ⬍1/5 of the delay J Neurophysiol • VOL
duration) preceding the time of prediction, t, and computed the prediction as a weighted sum of the neuronal rates measured within that time window. The time window width was chosen empirically as a trade off between the desire to make the prediction instantaneous (i.e., derived from a short time window that characterizes current activity of the neurons) and the need to make it accurate, which required a reasonably sized sample. Shorter time windows produced less accurate, but qualitatively very similar, results. Following the Wiener filter algorithm (Haykin 2002), the time window was split into bins (or tap points), and, accordingly, firing rates were expressed as spike counts for these bins. The bins corresponded to five lags of Eq. 1. (Note that binning here refers to sampling of instantaneous rate and not to firing rate averaged across trials and represented as a histogram.) In Wiener filters, using several time points in the past improves the predictions by taking into account input history. Specifically in our case, predictions of temporal intervals were obtained based on the estimation of both firing rate and its derivative (i.e., slope). The later parameter was accounted for by the model that effectively compared
99 • JANUARY 2008 •
www.jn.org
Downloaded from jn.physiology.org on March 6, 2012
FIG. 1. Location of cortical implants in monkey 1 (top) and monkey 2 (bottom). The drawings represent a view from the top on the macaque cortex. Stereotaxic coordinates are indicated by the grid. Cortical landmarks such as the central and arcuate sulci were confirmed during the implantation surgery. Monkey 1 was implanted in the arm representation of the primary motor cortex (M1) in the left hemisphere. Monkey 2 was implanted in the arm representations of M1 and dorsal premotor cortex (PMd) in both hemispheres. Each cortical array consisted of 32 microwires spaced at 1 mm.
TIME DECODING FROM CORTICAL ACTIVITY
169
Climbing and descending activity
FIG. 2. Self-timing task and example records of neuronal activity and arm muscle EMGs. A: schematics of the timing task. The monkey pressed a touch button with its hand and maintained the press for ⱖ2.5 s and ⱕ4.5 s to receive a fruit juice reward. B: EMGs of 4 forearm muscles and discharge patterns of 4 representative neurons recorded during a behavioral trial (Figs. 4 and 5 show average activity of the same neurons and muscles, respectively).
different time points within the window and assigned weights of different signs to the rates measured at different lags, if such signal differentiation improved the fitting. The number of bins was selected empirically, and increasing or decreasing the number of bins did not change the results qualitatively. To test if binning the time window improved the predictions, we used a control in which the total spike counts within the window were used for predictions instead of five separate bins. This control model produced worse predictions than the model with binning (see RESULTS). In addition to T1(t) and T2(t), the algorithm of Eq. 1 was used to predict the state of button press as a binary variable that was equal to 1 when the monkey was pressing the button and equal to 0 when the monkey was not pressing (Fig. 3, bottom). Again, the prediction was derived from the 0.5-s window preceding the time of estimation. The prediction of button state allowed us to gate the predictions of T1(t) and T2(t), which were meaningless outside the hold period of the task. To analyze the predictions statistically, each neuronal dataset was divided into consecutive 5-min epochs, which were used for training the model [i.e., calculation of the weights w()] and predicting. The prediction epochs immediately followed the training epochs, and all available tandems of these two epochs were analyzed for each recording session. The same 5-min epoch was used for training in one calculation and for predicting in the other with the exception of the cases when that epoch started or terminated the record. Only the time points within the delay interval were used for training the model to J Neurophysiol • VOL
The neurons whose firing rate increased (Fig. 4, A–D) or decreased (Fig. 4, E and F) during the self-timed delay period of the task were of special significance for the predictions of temporal intervals. We termed the first type neurons with climbing activity and the second type neurons with descending activity. The neurons were classified as belonging to the first or second type using a linear regression analysis of firing rates (sampled using 50-ms binning) on the interval 2– 0.25 s before movement onset. The neurons with statistically significant modulations (P ⬍ 0.01, F-statistics for linear regression) were selected. The sign of the rate change determined whether the rate was climbing or descending and the slope magnitude (normalized by the SD of firing rate) characterized modulation strength. RESULTS
Neuronal modulations A single-trial record of the discharges of four representative neurons (Fig. 2B) shows that, during the self-timed delay period, motor cortical neurons modulated their rates before the EMG bursts associated with button release. Raster displays and perievent time histograms (PETHs) for the same neurons are shown in Fig. 4. Two neurons exhibited climbing patterns of firing rate (Fig. 4, A–D), one had a descending rate (Fig. 4, E and F), and one was modulated shortly before movement onset but not during the delay (Fig. 4, G and H). Note that the smooth modulations seen in the PETHs of Fig. 4 describe average activity patterns. The patterns of neuronal spikes in individual trials were much more irregular (Fig. 2; also see Okamoto et al. 2007). In the rasters of neuronal activity shown in Fig. 4, a “rubber band property” (Renoult et al. 2006) of neuronal modulations is noticeable during the delay period: the modulation pattern in the trial with long delays can be produced by “stretching” the short-delay pattern like a rubber band. In the rasters, the trials are sorted by delay duration, so the differences in modulations
99 • JANUARY 2008 •
www.jn.org
Downloaded from jn.physiology.org on March 6, 2012
predict T1(t) and T2(t). All time points were used to train the model to predict the state of button press. The models were trained and tested for prediction performance for different neuronal subsets. In the simplest case, the model was constructed for single neurons taken one at a time. In the other calculations, we considered neuronal subsets that were either randomly selected from the entire population or selected according to their individual performance ranks. To characterize the accuracy of fitting or predicting, we used correlation coefficient, R, for the correlation between the actual and predicted (or fitted) parameters. R was calculated for the record in question for actual and predicted values, for example actual and predicted values of T1 for a 5-min record task performance. This measure is most frequently used in the literature to characterize the performance of neural decoding algorithms. In addition to R, we calculated root mean square difference between the predicted and actual values, E. This measure was linearly related to R (E ⫽ 1.25 ⫺ 0.97R; E measured in seconds, r2 ⫽ 0.78, P ⬍ 0.001) and therefore gave very similar results. The numbers of neurons recorded in different cortical areas was unequal and variable from one recording session to the next. Therefore to use a neuronal population of the same size in the comparison of prediction accuracy across cortical areas and recording sessions, we randomly selected subpopulations of 20 neurons for each area and computed average R for these subpopulations. This method assured that equal numbers of neurons were compared per area and provided a sufficiently large number of statistical samples.
170
M. A. LEBEDEV, J. E. O’DOHERTY, AND M.A.L. NICOLELIS
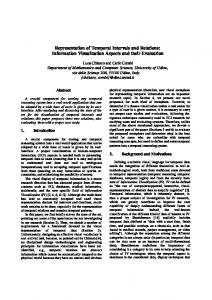
FIG. 3. Predicting temporal parameters from neuronal ensemble activity. Predictions were obtained from a 0.5-s time window that was subdivided into 5 bins. Spike counts from these bins provided inputs to several linear models. The 1st model predicted the time that elapsed from button press onset (T1). The 2nd model predicted the time until the upcoming button release (T2). The 3rd model predicted whether the button was pressed or released.
J Neurophysiol • VOL
were more numerous than the ones with descending activity in the areas contralateral to the working hand but not in the ipsilateral areas where they were encountered in comparable numbers. In left M1 of monkey 1, we recorded on average 39 ⫾ 12 neurons (mean ⫾ SD between daily recording sessions, 41%) with climbing activity and 10 ⫾ 4 (11%) neurons with descending activity. In monkey 2, we recorded the following number of climbing versus descending neurons: 59 ⫾ 11 (58%) versus 11 ⫾ 3 neurons (11%) in left M1, 30 ⫾ 10 (34%) versus 12 ⫾ 4 (14%) in left PMd, 6 ⫾ 4 (12%) versus 4 ⫾ 2 (6%) in right M1, and 6 ⫾ 4 (9%) versus 15 ⫾ 4 (21%) in right PMd. Color-coded PETHs for the whole populations of neurons recorded in different areas during a representative recording session are shown in Fig. 6, A–E. In these plots, to facilitate comparison between the neurons with different average rates, firing rates were normalized by subtracting the mean and dividing by SD (both calculated for the delay period). The neurons were ranked according to the slopes of their normalized rates: the neurons with strong climbing patterns are shown on the top of the plot, the neurons with descending patterns on the bottom, and those unmodulated during the delay in between (these subpopulations are marked with color-coded bars to the right of the plots). The plots indicate much stronger modulations in the areas contralateral to the working hand (Fig. 6, A–C) compared with the ipsilateral areas (Fig. 6, D and E) and the presence of rate modulations throughout the self-timed delay in the majority of the neurons. The plots clearly show that climbing or descending patterns occurred in a substantial portion of the recorded neurons. Generally, climbing patterns were characterized by
99 • JANUARY 2008 •
www.jn.org
Downloaded from jn.physiology.org on March 6, 2012
for short and long delays can be inspected visually. It can be seen that the modulations that occurred early in the delay line up with the button press onset, the modulations later in the delay line up with the button press offset, and the modulation in between do not show any clear preferred alignment. For example, the neuron depicted in Fig. 4, A and B, underwent a sharp transition from zero firing rate to the rate of ⬃17 spikes/s once the monkey pressed the button. This rate was maintained for ⬃1.5 s, and then it started to grow. Although the alignment of the modulations in the middle of the delay period is not clear from the plot, the intense modulation ⬃1 s before button release is clearly aligned on the release onset. In addition, the activity in this neuron abruptly shut down after the monkey released the button. Thus this neuron’s modulations were clearly aligned on the closest behavioral events (button press or release), and the modulations in between these events showed intermediate alignment as if they were placed on a rubber band. Climbing and descending patterns of neuronal activity, characterized by continuous modulations throughout the delay, were different from the modulations of EMG activity in the arm muscles, which primarily consisted of phasic bursts associated with hand movements that the monkeys produced to release the button and press it again (Fig. 5). These EMG bursts started at the earliest ⬃0.25 s before movement onset, continued while the monkeys’ hands were lifted from the button, and subsided ⬃0.5 ms after the monkeys pressed the button again. During the performance with the right hand (i.e., the sessions with the best quality neuronal recordings), neurons with climbing and descending activity constituted 56% of the population recorded in the left (contralateral) hemisphere and 24% of the ipsilateral population. Neurons with climbing activity
TIME DECODING FROM CORTICAL ACTIVITY
171
a steady rate increase from the beginning of the delay until the end, with the maximum rate reached shortly before movement onset. Movement-associated modulations in these neurons were variable. The firing of some climbing neurons sharply decreased when the monkey released the button (Fig. 4B), whereas the others remained active (individual traces in Fig. 6, A–C). Neurons with descending rates, which were less numerous in contralateral areas, monotonically decreased their rates until movement onset and often increased their rates during button release (Fig. 4F). Overall, ensemble activity recorded in multiple brain areas contained rich information about each fragment of the delay period. Delay-period modulations of the climbing and descending type in different cortical areas are further detailed in the average PETHs shown in Fig. 6, F–J. These plots confirm that both climbing and descending modulations were the strongest in the contralateral M1, less strong in the contralateral PMd, and weakest in the ipsilateral areas. J Neurophysiol • VOL
Neuronal correlate of the variability in self-timed delays Variability in neuronal rates has been linked to the variability in the temporal parameters of behavioral performance (Hanes and Schall 1996; Renoult et al. 2006; Roitman and Shadlen 2002). The self-timed delays studied here exhibited considerable variability from trial to trial, which gave us data to examine the neuronal substrate of such variability. To evaluate neuronal activity for different delays, we grouped the delay durations into four ranges: 2–2.5, 2.5–3, 3–3.5, and 3.5–5 s (Fig. 7, A and B). Some of these trials (i.e., the ones with the delays ⬍2.5 or ⬎4.5 s) were not rewarded, which, however, did not influence this analysis because the monkeys did not have an advance knowledge of the reward. Population PETHs (all recording sessions combined) were calculated separately for each range of delays, separately for each cortical areas (Fig. 7, C–H). These average PETHs indicated clear differences in activity of both climbing (Fig. 7, C, E, and G) and descending (Fig. 7, D, F, and H) neurons for different
99 • JANUARY 2008 •
www.jn.org
Downloaded from jn.physiology.org on March 6, 2012
FIG. 4. Perievent time histograms (PETHs) and spike rasters for the same 4 M1 neurons that are shown in Fig. 2. A, C, E, and G correspond to the alignment of behavioral trials on button press onset. Trials are sorted by the duration of button press. Open circles in the rasters mark the time of button release. (To avoid cluttering, every 3rd trial is marked.) B, D, F, and H represent the same trials aligned on button release. Trials are sorted the same way as in the panels on the left, and open circles indicate the time of button press onset. Two neurons increased their firing rates during the delay period (A–D), and 1 decreased its rate (E and F). These neurons were also modulated shortly before and after the monkey released the button. The 4th neuron was modulated mostly in association with button release (G and H).
172
M. A. LEBEDEV, J. E. O’DOHERTY, AND M.A.L. NICOLELIS
FIG. 5. Average rectified EMGs in 2 monkeys from a representative recording session. The EMGs were recorded from several arm muscles (see labels on the plots) using surface electrodes. The traces represent averages of full-wave rectified EMGs centered on button press (left in each panel) and release (right).
J Neurophysiol • VOL
vidual neurons was well correlated with movement initiation time. This was shown using the analysis of Maimon and Assad (2006), in which the time of threshold crossing was plotted against the time of movement initiation measured from button press onset (Fig. 8, B–G, left panels; movement initiation time is matched to the time of threshold crossing by subtracting 375 ms). When the time of threshold crossing was regressed against the time of movement initiation for individual cells, the distribution of regression slopes was centered on 1.0 (Fig. 8, F and G, right panels). Regression slopes less than 1.0 were related to statistical variations in threshold crossing times in the neurons with less noticeably changing firing rates (data not shown) and did not represent a special class of neurons as in Maimon and Assad (2006). Notably, average firing rate traces for the movement period were virtually identical for the trials with different delay durations (Fig. 7; interval ⫺0.25 to 0.25 s relative to button release). This suggests that the variations in neuronal slopes during self-timing and motor preparation were not translated into the modulations associated with motor execution. Thus the relationship between the firing patterns of the climbing and descending neurons and the duration of selftimed delays could be described as gradual increases or decreases in neuronal rates until they reach their movement initiation thresholds. If the firing rates changed slowly, the thresholds were crossed later, resulting in a late initiation of
99 • JANUARY 2008 •
www.jn.org
Downloaded from jn.physiology.org on March 6, 2012
self-timed delays. Long delays were associated with slowly developing changes in firing rates, whereas short delays were associated with rapid changes in firing rates (or steep slopes; also note some differences in average rates initially during the delay). Importantly, firing rates in both types of neurons reached approximately the same value by the time of movement initiation. We termed this value movement initiation threshold. The slopes were evaluated individually for each neuron using a linear regression for the interval 0.5–1.75 s relative to button press onset. (This interval preceded button release by ⱖ0.25 s even for the shortest delays.) Movement initiation threshold was quantified as an average firing rate for the interval 0.25– 0.5 s before button release. These intervals are shaded gray in Fig. 7, C–H, and the average values of these individual neuron slopes and the thresholds are displayed in the insets. ANOVA showed that the dependency of the slope on delay duration was statistically significant, whereas the thresholds were not statistically different for different delays. Average shifts of neuronal slopes with the delay duration were common for the majority of climbing and descending neurons. Thus the slopes were steeper for the 2- to 2.5-s delays compared with 3.5- to 5-s delays in 75% of climbing neurons and 71% of descending neurons, indicating that the neurons changed their slopes in a massively correlated manner. (Detailed analysis of neuronal correlations is beyond the scope of this paper.) Moreover, the time of threshold crossing in indi-
TIME DECODING FROM CORTICAL ACTIVITY
173
movement. If the firing rates changed rapidly, the thresholds were crossed sooner, resulting in an early movement onset. This model of movement initiation is consistent with previous work (Hanes and Schall 1996; Renoult et al. 2006; Roitman and Shadlen 2002). Ensemble predictions of temporal intervals Climbing and descending modulation pattern (Fig. 6) in which movement is initiated after the rate reaches movement initiation threshold (Fig. 7) are well suited for decoding temporal intervals. Ideally for a given threshold, two parameters, firing rate and its slope, are sufficient for calculating the J Neurophysiol • VOL
intervals. If neuronal firing was free of noise, these parameters could be derived from just two time points. However, in reality, the neurons’ firing was noisy, and for better decoding with the linear model, we used five time points per neurons and combined many neurons to produce better predictions. The model improved the predictions by accounting for the changes in firing rate within the 0.5-s window. This was shown using a control in which, instead of five bins, an average of the total spike count within the window for each neuron was entered in the model. The quality of predictions obtained using this model, measured as R, was worse compared with the five bin mode by 11% for the predictions of T1 and T2 and by 8% for
99 • JANUARY 2008 •
www.jn.org
Downloaded from jn.physiology.org on March 6, 2012
FIG. 6. Ensemble modulations during self-timed delays. One recording session is shown. All neurons were recorded simultaneously. The panels show rate modulations in the neuronal populations recorded in 5 cortical areas: M1 in monkey 1 (A and F), and M1 and PMd recorded bilaterally in monkey 2 (B–E and G–J). Neuronal rates are centered on button release. In A–E, each horizontal line represents trial-average normalized firing rate for a neuron. Neurons are sorted by the delay-period modulation strength (with the neurons that exhibited strong climbing modulations shown on the top, and the ones that exhibited strong descending patterns on the bottom). Firing rates are color-coded (see key on bottom left). Neuronal rates were clearly modulated in M1 and PMd contralateral to the working hand. Ipsilateral M1 and PMd neurons were less modulated. In F–J, neurons were grouped into subpopulations with climbing, descending, and nonsignificant modulations (see key on top), and average firing rates (in spikes/s) were calculated for each subpopulation. These population averages show stronger modulations in the contralateral areas compared with the ipsilateral areas.
174
M. A. LEBEDEV, J. E. O’DOHERTY, AND M.A.L. NICOLELIS
J Neurophysiol • VOL
99 • JANUARY 2008 •
www.jn.org
Downloaded from jn.physiology.org on March 6, 2012
FIG. 7. Comparison of neuronal modulations for short vs. long self-timed delays. All recording sessions are combined. In both monkeys, the duration of self-timed button presses was variable from trial to trial. The trials were split into 4 groups that corresponded to the following ranges of hold duration: 2–2.5 (green), 2.5–3 (blue), 3–3.5 (red), and 3.5–5 s (black). Average firing rates were calculated separately for each group (color-coded, key on top right). Subpopulations of the neurons with climbing activity (C, E, and G) and the neurons with descending activity (D, F, and H) were analyzed separately. Population averages are shown for M1 of monkey 1 (C and D) and M1 (E and F) and PMd (G and H) of monkey 2, all in the left hemisphere, i.e., contralateral to the working hand. Average rates are aligned on button press onset (left) and button release (right). In each subpopulation of neurons selected for this analysis, firing rate slopes (for the interval 0.5–1.75 s after button press onset) and motor thresholds (for the interval 0.25– 0.5 s before button release) were measured for each individual neuron. Averages of these individual neuron slopes and their SE are displayed on the top left. The slopes were steeper in the trials with shorter self-timed delays. Averages of individual neuron thresholds and their SE are displayed on the top right. The thresholds were independent of the duration of self-timed delays. Average traces of movement-related modulations were also independent of hold duration.
TIME DECODING FROM CORTICAL ACTIVITY
175
Downloaded from jn.physiology.org on March 6, 2012 FIG. 8. Analysis of threshold crossing time in individual neurons using the analysis of Maimon and Assad (2006). Behavioral trials were split into 4 groups by button hold duration the same way as in Fig. 7, A and B. For each of these groups of trials, individual neuron PETHs were constructed. The PETHs were centered on button release. Thresholds were calculated for the same interval as in Fig. 7 (0.25– 0.5 s before button release) by grouping all trials together, and threshold crossings were detected for each PETH (A). In B–G, left panels show average threshold crossing time plotted against the time of movement initiation measured from button press onset and matched with threshold measurement time by subtracting 375 ms. Regression slopes for these plots are close to 1.0. Right panels show distributions of regression slopes for individual cells. As in Fig. 7, subpopulations of the neurons with climbing activity (B, D, and F) and the neurons with descending activity (C, E, and G) were analyzed separately. The results are shown for M1 of monkey 1 (B and C) and M1 (D and E) and PMd (F and G) of monkey 2. These results show that the time of threshold crossing in individual neurons was in good correspondence with the time of movement initiation.
the predictions of button state (P ⬍ 0.001, Wilcoxon signedrank test). Thus the prediction model effectively calculated the neuronal slopes by assigning different weights to neuronal rates measured at different delays relative to the current time. An example of predictions of temporal parameters for seven consecutive trials is shown in Fig. 9. Looking at neuronal ensembles of 311 simultaneously recorded neurons neurons (M1 and J Neurophysiol • VOL
PMd recorded bilaterally) as a whole, one can notice that the activity of individual neurons was noisy, but modulated during the delays, especially in the hemisphere contralateral to the working hand (Fig. 9A). This noise was averaged out in the predictions of temporal intervals (Fig. 9B), which were composed of contributions from many neurons. Three parameters were predicted simultaneously (cf. Fig. 3): time from button press onset, T1, time until
99 • JANUARY 2008 •
www.jn.org
176
M. A. LEBEDEV, J. E. O’DOHERTY, AND M.A.L. NICOLELIS
button release, T2, and button state (1, button pressed; 0, button released). It can be seen that the predictions (red traces) closely follow the actual parameters (blue traces). The predictions of button state decoded the monkey’s overt behavior, whereas the predictions of temporal intervals uncovered covert temporal programming. The prediction of button state was used to gate out the predictions of temporal intervals outside the delay interval of the task. Thus the three predicted variables reconstructed the monkey’s behavior in the self-timing task because they estimated for each moment in time whether or not the monkey was pressing the button and if it was pressing, how much time elapsed from the press onset and how long the monkey was going to hold. These estimations were derived from a relatively short 0.5-s time window. The model did not have have any memory of the firing rates outside of that window. J Neurophysiol • VOL
The quality of predictions from each cortical area was in agreement with the average population modulations shown in Fig. 6. When all neurons recorded in an area were incorporated in the model, contralateral areas were the best source of predictions (R in the range of 0.7– 0.85), whereas the predictions obtained from the ipsilateral areas (R of 0.15– 0.25) were much less accurate (P ⬍ 0.001, Wilcoxon signed-rank test). The values of R for the contralateral areas are similar to the ones previously reported for predictions of kinematic parameters (Carmena et al. 2003; Lebedev et al. 2005; Wessberg et al. 2000) and EMGs (Morrow and Miller 2003; Santucci et al. 2005; Westwick et al. 2006). For neuronal ensembles of different size, predictions of temporal parameters improved with an increase in ensemble size. Figure 10 shows this dependency for the predictions of T2 for one recording session. The results for T1 and the state of button press
99 • JANUARY 2008 •
www.jn.org
Downloaded from jn.physiology.org on March 6, 2012
FIG. 9. Neuronal ensemble activity and predictions of temporal intervals. A: colorplot depicting activity of neuronal ensemble of 311 neurons recorded in monkey 2 during the performance of the self-timing task. The ensemble is comprised of neuronal populations recorded bilaterally from M1 and PMd. Seven consecutive trials are shown. Each horizontal line in the colorplot corresponds to 1 neuron. Color coding depicts firing rate normalized by SD (key, bottom). B: actual (blue) and predicted (red) values task variables: time from button press onset, T1 (top), time until button release, T2 (middle), and button state (1, pressed; 0, released). Based on the predictions of button state, the predictions of T1 and T2 are interrupted for the period when the monkey was not pressing the button.
TIME DECODING FROM CORTICAL ACTIVITY
177
were similar (data not shown). In the scatter plots shown in Fig. 10, A, C, E, and G, each data point represents the accuracy of predictions for a randomly selected neuronal ensemble. Predictions obtained from small ensembles were on average less accurate and more variable from sample to sample. With the increase of ensemble size, the predictions improved and were less variable for different selections. The predictions by contralateral areas (Fig. 10, A and C) clearly outperformed the predictions by ipsilateral areas (Fig. 10, E and G). Although the predictions by small ensembles were on average worse than the predictions by large ensembles, the scatter plots of Fig. 10, A and C, indicate that certain small ensembles (10 –20 best tuned neurons) predicted the temporal interval almost as well as the whole neuronal population. This result is consistent with the previous reports for kinematic (Sanchez et al. 2004) and EMG (Santucci et al. 2005; Westwick et al. 2006) data. As a measure of average prediction performance of a cortical area, we chose average R for 20 randomly selected neurons. This measure corresponded to a variety of ensembles whose R was not saturated because of the ensemble size. J Neurophysiol • VOL
Figure 10, B, D, F, and H, shows neuron-dropping curves (Wessberg et al. 2000) that characterize the dependency of prediction accuracy on the ensemble size for the ensembles selected based on the degree of tuning of individual neurons. The “best to worst curves” represent the selection in which the neuron with the highest R of fit was selected first, then the next to best neuron was added, and so on. Put differently, this curve could be constructed starting with the whole population (rightmost point of the neuron-dropping curve), and dropping the worst tuned neurons until the best tuned was left. Small populations of neurons selected this way clearly showed the top performance for all cortical areas analyzed. After a high prediction level was reached, adding more neurons did not substantially improve the predictions. If the neuronal subsets were selected in the opposite way, starting with the worst performers (worst to best curves), prediction accuracy improved in a much more graded manner. Finally, the conventional neuron dropping curve (Wessberg et al. 2000) for randomly selected populations (i.e., the average of the scatter plots shown in the left panels of Fig. 10) laid between the rank
99 • JANUARY 2008 •
www.jn.org
Downloaded from jn.physiology.org on March 6, 2012
FIG. 10. Neuron-dropping analysis of the predictions of time until button release, T2. One recording session is shown. A–G: accuracy of predictions by neuronal ensembles recorded in several cortical areas in monkey 2 (PMd and M1 in the left and right hemispheres, see labels) expressed as correlation coefficients, R, plotted against ensemble size. Each point corresponds to a randomly selected ensemble. B–H: neuron dropping curves for the same cortical areas. The curves were calculated using 3 methods. Average curves represent average R for randomly selected neuronal subpopulations of different sizes. “Best to worst curves” were calculated by starting with the best-tuned neuron, adding the 2nd ranked neuron, and so on (or, starting from the whole population, dropping the worst, then dropping the next to worst neuron, and so on). These curves characterizes the performance of small ensembles of highly tuned neurons. “Worst to best curves” were calculated by starting with the worst tuned neurons (or dropping the best tuned neurons 1st). They characterize the performance of ensembles of weekly tuned neurons.
178
M. A. LEBEDEV, J. E. O’DOHERTY, AND M.A.L. NICOLELIS
The accuracy of prediction of T1 and T2 was different, depending on the fragment of the delay interval that was used to generate the predictions. Generally, the closer the behavioral event measured by the interval, the better was the prediction (i.e., short T1 and T2 were decoded better). This was shown by two analyses. Both were conducted for randomly selected subpopulations of 20 neurons. In the first analysis (Fig. 12, A–F), we examined predictions of temporal intervals in behavioral trials grouped by the duration of the self-timed delay (the same ranges of delays as in Fig. 7). Average prediction traces were close for T1 and T2 values ⬍1.5–2 s but deviated for longer interval values. For example, independently of how long the monkey was going to continue pressing the button, the model predicted well T1, for ⬃1.5 s from the button press onset (Fig. 12, A, C, and E). This would not be expected if the model simply replicated average firing rates (Fig. 7), which had different slopes depending on the delay duration. However, for longer T1, the model underestimated this interval in the longdelay trials, which did resemble the average firing rate traces (Fig. 7). Similarly, for the predictions of T2 (Fig. 12, B, D, and F), the model initially started with an assumption that T2 would be ⬃2.5 s and corrected the prediction as the button release approached. In the second analysis (Fig. 12, G and H), prediction error E was measured as the function of T1 or T2. The error increased for longer T1 or T2. Thus early in the delay the linear model was most informative of T1 and later in the delay it was most informative of T2.
FIG. 11. PETHs showing 10 simultaneously recorded neurons top-ranked in predicting the time until button release, T2 (A), and in predicting the button state (B). The PETHs are aligned on button release. The best predictors of T2 (and T1, data not shown) exhibited climbing or descending activity patterns, whereas the best predictors of button press had mostly movement-related modulations.
J Neurophysiol • VOL
99 • JANUARY 2008 •
www.jn.org
Downloaded from jn.physiology.org on March 6, 2012
ordered curves. Thus the dropping curve analysis showed that the predictions by small neuronal ensembles critically depended on the presence of neurons with activity highly correlated with the predicted parameter. With the increase of the population size, this dependence was less critical because less correlated neurons could be used for predictions if combined in large numbers. The neurons that were best predictors of one behavioral parameter were not necessarily among the best predictors of a different parameter. Namely, the subpopulations of neurons best tuned to T1 and T2 were different from those best tuned to the state of button press. Figure 11 shows PETHs from a representative recording session for the neurons best predicting T2 (left panels) and the neurons best predicting button state (right panels). Ten top ranked neurons are depicted for each category. These subpopulations have only one neuron in common. The neurons best predicting T2 exhibited climbing or descending patterns during the delay, whereas movementrelated modulations were most pronounced in the patterns of the neurons best predicting the state of button press. The subpopulation of 10 neurons best predicting T1 was the same as the population best predicting T2 (data not shown), with slight differences in the individual ranks. This result suggests that, although relatively small subpopulations of highly tuned neurons can be used for predicting each individual behavioral parameters, larger neuronal populations have to be used to predict several parameters simultaneously.
TIME DECODING FROM CORTICAL ACTIVITY
179
As a control, we attempted to predict temporal intervals from arm muscle EMGs using the same algorithm that predicted temporal intervals from neuronal ensemble activity (Fig. 13). The predictions obtained from the EMGs failed to reproduce the linear time-course of T1 and T2. Instead, it settled to predicting a constant value throughout most of the delay with the exception of the periods adjacent to the EMG bursts, during which the 0.5-s window intersected these bursts. During these periods, the model did predict the time progression to some extent. J Neurophysiol • VOL
The changes in prediction accuracy with prolonged training were subtle. Figure 14 depicts 8 daily recording sessions in monkey 1 and 14 sessions in monkey 2. Statistically significant trends (Wilcoxon signed-rank test) were discovered in three cases. First, predictions slightly improved in M1 neurons recorded in the hemisphere contralateral to the working hand in monkey 2, while slightly decreasing for the M1 neurons recorded in the ipsilateral hemisphere (Fig. 14B). In addition, prediction accuracy slightly decreased in the ipsilateral PMd
99 • JANUARY 2008 •
www.jn.org
Downloaded from jn.physiology.org on March 6, 2012
FIG. 12. Predictions of T1 and T2 for trials with different durations of self-timed delays and for different fragments of the delay interval. A–F: average predictions of T1 (A, C, and E) and T2 (B, D, and F) for trials that fell into different ranges of button press duraton (key on top right). A and B: traces for left M1 in monkey 1. C and D: traces for left M1 in monkey 2. E and F: traces for left PMd in monkey 2. The model well predicted short (⬍2 s) T1 and T2. For longer T1 and T2, the model underestimated these intervals for trials with longer delays. G and H: prediction error for T1 (G) and T2 (H) as the function of interval duration (T1 and T2, respectively). Similarly to A–F, prediction error increased for longer intervals.
180
M. A. LEBEDEV, J. E. O’DOHERTY, AND M.A.L. NICOLELIS
(Fig. 14C). These changes, although small, indicated a tendency for an enhancement of temporal interval representation in the contralateral hemisphere and a decrease of representation in the ipsilateral hemisphere. At the very least, the results of Fig. 14, B and C, show a continued confinement of temporal encoding to the contralateral hemisphere as long as the monkey was trained to perform with the right hand. Predictions after learning to perform with the left hand Predominantly contralateral representation of temporal intervals during self-timed hand movements could be simply related to cortical involvement in motor aspects of the task as opposed to putative generic temporal processing. Such strict linkage to the motor aspects of the task was, however, questioned by the control experiment in which monkey 2 learned to perform the same task with the left hand (Fig. 15). During the execution of the task with one hand (right or left), the monkey did not contract the muscles of the nonworking arm (Fig. 16). Therefore if the cortical modulations were strictly motor, they should have occurred predominantly in the contralateral hemisphere. This was not the case for M1 neurons. (PMd neurons were not analyzed because their recording quality deteriorated.) Indeed, on the third day of training with the left hand, predominantly contralateral modulations were observed only when the monkey performed with the overtrained right hand (Fig. 15, A and D). When the monkey performed with the left hand, M1 neurons in both hemispheres were modulated (Fig. 15, B and E). Average PETHs for the climbing neurons (Fig. J Neurophysiol • VOL
15, C and F) confirmed this result. The analysis of predictions of temporal intervals during training to perform the task with either hand (Fig. 15, G and H) indicated a trend for the predictions by each hemisphere to converge with training with both arms. These observations suggest that the overtrained left hemisphere continued to exhibit a degree of control over the task performance when the monkey performed the task with the left hand instead of the overtrained right hand and that with further training with both hands neural representation of the self-timed movements became delateralized. DISCUSSION
Temporal encoding during self-timed behavior The results of this study are in agreement with the vast literature that showed modulations in cortical neurons related to a range of functions that involve temporal processing: anticipation of behavioral cues (Mauritz and Wise 1986) or rewards (Roesch and Olson 2005; Schultz 2006), temporal programming of movements (Niki and Watanabe 1979), motor preparation (Romo and Schultz 1987; Weinrich and Wise 1982), mental estimation of temporal intervals (Janssen and Shadlen 2005; Leon and Shadlen 2003; Roux et al. 2003; Sakurai et al. 2004), memorial processing (Fuster 2001; Goldman-Rakic 1995; Miller et al. 1996), proactive timing (Maimon and Assad 2006), and decision making (Brody et al. 2003; Kim and Shadlen 1999; Schall 2001; Sugrue et al. 2005). Our results also agree with the EEG studies in human subjects that date
99 • JANUARY 2008 •
www.jn.org
Downloaded from jn.physiology.org on March 6, 2012
FIG. 13. Comparison of interval predictions obtained from neuronal ensemble activity and EMGs. A and C: predictions of T1 in monkey 1 (A) and monkey 2 (C). B and D: predictions of T2 in monkey 1 (B) and monkey 2 (D). Blue traces represent single-trial predictions from neuronal ensemble activity. Red traces represent predictions from the EMGs of arm muscles (the same records as in Fig. 5). Note that the neural predictions follow the linear time course of T1(t) and T2(t), whereas the predictions from the EMGs fail to do so.
TIME DECODING FROM CORTICAL ACTIVITY
181
FIG. 14. Predictions of temporal intervals (mean and SD of R for randomly selected ensembles of 20 cells) for different cortical areas in successive behavioral sessions. A: prediction accuracy for M1 of monkey 1 for 8 recording sessions. Points represent an average of R for T1 and T2. Bars represent SD. B: R of prediction obtained from contraletaral and ipsilateral (see key, top right) M1 in 14 recording sessions in monkey 2. C: R of prediction for contraletaral and ipsilateral PMd in in monkey 2.
J Neurophysiol • VOL
steeper rates of change in the former compared with the latter, whereas movement initiation thresholds remained constant (Fig. 7). This variable rate, constant threshold pattern was observed in the neurons with both climbing and descending activity, both in M1 and PMd, and the time of threshold crossing was well correlated to the time of movement initiation. It should be noted, however, that the similarity in the time-course of neuronal modulations in many neurons in M1 and PMd does not necessarily imply the same functional role. Although informative for decoding temporal intervals, these neurons in principle could be involved in a diverse range of functions. Neuronal activity in M1 and PMd is most commonly described as motor or motor preparatory (Weinrich and Wise 1982). Additionally, these areas have been shown to be involved in programming behavioral goals independently of motor patterns (Kakei et al. 1999; Shen and Alexander 1997a,b), selective visual attention (Lebedev and Wise 2001), and cognitive processing (Carpenter et al. 1999). Importantly, one study (Roux et al. 2003) concluded that M1 represents time in a manner highly dependent on behavioral context. Thus temporal information that we observed in M1 and PMd ensembles was likely a component of complex, multiparametric representations (Brody et al. 2003; Gold and Shadlen 2000) that coexist in the motor cortical areas and the areas with which they communicate. It remains a matter of debate whether or not the brain has specialized circuits for processing behavioral time (Buhusi and Meck 2005). From the perspective of the theories of parallel, distributed processing (Bullier and Nowak 1995; Buonomano and Karmarkar 2002; Burr and Morrone 2006; Engel et al. 1997; Mesulam 1990; Mitchell et al. 1991; Nicolelis et al. 1995; Prut et al. 2001), representation of time, like representation of other parameters, does not have to be confined to any
99 • JANUARY 2008 •
www.jn.org
Downloaded from jn.physiology.org on March 6, 2012
back to the 1960s (Deecke et al. 1976; Kornhuber and Deecke 1964, 1965; Shibasaki and Hallett 2006). Using cortical ensemble recordings that allowed us to record from several hundreds of cortical neurons during each recording session, we found that large proportions of M1 and PMd neurons (⬃55% in the contralateral hemisphere and ⬃15% in the ipsilateral hemisphere) exhibited near-monotonic modulations during the periods of immobility preceding self-timed hand movements. In the contralateral hemisphere, the activity of such neurons typically increased during the delay (45% of the total population had climbing activity vs. 10% with descending activity), whereas in the ipsilateral hemisphere, neurons with climbing and descending activity were found in comparable numbers. Using population recording methods, we also confirmed the scaling property of temporal representation previously reported for serially sampled single units. This property has been described using a “rubber band” metaphor: during longer behavioral delays, neuronal activity stretches along the temporal axis, whereas the pattern of modulations and their amplitude remain virtually unchanged (Renoult et al. 2006). Such scaling is observed in different brain regions of several animal species in the experiments in which animals are trained on different delays (Brody et al. 2003; Komura et al. 2001; Renoult et al. 2006) or exhibit a considerable variability of their behavioral delays (Kalenscher et al. 2006; Renoult et al. 2006). Another way to interpret temporally specific neuronal modulations is to describe them as a gradual increase in firing rate until peak firing rate is reached. This interpretation came from the studies of reaction time movements (Hanes and Shall 1996; Roitman and Shadlen 2002), and one study provided evidence that the threshold crossing mechanism may be universally true for both reaction time and delayed response movements (Kalenscher et al. 2006). We compared neuronal modulations during the short versus long delay trials and found
182
M. A. LEBEDEV, J. E. O’DOHERTY, AND M.A.L. NICOLELIS
particular area, and instead can be encoded by the combined activity of large neuronal networks. We suggest that encoding of time by distributed brain networks can be elucidated by simultaneous recordings from many areas (cortex, striatum, thalamus, each suggested to perform specific neuronal computations during temporal processing; Buhusi and Meck 2005) combined with independent manipulations of temporal, spatial, and motor parameters of behavioral tasks, and such recordings seem to be feasible in light of these results. Neuronal ensembles predict temporal parameters Our study made two advances compared with the previous work on temporal encoding in the cortex. First, we implemented multielectrode, multiarea recordings, which allowed us to record simultaneously from large cortical ensembles. Second, we obtained single-trial predictions of temporal intervals from the recorded cortical ensemble activity. This finding extends previous demonstrations of predictions of behavioral parameters from the activity of neuronal populations. Previous studies predicted arm kinematics (Carmena et al. 2003; Lebedev et al. 2005; Serruya et al. 2002; Taylor et al. 2002; Wessberg et al. 2000), hand gripping force (Carmena et al. 2003), and muscle activity (Morrow and Miller 2003; Santucci et al. 2005; Westwick et al. 2006). In addition to parameters of J Neurophysiol • VOL
movements being executed, predictions were obtained for motor parameters involved planned in advance (Musallam et al. 2004; Quian Quiroga et al. 2006). Cognitive variables have been decoded, as well. For example, remembered and attended locations were decoded from the activity of prefrontal-cortex neurons (Lebedev et al. 2004). The significance of this study is in decoding temporal intervals from neuronal ensemble activity that occurs before overt motor behavior. Decoding of behavioral parameters from neuronal activity can be viewed as an ultimate test for any neurophysiological hypothesis. Here, we obtained a rather complete decoding of a relatively simple behavior that consisted of periodic, self-timed button presses and releases. Three linear models running in parallel decoded whether or not the monkey was pressing the button, and if it was pressing, how long elapsed from the button press onset and how soon the monkey was going to release the button (Figs. 3 and 8). The latter two variables were not manifested in covert motor behavior. The neurons with climbing and descending activity were ideally suited for decoding these covertly represented intervals, and the neurons with movement-related modulations predicted the overt behavior. Although there was not a clear separation between the neurons predicting temporal intervals and those predicting the button state, separate neuronal subpopulations were the best predictors of each of these parameters (Fig. 11). Using large neuronal
99 • JANUARY 2008 •
www.jn.org
Downloaded from jn.physiology.org on March 6, 2012
FIG. 15. Neuronal modulations in different hemispheres and predictions of temporal intervals after monkey 2 started to perform the self-timed task with the left hand. A–F: modulations in left (A–C) and right M1 (D–F) on the 3rd day of training with the left hand. A, B, D, and E depict color-coded PETHs normalized by subtracting the mean and dividing by the SD. As in Fig. 6, the PETHs are by tuning strength (firing rate slope). Tuning strength was measured during the performance with the contralateral hand, the same display arrangement was kept for the performance with the ipsilateral hand. C and F: average PETHs for the neurons that exhibited climbing activity in at least 1 condition. PETHs for the performance with the right hand (black) and left hand (gray) are superimposed. G: predictions of temporal intervals during the performance with the right hand (average R for predictions of T1 and T2; bars represent SD). Vertical dotted line marks the day on which the monkey started performing with the left hand. Open circles correspond to the predictions obtained from M1 in the left hemisphere; filled circles represent the predictions by M1 in the right hemisphere. H: predictions of temporal intervals by the left and right hemispheric M1 ensembles for the sessions in which the monkey worked with the left hand.
TIME DECODING FROM CORTICAL ACTIVITY
183
FIG. 16. Average EMGs of 6 muscles recorded in monkey 2 during the performance with either right or left arm (the same sessions as shown in Fig. 12, A–F). The traces represent averages of full-wave rectified EMGs centered on movement onset. A–C: EMGs of the right-arm muscles. D–F: EMGs of the left-arm muscles. Only the muscles of the working arm were activated during the task performance.
J Neurophysiol • VOL
midway through the delay. Additionally, the performance of the model was limited by the 0.5-s observation window, which may bear similarity with the brain’s limited ability to estimate its previous states. This issue needs to be examined by further experimental and modeling studies. Given the commonality of neuronal modulations during task delays, decoding of temporal intervals will likely become a part of any algorithm that decodes overtly represented sensory, motor, or cognitive parameters. For example, it has been already suggested that computational models of working memory can be improved if they incorporate time dependencies during the delay period (Brody et al. 2003; Rainer and Miller 2002). A similar conclusion has been made for temporal evolution of decision formation and motor preparation (Gold and Shadlen 2000). Ipsilateral representation of temporal information In this study, cortical areas contralateral to the working hand provided the best predictions of temporal intervals as long as the monkey learned to perform the task only with one hand. However, after the monkey started to perform the task with the opposite hand, the previously overtrained hemisphere continued to exhibit neuronal modulations and contribute to temporal predictions, although it was ipsilateral to the working hand. With continued training with both hands, there was a tendency for the temporal representation to become delataralized. This result is consistent with neurophysiological studies in monkeys that showed involvement of ipsilateral PMd and M1 in motor preparation and execution (Cisek et al. 2003; Donchin et al. 1998; Hoshi and Tanji 2000; Kazennikov et al. 1999; Lecas et al. 1986; Steinberg et al. 2002; Tanji et al. 1988). Activation of ipsilateral primary and secondary motor areas during proximal movements in humans was shown using functional MRI (Nirkko et al. 2001). Moreover, transcranial magnetic stimu-
99 • JANUARY 2008 •
www.jn.org
Downloaded from jn.physiology.org on March 6, 2012
samples for predictions was preferable for several reasons. First, the larger the neuronal population, the more highly tuned neurons it contained. Second, more neurons were needed to predict several parameters simultaneously. Finally, even moderately tuned cells served as good predictors when combined in large numbers. Temporal intervals were decoded reasonably well in the individual trials with different duration of self-timed delays. As shown by the comparison with the model without binning within the observation window, our linear model used both the neuronal rates and their slopes. At the same time, the model had certain limitations in estimating the intervals related to remote events. For example, predictions of the time until button release were initially inaccurate and improved as the button release approached (Fig. 12). Similarly, the prediction of the time that elapsed from the button press onset became inaccurate toward the end of the delay period. We suggest that this property of predictions is inherent to neural encoding of temporal parameters and is manifested behaviorally as Weber’s law: the errors in timing are proportional to interval duration (Staddon 2005). This dependency has been recently described by a model of neural timing in which the variability in behavioral timing is explained by statistical drifts of the climbing activity (Reutimann et al. 2004). Such drifts are likely to make neural activity less predictive of the past events and more predictive of the approaching future events. It is unclear at this point of our research how well the model predictions of temporal intervals at different time points within the delay reflected mental estimation of these intervals by the monkey’s brain. For instance, the model had access to slope information and could correct temporal predictions accordingly, whereas the brain might not be able to detect slope fluctuations, which eventually led to performance errors. This question should be addressed in the future using experimental designs in which a monkey reports its temporal judgment
184
M. A. LEBEDEV, J. E. O’DOHERTY, AND M.A.L. NICOLELIS
Timing-based brain–machine interface Reconstruction of temporal parameters of movements can be of practical significance for the design of brain machine interfaces (BMIs) that may 1 day drive a new generation of neuroprosthetic devices for restoring motor functions in severely disabled patients. Many of the BMIs developed so far (Carmena et al. 2003; Lebedev et al. 2005; Serruya et al. 2002; Taylor et al. 2002; Wessberg et al. 2000) implement continuous control of an artificial actuator or a computer cursor by cortical activity. However, continuous movements constitute only a part of the rich repertoire of human motor behavior. Movement sequences are often discontinuous. In such sequences, periods of movements are intermingled with the periods of stationary posture during which attention may be shifted to other tasks. Continuously controlled BMIs require that the user J Neurophysiol • VOL
constantly focus attention on maintaining the actuator in a stationary position, which is a difficult task for such BMIs. Indeed, neuronal modulations occur even in the absence of movements, which causes instability in the actuator. Human users of a neuroprosthetic device will benefit from the ability to produce discontinuous motor patterns with stable no-motion periods. Therefore we envision future BMIs as versatile systems that use a highly flexible multiparameter algorithm. Such an algorithm would, for example, stop the actuator movements after recognizing a delay-period pattern in the activity of the recorded neuronal ensemble. Furthermore, this algorithm would decode temporal judgments made by the subject and prepare the actuator for the upcoming movement. Such decoding of timing information can significantly improve the control of a BMI, effectively splitting it into the epochs during which movements are executed and stationary epochs during which movements are prepared and timed. We propose that delay-period activity be used for reconstruction of temporal motor plans during the operation of a BMI. This complements the idea of extracting information on the prepared movement direction during delay periods of reaching tasks (Musallam et al. 2004). Given the experimental evidence that temporal information is integrated with the representation of other types of information in the activity of cortical neurons (Brody et al. 2003; Gold and Shadlen 2000), we suggest that BMIs will benefit from simultaneous decoding of motor parameters, such as movement direction, and timing of the upcoming movement onset. Such a BMI, in principle, can operate without any continuous control of movements because, once the target and movement initiation time are determined, the actuator controller could perform the movement autonomously. Such a mode of operation is similar to the shared BMI control mode that we previously proposed (Kim et al. 2006). In the shared-control mode, the signals extracted from the brain are used to produce generic commands to the actuator (e.g., where to reach, which object to grasp, when to initiate movement), whereas the actuator controller supervises low-level operations, such as applying appropriate forces and stabilizing the actuator’s operation in different dynamic environments. The observation of delateralization of cortical representation of temporal intervals during task generalization to both hands is also important for the BMI design because it shows that information on motor planning can be decoded from the cortical areas ipsilateral to the working limb. Such delateralization can be important in cases of brain lesions in which the BMI has to be controlled from an area normally less involved in the function that is being restored. This idea is also consistent with parallel, distributed processing in which relevant information can be extracted from nearly any part of the distributed network. ACKNOWLEDGMENTS
We thank D. Dimitrov for conducting the surgery, G. Lehew for engineering the experimental setup, L. Oliveira, W. Drake, S. Halkiotis, and A. Sandler for outstanding technical assistance, and the anonymous reviewers for helpful comments and suggestions. GRANTS
This work was supported by grants from the Defense Advanced Research Projects Agency.
99 • JANUARY 2008 •
www.jn.org
Downloaded from jn.physiology.org on March 6, 2012
lation of the ipsilateral M1 altered the timing of muscle recruitment in a reaching task (Davare et al. 2007). The transformation, from the initial predominantly contralateral representation of timing intervals in M1 and PMd to a bilateral representation after learning with both hands, can be explained by several mechanisms of cortical plasticity. For example, assuming there is such an entity as the general controller of timing behavior that governs climbing activity in M1 and PMd, the emerging bilateral representation could reflect the strengthening of the projections from the controller to the ipsilateral M1 and PMd. Alternatively, without evoking the notion of the specialized neuronal timer, the network representing time in a distributed way could grow to accommodate the ability to perform the same timing task with both hands. In the process of such expansion, interconnections between the areas involved were likely strengthened and the system as a whole started to take advantage of the new representations (e.g., started to use ipsilateral modulations). In humans, bilateral modulations of cortical activity in self-timed tasks were first shown in the 1960s as slow EEG potential, termed Bereitschaftspotential, starting over precentral and parietal areas as early as 2 s before EMG onset (Deecke et al. 1976; Kornhuber and Deecke 1964, 1965; Shibasaki and Hallett 2006). Currently it is believed that this bilateral Bereitschaftspotential originates in the supplementary motor area, followed by the lateral premotor cortex (Ikeda et al. 1992; Yazawa et al. 2000). Contralateral potentials developed in M1 and lateral premotor cortex ⬃0.4 s before EMG onset. In the ␣-frequency band (10 –15 Hz), event-related desyncronization (ERD) started bilaterally in sensorimotor areas ⬃2 s before the onset of self-paced movements (Nagamine et al. 1996). In the -range (16 –24 Hz), ERD started in the left hemisphere and later develops in the right hemisphere before right hand movements in right-handed movements (Bai et al. 2005). However, when these subjects performed movements of their left hands, -range ERD is bilateral. Thus bilateral activations are common in human subjects self timing their movements. It can be speculated that bilateral representation of self-timed processes in humans is related to their higher-order conceptualization of temporal programming different from merely preparing an isolated movement. The monkeys studied in our experiments unlikely conceptualized their timing behavior similarly to humans, but likely developed a more generic representation of the task when trained with both hands.
TIME DECODING FROM CORTICAL ACTIVITY REFERENCES
J Neurophysiol • VOL
Hoshi E, Tanji J. Integration of target and body-part information in the premotor cortex when planning action. Nature 408: 466 – 470, 2000. Ikeda A, Luders HO, Burgess RC, Shibasaki H. Movement-related potentials recorded from supplementary motor area and primary motor area. Role of supplementary motor area in voluntary movements. Brain 115: 1017– 1043, 1992. Ivry RB. The representation of temporal information in perception and motor control. Curr Opin Neurobiol 6: 851– 857, 1996. Ivry RB, Spencer RM. The neural representation of time. Curr Opin Neurobiol 14: 225–232, 2004. Janssen P, Shadlen MN. A representation of the hazard rate of elapsed time in macaque area LIP. Nat Neurosci 8: 234 –241, 2005. Kakei S, Hoffman DS, Strick PL. Muscle and movement representations in the primary motor cortex. Science 285: 2136 –2139, 1999. Kalenscher T, Ohmann T, Windmann S, Freund N, Gunturkun O. Single forebrain neurons represent interval timing and reward amount during response scheduling. Eur J Neurosci 24: 2923–2931, 2006. Kazennikov O, Hyland B, Corboz M, Babalian A, Rouiller EM, Wiesendanger M. Neural activity of supplementary and primary motor areas in monkeys and its relation to bimanual and unimanual movement sequences. Neuroscience 89: 661– 674, 1999. Kermadi I, Liu Y, Rouiller EM. Do bimanual motor actions involve the dorsal premotor (PMd), cingulate (CMA) and posterior parietal (PPC) cortices? Comparison with primary and supplementary motor cortical areas. Somatosens Mot Res 17: 255–271, 2000. Kim HK, Biggs SJ, Schloerb DW, Carmena JM, Lebedev MA, Nicolelis MAL, Srinivasan MA. Continuous shared control stabilizes reach and grasping with brain-machine interfaces. IEEE Trans Biomed Eng 53: 1164 – 1173, 2006. Kim JN, Shadlen MN. Neural correlates of a decision in the dorsolateral prefrontal cortex of the macaque. Nat Neurosci 2: 176 –185, 1999. Kojima S, Goldman-Rakic PS. Delay-related activity of prefrontal neurons in rhesus monkeys performing delayed response. Brain Res 248: 43– 49, 1982. Kolk H. A time-based approach to agrammatic production. Brain Lang 50: 282–303, 1995. Komura Y, Tamura R, Uwano T, Nishijo H, Kaga K, Ono T. Retrospective and prospective coding for predicted reward in the sensory thalamus. Nature 412: 546 –549, 2001. Kornhuber HH, Deecke L. Hirnpotentiala¨nderungen beim Menschen vor und nach Willkurbewegungen, dargestellt mit Magnetband-Speicherung und Ruckwartsanalyse. Pfluegers 281: 52, 1964. Kornhuber HH, Deecke L. Hirnpotentiala¨nderungen bei Willkurbewegungen und passiven Bewegungen des Menschen: Bereitschaftspotential und reafferente Potentiale. Pfluegers Arch 284: 1–17, 1965. Kubota K, Hamada I. Preparatory activity of monkey pyramidal tract neurons related to quick movement onset during visual tracking performance. Brain Res 168: 435– 439, 1979. Lebedev MA, Carmena JM, O’Doherty JE, Zacksenhouse M, Henriquez CS, Principe JC, Nicolelis MA. Cortical ensemble adaptation to represent velocity of an artificial actuator controlled by a brain-machine interface. J Neurosci 11: 4681– 4693, 2005. Lebedev MA, Messinger A, Kralik JD, Wise SP. Representation of attended versus remembered locations in prefrontal cortex. PLoS Biol 2: 1919 –1935, 2004. Lebedev MA, Wise SP. Oscillations in the premotor cortex: single-unit activity from awake, behaving monkeys. Exp Brain Res 130: 195–215, 2000. Lebedev MA, Wise SP. Tuning for the orientation of spatial attention in dorsal premotor cortex. Eur J Neurosci 13: 1002–1008, 2001. Lecas JC, Requin J, Anger C, Vitton N. Changes in neuronal activity of the monkey precentral cortex during preparation for movement. J Neurophysiol 56: 1680 –1702, 1986. Lee IH, Assad JA. Putaminal activity for simple reactions or self-timed movements. J Neurophysiol 89: 2528 –2537, 2003. Leon MI, Shadlen MN. Representation of time by neurons in the posterior parietal cortex of the macaque. Neuron 38: 317–327, 2003. Lucchetti C, Ulrici A, Bon L. Dorsal premotor areas of nonhuman primate: functional flexibility in time domain. Eur J Appl Physiol 95: 121–130, 2005. Maimon G, Assad JA. A cognitive signal for the proactive timing of action in macaque LIP. Nat Neurosci 9: 948 –955, 2006. Matell MS, Meck WH, Nicolelis MA. Interval timing and the encoding of signal duration by ensembles of cortical and striatal neurons. Behav Neurosci 117: 760 –773, 2003.
99 • JANUARY 2008 •
www.jn.org
Downloaded from jn.physiology.org on March 6, 2012
Bai O, Mari Z, Vorbach S, Hallett M. Asymmetric spatiotemporal patterns of event-related desynchronization preceding voluntary sequential finger movements: a high-resolution EEG study. Clin Neurophysiol 116: 1213– 1221, 2005. Brody CD, Hernandez A, Zainos A, Romo R. Timing and neural encoding of somatosensory parametric working memory in macaque prefrontal cortex. Cereb Cortex 13: 1196 –1207, 2003. Buhusi CV, Meck WH. What makes us tick? Functional and neural mechanisms of interval timing. Nat Rev Neurosci 6: 755–765, 2005. Bullier J, Nowak LG. Parallel versus serial processing: new vistas on the distributed organization of the visual system. Curr Opin Neurobiol 5: 497–503, 1995. Buonomano DV, Karmarkar UR. How do we tell time? Neuroscientist 8: 42–51, 2002. Burr D, Morrone C. Time perception: space-time in the brain. Curr Biol 16: R171–R173, 2006. Carmena JM, Lebedev MA, Crist RE, O’Doherty JE, Santucci DM, Dimitrov DF, Patil PG, Henriquez CS, Nicolelis MA. Learning to control a brain-machine interface for reaching and grasping by primates PLoS Biol 1: 193–208, 2003. Carpenter AF, Georgopoulos AP, Pellizzer G. Motor cortical encoding of serial order in a context-recall task. Science 283: 1752–1757, 1999. Cisek P, Crammond DJ, Kalaska JF. Neural activity in primary motor and dorsal premotor cortex in reaching tasks with the contralateral versus ipsilateral arm. J Neurophysiol 89: 922–942, 2003. Coull JT, Vidal F, Nazarian B, Macar F. Functional anatomy of the attentional modulation of time estimation. Science 303: 1506 –1508, 2004. Crammond DJ, Kalaska JF. Modulation of preparatory neuronal activity in dorsal premotor cortex due to stimulus-response compatibility. J Neurophysiol 71: 1281–1284, 1994. Crammond DJ, Kalaska JF. Prior information in motor and premotor cortex: activity during the delay period and effect on pre-movement activity. J Neurophysiol 84: 986 –1005, 2000. Davare M, Duque J, Vandermeeren Y, Thonnard JL, Olivier E. Role of the ipsilateral primary motor cortex in controlling the timing of hand muscle recruitment. Cereb Cortex 17: 353–362, 2007. Deecke L, Grozinger B, Kornhuber HH. Voluntary finger movement in man: cerebral potentials and theory. Biol Cybern 23: 99 –119, 1976. Donchin O, Gribova A, Steinberg O, Bergman H, Vaadia E. Primary motor cortex is involved in bimanual coordination. Nature 395: 274 –278, 1998. Dorris MC, Munoz DP. Saccadic probability influences motor preparation signals and time to saccadic initiation. J Neurosci 18: 7015–7026, 1998. Durstewitz D. Neural representation of interval time. Neuroreport 15: 745– 749, 2004. Elsinger CL, Rao SM, Zimbelman JL, Reynolds NC, Blindauer KA, Hoffmann RG. Neural basis for impaired time reproduction in Parkinson’s disease: an fMRI study. J Int Neuropsychol Soc 9: 1088 –1098, 2003. Engel AK, Roelfsema PR, Fries P, Brecht M, Singer W. Role of the temporal domain for response selection and perceptual binding. Cereb Cortex 7: 571–582, 1997. Fuster JM. The prefrontal cortex—an update: time is of the essence. Neuron 30: 319 –333, 2001. Genovesio A, Tsujimoto S, Wise SP. Neuronal activity related to elapsed time in prefrontal cortex. J Neurophysiol 95: 3281–3285, 2006. Gold JI, Shadlen MN. Representation of a perceptual decision in developing oculomotor commands. Nature 404: 390 –394, 2000. Goldman-Rakic PS. Cellular basis of working memory. Neuron 14: 477– 485, 1995. Halsband U, Ito N, Tanji J, Freund HJ. The role of premotor cortex and the supplementary motor area in the temporal control of movement in man. Brain 116: 243–266, 1993. Hanes DP, Schall JD. Neural control of voluntary movement initiation. Science 274: 427– 430, 1996. Harrington DL, Boyd LA, Mayer AR, Sheltraw DM, Lee RR, Huang M, Rao SM. Neural representation of interval encoding and decision making. Brain Res Cogn Brain Res 21: 193–205, 2004. Haykin S. Adaptive Filter Theory (4th ed.). Upper Saddle River, NJ: Prentice Hall, 2002. Hinton SC, Meck WH. Frontal-striatal circuitry activated by human peakinterval timing in the supra-seconds range. Brain Res Cogn Brain Res 21: 171–182, 2004.
185
186
M. A. LEBEDEV, J. E. O’DOHERTY, AND M.A.L. NICOLELIS
J Neurophysiol • VOL
Roesch MR, Olson CR. Neuronal activity in primate orbitofrontal cortex reflects the value of time. J Neurophysiol 94: 2457–2471, 2005. Roitman JD, Shadlen MN. Response of neurons in the lateral intraparietal area during a combined visual discrimination reaction time task. J Neurosci 22: 9475–9489, 2002. Romo R, Schultz W. Neuronal activity preceding self-initiated or externally timed arm movements in area 6 of monkey cortex. Exp Brain Res 67: 656 – 662, 1987. Roux S, Coulmance M, Riehle A. Context-related representation of timing processes in monkey motor cortex. Eur J Neurosci 18: 1011–1016, 2003. Sakurai Y, Takahashi S, Inoue M. Stimulus duration in working memory is represented by neuronal activity in the monkey prefrontal cortex. Eur J Neurosci 20: 1069 –1080, 2004. Sanchez JC, Carmena JM, Lebedev MA, Nicolelis MA, Harris JG, Principe JC. Ascertaining the importance of neurons to develop better brainmachine interfaces. IEEE Trans Biomed Eng 51: 943–953, 2004. Santucci DM, Kralik JD, Lebedev MA, Nicolelis MA. Frontal and parietal cortical ensembles predict single-trial muscle activity during reaching movements in primates. Eur J Neurosci 22: 1529 –1540, 2005. Schall JD. Neural basis of deciding, choosing and acting. Nat Rev Neurosci 2: 33– 42, 2001. Schultz W. Behavioral theories and the neurophysiology of reward. Annu Rev Psychol 57: 87–115, 2006. Schultz W, Dayan P, Montague PR. A neural substrate of prediction and reward. Science 275: 1593–1599, 1997. Schultz W, Romo R. Neuronal activity in the monkey striatum during the initiation of movements. Exp Brain Res 71: 431– 436, 1988. Serruya MD, Hatsopoulos NG, Paninski L, Fellows MR, Donoghue JP. Instant neural control of a movement signal. Nature 416: 141–142, 2002. Shen L, Alexander GE. Neural correlates of a spatial sensory-to-motor transformation in primary motor cortex. J Neurophysiol 77: 1171–1194, 1997a. Shen L, Alexander GE. Preferential representation of instructed target location versus limb trajectory in dorsal premotor area. J Neurophysiol 77: 1195–1212, 1997b. Shibasaki H, Hallett M. What is the Bereitschaftspotential? Clin Neurophysiol 117: 2341–2356, 2006. Shuler MG, Bear MF. Reward timing in the primary visual cortex. Science 311: 1606 –1609, 2006. Staddon JE. Interval timing: memory, not a clock. Trends Cogn Sci 9: 312–314, 2005. Stein J, Walsh V. To see but not to read; the magnocellular theory of dyslexia. Trends Neurosci 20: 147–152, 1997. Steinberg O, Donchin O, Gribova A, Cardosa de Oliveira S, Bergman H, Vaadia E. Neuronal populations in primary motor cortex encode bimanual arm movements. Eur J Neurosci 15: 1371–1380, 2002. Sugrue LP, Corrado GS, Newsome WT. Choosing the greater of two goods: neural currencies for valuation and decision making. Nat Rev Neurosci 6: 363–375, 2005. Tanji J, Okano K, Sato KC. Neuronal activity in cortical motor areas related to ipsilateral, contralateral, and bilateral digit movements of the monkey. J Neurophysiol 60: 325–343, 1988. Taylor DM, Tillery SI, Schwartz AB. Direct cortical control of 3D neuroprosthetic devices. Science 296: 1829 –1832, 2002. Toplak ME, Tannock R. Time perception: modality and duration effects in attention-deficit/hyperactivity disorder (ADHD). J Abnorm Child Psychol 33: 639 – 654, 2005. Vaadia E, Kurata K, Wise SP. Neuronal activity preceding directional and nondirectional cues in the premotor cortex of rhesus monkeys. Somatosens Mot Res 6: 207–230, 1988. Weinrich M, Wise SP. The premotor cortex of the monkey. J Neurosci 2: 1329 –1345, 1982. Wessberg J, Stambaugh CR, Kralik JD, Beck PD, Laubach M, Chapin JK, Kim J, Biggs SJ, Srinivasan MA, Nicolelis MA. Real-time prediction of hand trajectory by ensembles of cortical neurons in primates. Nature 408: 361–365, 2000. Westwick DT, Pohlmeyer EA, Solla SA, Miller LE, Perreault EJ. Identification of multiple-input systems with highly coupled inputs: application to EMG prediction from multiple intracortical electrodes. Neural Comput 18: 329–355, 2006. Wittmann M, von Steinbuchel N, Szelag E. Hemispheric specialisation for self-paced motor sequences. Brain Res Cogn Brain Res 10: 341–344, 2001. Yazawa S, Ikeda A, Kunieda T, Ohara S, Mima T, Nagamine T, Taki W, Kimura J, Hori T, Shibasaki H. Human presupplementary motor area is active before voluntary movement: subdural recording of Bereitschaftspotential from medial frontal cortex. Exp Brain Res 131: 165–177, 2000.
99 • JANUARY 2008 •
www.jn.org
Downloaded from jn.physiology.org on March 6, 2012
Mauritz KH, Wise SP. Premotor cortex of the rhesus monkey: neuronal activity in anticipation of predictable environmental events. Exp Brain Res 61: 229 –244, 1986. Meck WH. Neuropsychology of timing and time perception. Brain Cogn 58: 1– 8, 2005. Meck WH, Malapani C. Neuroimaging of interval timing. Brain Res Cogn Brain Res 21: 133–137, 2004. Merzenich MM, Jenkins WM, Johnston P, Schreiner C, Miller SL, Tallal P. Temporal processing deficits of language-learning impaired children ameliorated by training. Science 271: 77– 81, 1996. Mesulam MM. Large-scale neurocognitive networks and distributed processing for attention, language, and memory. Ann Neurol 28: 597– 613, 1990. Miller EK, Erickson CA, Desimone R. Neural mechanisms of visual working memory in prefrontal cortex of the macaque. J Neurosci 16: 5154 –5167, 1996. Mitchell IJ, Brotchie JM, Brown GD, Crossman AR. Modeling the functional organization of the basal ganglia. A parallel distributed processing approach. Mov Disord 6: 189 –204, 1991. Morrow MM, Miller LE. Prediction of muscle activity by populations of sequentially recorded primary motor cortex neurons. J Neurophysiol 89: 2279 –2288, 2003. Musallam S, Corneil BD, Greger B, Scherberger H, Andersen RA. Cognitive control signals for neural prosthetics. Science 305: 258 –262, 2004. Nagamine T, Kajola M, Salmelin R, Shibasaki H, Hari R. Movement-related slow cortical magnetic fields and changes of spontaneous MEG- and EEG-brain rhythms. Electroencephalogr Clin Neurophysiol 99: 274 –286, 1996. Nicolelis MA, Baccala LA, Lin RC, Chapin JK. Sensorimotor encoding by synchronous neural ensemble activity at multiple levels of the somatosensory system. Science 268: 1353–1358, 1995. Nicolelis MA, Dimitrov D, Carmena JM, Crist R, Lehew G, Kralik JD, Wise SP. Chronic, multisite, multielectrode recordings in macaque monkeys. Proc Natl Acad Sci USA 100: 11041–11046, 2003. Nicolelis MA, Ghazanfar AA, Faggin BM, Votaw S, Oliveira LM. Reconstructing the engram: simultaneous, multisite, many single neuron recordings. Neuron 18: 529 –537, 1997. Niki H, Watanabe M. Prefrontal and cingulate unit activity during timing behavior in the monkey. Brain Res 171: 213–224, 1979. Nirkko AC, Ozdoba C, Redmond SM, Burki M, Schroth G, Hess CW, Wiesendanger M. Different ipsilateral representations for distal and proximal movements in the sensorimotor cortex: activation and deactivation patterns. Neuroimage 13: 825– 835, 2001. O’Boyle DJ, Freeman JS, Cody FW. The accuracy and precision of timing of self-paced, repetitive movements in subjects with Parkinson’s disease. Brain 119: 51–70, 1996. Okamoto H, Isomura Y, Takada M, Fukai T. Temporal integration by stochastic recurrent network dynamics with bimodal neurons. J Neurophysiol 97: 3859 –3867, 2007. Penney TB, Meck WH, Roberts SA, Gibbon J, Erlenmeyer-Kimling L. Interval-timing deficits in individuals at high risk for schizophrenia. Brain Cogn 58: 109 –118, 2005. Prut Y, Perlmutter SI, Fetz EE. Distributed processing in the motor system: spinal cord perspective. Prog Brain Res 130: 267–278, 2001. Quian Quiroga R, Snyder LH, Batista AP, Cui H, Andersen RA. Movement intention is better predicted than attention in the posterior parietal cortex. J Neurosci 26: 3615–3620, 2006. Quintana J, Fuster JM. Mnemonic and predictive functions of cortical neurons in a memory task. Neuroreport 3: 721–724, 1992. Rainer G, Miller EK. Timecourse of object-related neural activity in the primate prefrontal cortex during a short-term memory task. Eur J Neurosci 15: 1244 –1254, 2002. Rainer G, Rao SC, Miller EK. Prospective coding for objects in primate prefrontal cortex. J Neurosci 19: 5493–5505, 1999. Rao SM, Mayer AR, Harrington DL. The evolution of brain activation during temporal processing. Nat Neurosci 4: 317–323, 2001. Renoult L, Roux S, Riehle A. Time is a rubberband: neuronal activity in monkey motor cortex in relation to time estimation. Eur J Neurosci 23: 3098 –3108, 2006. Reutimann J, Yakovlev V, Fusi S, Senn W. Climbing neuronal activity as an event-based cortical representation of time. J Neurosci 24: 3295–3303, 2004. Riehle A, Requin J. The predictive value for performance speed of preparatory changes in neuronal activity of the monkey motor and premotor cortex. Behav Brain Res 53: 35– 49, 1993. Riesen JM, Schnider A. Time estimation in Parkinson’s disease: normal long duration estimation despite impaired short duration discrimination. J Neurol 248: 27–35, 2001.