Ensuring Coverage Quality with Tolerable Interference through Optimizing the Deployment of BSs in Radio Frequency Communications Yu-Hsin Cheng
Chi-Yuan Chang
Department of Computer Science and Engineering National Chung Hsing University Ling Tung University, Taichung City, Taiwan
[email protected]
CMC Consulting Inc. CMC Consulting Inc. Taichung City, Taiwan
[email protected]
Chih-Ming Lu
Shang-Juh Kao
Department of Computer Science Tunghai University Taichung City, Taiwan
Department of Computer Science and Engineering National Chung Hsing University Taichung City, Taiwan
[email protected]
Abstract—Blocking probability, coverage quality, and interference are three imperative factors to be included in planning a radio frequency (RF) communication system. Coverage quality refers to the acceptable communication quality, which can be determined in three ways: land surface, population, or traffic. In a RF communication, interference can be categorized into noise, co-channel interference, and adjacent channel interference. When a wireless network becomes congested, either extra channels or extra Base Stations (BSs) can be introduced. As the blocking probability is strongly depended upon the coverage quality and interference, we focus on the study of the impact from both factors. Since assessing these interrelated factors is complicated when planning a system with thousands of access points, we present a mechanism with a set of optimal parameters that maximizes the communication capacity and meets the actual coverage quality with tolerable interference in building an RF system. In this paper, a sample data of wireless usage from central Taiwan is taken to evaluate the feasibility of the propose method. Solutions of co-channel interference are also presented to limit the interference in both up-link and down-link channels.
factors. Under the planning of wireless communication, in order to calculate precise coverage and sources of disturbance, one must identify environmental parameters, including: the number of usable channels, Effective Isotropic Radiated Power (EIRP), record of calls, population distribution, Signal to Noise Ratio (SNR), Signal to Interference Ratio (SIR) Received Signal Strength Indicator (RSSI), the location of establishable BS, etc. In the planning of wireless communications systems, the environment and various parameters of the system equipment must be integrated using statistical and operational research (OR) principles. This paper proposes and explains the method of using the OR quantitative management concept to plan a system, as well as to calculate any planning issues using the concept of simulated annealing (SA) [4]. In addition, this paper explores using an IRMA (Integrated Radio Frequency Modeling Aid) simulated platform to experiment in the Xitun area of Taichung, Taiwan. It also discusses how to effectively reduce the number of base stations (BS) under the condition of compliant coverage.
Keywords-radio frequency; coverage; interference; blocking
II. I.
INTRODUCTION
In the WiMax Systems M-Taiwan[1] wireless broadband project, the NCC promotes HDTV[2] (high definition television) based on the convenience. The system behind such technology was the cellular system and the simulcast system. Blocking probability, coverage quality, and interference are three imperative factors to be included in planning a radio frequency (RF) communication system. [3] As the blocking probability is strongly depended upon the coverage quality and interference, we focus on the study of the impact from both
RELATED WORK
A. Coverage Coverage can be considered using three factors: land area, population density and call volume. Land area: The most frequently seen method is to divide the land based on area. The currently applied method is to zone the land using latitude and longitude so that the land coverage reaches a certain percentage. The advantage of doing so is that the planning is easy and time to build is short. The disadvantage is insufficient or wastes in system buildout. For
example, in commercial centers where the land area is smaller and the population is denser, the base stations may be underallocated, resulting in insufficient network coverage. Population Density: Coverage based on population density must be planned according to the weighed population distribution so that the base stations will cover a certain percentage of the population. Meanwhile, the system will be placed in areas with denser population. However, populations move, therefore this methodology is more complex than the land zoning method. The advantage of this method is its closer proximity to the predicted goal. Call Volume: This method plans coverage area based on call volume. This planning method is used only after the system is implemented, so that the realistic call volume data may be obtained and the system may be adjusted according to usage. B. Coverage Analysis: Simulcast and Cellular Systems The Simulcast system signals outward; therefore download coverage should be considered, meaning the RSSI requirements must be satisfied. The HDTV plan project is precisely based on the simulcast system. The cellular system such as Wi-Fi, WiMAX and GSM are all bi-directional in signaling. Therefore, when the base station sends signals, downlink and uplink coverage are both necessary; only in areas where uplink and downlink are both available would be considered a covered area; from GSM’s design perspective, the cellular system’s planning principles are: The larger the coverage, the smaller the call volume, therefore the smaller any disturbance factors. On the contrary, the smaller the coverage, the larger the call volume and the larger the disturbance factor. C. Simulated Annealing (SA) This paper uses Simulated Annealing to calculate any planning problems. SA is a methodology derived from modeling. It was first mentioned by Metropolis in 1953 and was used by S. Kirkpatrick in 1983 to obtain maximized combination in solving a problem. The principle is to heat the ingredients for metallurgy. During the process, high heat was used to melt iron for shaping. The temperature was reduced afterwards and the iron was hammered and eventually became steel. This gradual temperature reduction in RF system design could help to gradually improve redundant base stations to reduce cost. Simulated Annealing can be used in consecutive and inconsecutive system parameters. The system’s object function should be established first. [5] [6] The OF represents the maximized function, whereas the function can be the system’s communications capacity, or the signal delay spread (SDS) of the simulcast system, which can be a measuring standard in the system’s quality. D. Radio Frequency (RF) Planning In RF Planning, the hardware’s parameters and their optimization in software control carry significant impact. Therefore, before system planning, hardware selection is a very
important task. [7] [8] RF planning is optimized when the environment and the system are integrated perfectly to reach the largest communications capacity with the least interference. III.
THE PLANNING AND MANAGEMENT OF THE COVERAGE
Normally system operators will list their requirements on system coverage. It is the foundation of future optimization work. In this section, some factors and their calculation are discussed for reference. A. Analysis of Coverage Area In defining coverage area, one must define coverage first. Using the cellular system as an example, the base station and Customer Premise Equipment (CPE) are both bi-directional in communication, therefore uplink and downlink both need to be considered. The reception end and its received frequency must be larger than the lowest acceptable RSSI, to count as this system’s effective coverage. Secondly, the noise within the service area and the Building and Environmental cluttering are factors in considering propagation loss. The RSSI calculation formula after the hardware and system location were known are as follows: RSSI = EIRP - path loss - Environmental Cluttering
(1)
B. Coverage Rate Planning and Calculation Method Coverage quality refers to the acceptable communication quality, which can be determined in three ways: land surface, population, or traffic. Using traffic to determine system coverage is preferable for system operators, but traffic is not known until the system becomes commercially operational. As a result, land surface and population have to be used to determine coverage. C. Using land area as the target to process coverage The reason to plan coverage based on land area is outdoor movements. First, in planning systems, we must obtain land area information and draw multi-faceted service areas. In this area, grid cells are drawn according to the longitude and latitude and the downlink coverage is defined to be one base station in each grid that is larger than CPE’s lowest reception frequency. Uplink coverage is defined as each grid having one CPE and at least one base station must receive a signal larger than the lowest reception frequency. A cell that satisfies these requirements is referred to as an “ok cell.” When all covered cells are compared with OK cells, one derives a formula to calculate land-zoned coverage, such as (2): Rate of coverage = number of ok cells/total number of grids (2) If the coverage is greater than system implementation requirements, some base stations should be removed to maximize the system’s efficiency. Not only does doing so reduce construction and implementation costs, it also reduces
interference to the system. The maximization formula involves identifying object function, such as (3): Objective Function = % Coverage - f × # of sites removed (3) % Coverage:System’s required % of coverage. f:cell weight factor, each cell has different weigh factor and each user decides the factor independently, with one being the largest, adjusted according to system requirements. For example, around train stations or government buildings, high population areas or other important factors could be the decision making factors; in rural areas, the cell factors could be smaller. D. Processing Methodology Based on Population Density In planning a system, the population density and distribution mapping must be obtained first. The system planning area is gridded according to longitude and latitude and the population information is weighed for each grid. The OK grid weighted total is summarized and compared with the weighted total of all grids. The average of such weighted values would be the coverage of the population, such as (4). Coverage = ok cell weighed sum / total weigh value of the grids (4) For example, an area with four cells A, B, C and D has the weight value o 10, 5, 1 and 0; Cell A and B are OK Cells, whereas Cell C and D are non-OK cells. The coverage rate would be = (10*1+5*1+1*0+0*0)/(10+5+1+0)=15/16=93.75% IV.
THE PROCESSING OF INTERFERENCE
In a radio frequency system, in order to satisfy the requirements of outstanding communication quality, the interference within the system must be controlled within the acceptable parameter. System planning would always aim to maximize communication capacity with the least amount of interference. A. Interference Analysis In a RF communication, interference can be categorized into noise, co-channel interference, and adjacent channel interference. [9] Noise can be evaluated with Signal-to-Noise Ratio (SNR), which is a useful parameter for determining coverage. Adjacent channel interference can be adjusted through filtering, but co-channel interference is more complicated because both the up-link and down-link channels have to be considered. This paper raises processing method of co-channel interference to control downlink and uplink frequency interference to within the acceptable parameter. Below are summaries of such co-channel interference. B. Downlink Interference Analysis First, we must find our needed “OF.” Objective Function(OF) = % 0f OK cell
Secondly, when considering Downlink Interference, cell A is the OK cell and must satisfy the following two criteria: RSSI (cell A) > - 80dBm. (adjusted according to system developer’s requirements.) Downlink SIR > 10dB (adjusted according to system developer’s requirements) The Downlink SIR is calculated as below: Downlink Interference = Σ RSSI ith AP to cell A Downlink SIR = RSSI (cell A) ÷ Downlink Interference C. Uplink Iinterference Analysis First, we must find our needed “OF.” Objective Function(OF) = % 0f OK cell Secondly, when considering Uplink Interference, cell A is the OK cell and must satisfy the following two criteria: RSSI (cell A) > - 90dBm. (adjusted according to system developer’s requirements.) Uplink SIR > 10dB (adjusted according to system developer’s requirements) The Uplink SIR is calculated as below: Uplink Interference = Σ RSSI ith area Uplink SIR = RSSI (cell A) ÷ Uplink Interference V. WIRELESS COMMUNICATION SYSTEM PLANNING AND IMPLEMENTATION MECHANISM We are providing the mechanism in wireless system planning and implementation based on actual experience. Our goals are to: 1. Plan and establish the process procedures. 2. Reduce implementation cost and time. 3. Ensure communication quality for references in building wireless communications systems. Steps for wireless system implementation mechanism are as follows: Step 1: Mark the locations of Base Stations First, collect data according to the planning zone, such as the top of buildings or high locations and conduct location surveys to ensure base station locations. Mark such locations to ensure that they are valid base station locations, mark their longitude, latitude and altitude for base station location analysis. The purpose of the analysis is to avoid interference and jam between base stations and to simulate such locations on the simulation platform. Step 2: Find noise and interference distribution Find noise distribution and calculate RSSI in the following steps. The environment is full of interference and based on base station area measurements, the test tool Network Stumbler should be used to identify sources of interference for further
simulation on the platform, which could exclude possible interference in the future. Step 3: Calculate the system’s lowest RSSI Due to different reception equipment, the signals are different also. There are different types of data and voices and the system, equipment and usage are different also, resulting in different RSSI. Step 4: Purchasing decision in system equipment standards After the specs of the equipment are decided based on RSSI, the minimum requirement of the system is decided and movable and unmovable equipment, antennas and frequencyadjustable products are purchased accordingly to reduce cost and avoid waste.
VI.
EXPERIMENT
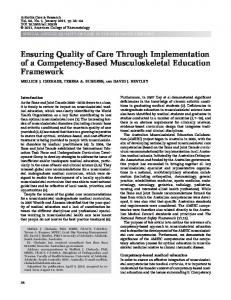
This experiment is based on the cellular system coverage planning of the central Taiwan, using IRMA (Integrated Radio Frequency Modeling Aid) as the base of planning. First the planning zone was drawn and the appropriate base stations were marked (Figure 1). The green dots are appropriate locations for base stations; red spots are base stations already established. The planning steps are as follows: Step 1: System Maximization Graph the planned zone, and mark the base station within this area. (Figure 1).
Step 5: Find the appropriate propagation model[10] [11] and calculate coverage rate. Find the appropriate propagation model according to collected parameters and calculate the coverage rate of coverage rate after all base stations are built. The calculation principle is based on land area and population density for the reason of proving the hypothesis. Step 6: Determine whether coverage reached system requirement Based on calculations results examine whether the coverage reached minimum system requirements. As required, if the selected base station coverage rate surpassed system requirements, then proceed to step 7 to maximize system efficiency. If not, the selected BS cannot satisfy the lowest system requirement and step 1 should be repeated to select a new base station location.
Figure 1: Mark the implementable base stations Step 2: Divide into grids by latitude and longitude into 30983 grids (Figure 2).
Step 7: System coverage maximization If the system coverage already reached the requirement set by the system implementor, then some base stations could be removed within the system to reduce building costs. Call volume distribution should be considered so that jam and interference can be addressed to maximize the system Step 8: Build system according to maximization results Build the system according to the maximization results. After building, proceed to the road test. Step 9: Road test and maximization result comparison After system building, road test is carried out and compared to the results of maximized simulation. If the difference in environmental parameters greatly differs, return to Step 7 and adjust for the best results. If the results are not too different from calculation results, then the system is proven to be maximized. Step 10: System Maximization This step involves fine-tuning, such as adjustment of antenna angles.
Figure 2: Service Area divided into 30983 grids. Step 3: Presuming all base stations are established, the complete coverage of the area is calculated to be 73.1% (Figure 3)
proposes the most ideal implementation methods according to past experience. Not only so, experiments based on IRMA (Integrated Radio Frequency Modeling Aid) were used to achieve system-required coverage in order to plan effective base station reduction and maximize efficiency. This paper focuses on coverage and interference. System interference issues [12] [13] [14] include system jams, which can be further discussed in the future. REFERENCES [1]
Figure 3: The complete coverage of the area is calculated to be 73.1%
[2] [3]
Step 4: Suppose 7 green points are redundant base stations and should be removed, the coverage area left is calculated to be 72.85% (Figure 4)
[4]
[5]
[6]
[7]
[8]
[9]
Figure 4: The coverage area after 7 green dots are removed is calculated to be 72.85% Step 5: According to the results of simulation, land survey is carried out. The simulation results are further examined to adjust the parameters. Finally, we choose the points to be removed and then we calculate the remaining coverage to see whether they reach system requirements as shown in Figure 3 and Figure 4. Seven base stations are removed, but coverage is only reduced by 0.25%. The system meets requirements with reduction of base stations and the efficiency is maximized. VII. CONCLUSIONS In wireless radio communications system planning, the system’s environment and system equipment are integrated to achieve the most ideal parameter combination. This paper
[10]
[11]
[12]
[13]
[14]
M-Taiwan http://www.nici.nat.gov.tw/content/application/nici/n100200610071000 0/guest-cntgrp-browse.php?ordinal=100200610071 HDTV http://www.ncc.gov.tw/chinese/files/09050/1223_9277_090626_1.pdf G. L. Bilbro and W. E. Snyder, “Optimization of functions with many minima,” IEEE Transactions on Systems, Man and Cybernetics, Vol. 21, No. 4, pp. 840-849, 1991. D. J. Chen, C. Y. Lee, C. H. Park, and P. Mendes, “Parallelizing simulated annealing algorithms based on high-performance computer,” Journal of Global Optimization, Vol. 39, No. 2, pp. 261-289, 2007. B. Li, Z. S. Li, Y. H. Chen, and B. L. Li, “Automatic Test Data Generation Tool Based on Genetic Simulated Annealing Algorithm,” 2007. Y. Liang and L. Xu, “Mobile robot global path planning using hybrid modified simulated annealing optimization algorithm,” Proceedings of the first ACM/SIGEVO Summit on Genetic and Evolutionary Computation, Vol. 45, No. 7, pp. 309-314, 2009. J. Laiho, A. Wacker, and T. Novosad, “Radio network planning and optimisation for UMTS,” John Wiley & Sons, Inc. New York, NY, USA, 2002. K. Raivio, O. Simula, and J. Laiho, “Neural analysis of mobile radio access network,” IEEE International Conference on Data Mining, Vol. 45, No. 7, pp. 457-464, 2001. T. S. Rappaport, “Wireless communications: principles and practice,” Prentice Hall PTR New Jersey, 2002. H. Sawada, S. Araki, R. Mukai, and S. Makino, “Grouping separated frequency components by estimating propagation model parameters in frequency-domain blind source separation,” IEEE Transactions on Audio, Speech, and Language Processing, Vol. 15, No. 5, pp. 15921604, 2007. P. Almers, E. Bonek, A. Burr, N. Czink, M. Debbah, V. Degli-Esposti, H. Hofstetter, P. Kyosti, D. Laurenson, and G. Matz, “Survey of channel and radio propagation models for wireless MIMO systems,” EURASIP Journal on Wireless Communications and Networking, 2007. H. Zhang, P. Soldati, and M. Johansson, “Optimal link scheduling and channel assignment for convergecast in linear wirelesshart networks,” Proceeding of the 7th International Symposium on Modeling and Optimization in Mobile, Ad Hoc, and Wireless Networks (WiOpt), 2009. A. P. Subramanian, H. Gupta, S. R. Das, and J. Cao, “Minimum interference channel assignment in multiradio wireless mesh networks,” IEEE transactions on mobile computing, pp. 1459-1473, 2008. M. Drieberg, F. C. Zheng, R. Ahmad, Olafsson, and S. M. Fitch, “Effectiveness of asynchronous channel assignment scheme in heterogeneous WLANs,” Proceedings of the 4th international conference on Wireless pervasive computing, pp. 163-167, 2009.