Entropy-biased Models for Query Representation ... - Semantic Scholar
Recommend Documents
School of Computer Science. Carnegie Mellon University. Pittsburgh, PA 15213, USA. Abstract. We explore several different document representation models.
our Wikipedia expansion strategy. ... nique for mining the links and anchor text in Wikipedia for ...... under Contract Number IBM W0550432 (DARPA PRIME.
Jul 7, 2000 - search into query languages tailored to semi-structured data, by first examining what properties .... 2.6.1 The SQL/XQL style approach . ..... It makes use of another shortcut construction: in case the relation is .... structure of docu
Aug 12, 2009 - Jie Bao, Li Ding, and James Hendler. Tetherless World ... and tools) help both define and organize data semantics. This enables the au-.
Semantic Query Caching for Heterogeneous Databases. Parke Godfrey. U.S. Army Research Laboratory. 2800 Powder Mill Road. Adelphi, Maryland 20783- ...
SELECT ?x WHERE { ?x lubm:takeCourse ?y . ... SELECT ?y WHERE { ..... Jamedon 5 (1,047,950 triples) and BBC-PEEL 6 (271,369 triples) datasets. They are ...
Such query optimization is absolutely necessary in a DBMS. .... programming search strategy used by commercial query optimizers and briefly describes ...
complexity of distributed query optimization. IEEE. Tra ns act i o ns o n K n ow le dg e a n d D ata E n g inee r in g ,. (6) :650 - 662, August 1# 6. [4] Sanjeev Arora.
Jan 3, 1994 - maintained, spatial operations cannot be composed directly without building intermediate database relation
May 26, 2006 - ing search engine query logs to get fast query recommenda- tions on a large scale ... are not very familiar with a certain domain, we can use the.
Oct 18, 2012 - free version of MNIST, with 0.81% error. In the last few years, ... http://www.image-net.org/challenges/L
AbstractâResearch on query optimization has traditionally focused on exhaustive .... nomial algorithms that guarantee optimality. For instance, for chain .... For that reason, query engines commonly restrict the search space to consider only ...
An example of a Web service based on the ranking query model is the Yahoo search engine. (http://www.yahoo.com). The goal of the Ya- hoo service is a wider ...
The above query asks for mothers and their children. The result of a query ..... the information that mary and jesus-christ are in the has child relation into the RDF ...
Jun 12, 2008 - that the optimizer's estimated cost of a query is a good indicator to the actual execution ... compact representation of the optimization search space that allows us to very efficiently .... the execution engine. Figure 3 shows the ...
Jun 16, 2009 - on multiple query representationsâwhat we call query aspectsâto build pseudo- ..... a solid line of points is visible in the center of the data cloud, ...
Nashville (TN):. Department of Biomedical Informatics, Vanderbilt University, 1999. CCS99 .... 1999. NIC99. McCloskey, Joanne C.; Bulechek, Gloria M., editors.
Aug 19, 2005 - ture can be used to adjust the ranking and improve search effectiveness, and if ... test collection from a BM25 baseline. ...... Web search engine.
School of Computer Science and Information Technology,. RMIT University, Melbourne, Australia. {bodob ... erage effectiveness in information retrieval. ..... (ms). (MB). 8. None. 23. 0.221. 0.442. 0.260 n/a. 8. Standard. 211. 0.247â¡. 0.466. 0.288 .
while additional options are introduced by radio buttons ... pop-up list works similar to radio buttons allowing ... fact, any Boolean query containing either opera-.
The Prague Dependency Treebank is a manually annotated corpus of Czech. ... section, we describe briefly the Prague Dependency Treebank structure and its history. 2.1. ...... Baltimore, MD, http://www.clsp.jhu.edu/ws99/projects/mt/toolkit.
A database management system (DBMS) performs query optimization based on statistical ... analyzing statistics for the whole database is still significant,.
from the perspective of a programming language was proposed by Shaw [Shaw 1986]. This model abandons ... sound conceptual model is the design concept of a desktop. ..... most effectively and have the user understand it best. Graphical ...
Dec 22, 2008 - give a user query suggestions, thus improving the precision of her/his search. Click-through data is, usually, the ... Query Spelling Correction.
Entropy-biased Models for Query Representation ... - Semantic Scholar
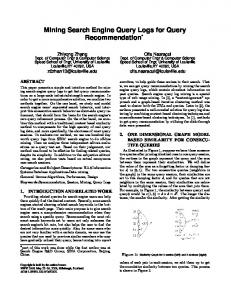
Figure 1: Example of a click graph. ies mined the logs to improve numerous search engine’s capabilities, such as query suggestion and classification, ranking, targeted advertising, etc. The click graph [5], a bipartite graph between queries and URLs, is an important technique for describing the information contained in the query logs, in which edges connect a query with the URLs that were clicked by users as a result. An example of a click graph with 4 queries and 4 URLs is depicted in Fig. 1. The edges of the graph can capture some semantic relations between queries and URLs. For example, queries “map” and “travel” are related to each other, since they are co-clicked with some URLs such as “www.mapquest.com” and so on. Therefore, how to utilize and model the click graph to represent queries becomes an interesting and challenging problem. Traditionally, the edge of the click graph is weighted based on the raw click frequency (number of clicks) [5] from a query to a URL. The transition probability can be further determined by the normalized click frequency [18, 15]. Taking the edge from “map” to “www.mapquest.com” in Fig. 1 as an example, the raw click frequency is 10 and the normalized click frequency is 10/22. However, the traditional query representation for the click graph has its own disadvantages. One of these disadvantages is its robustness, i.e., a query that has a skewed click count on a certain URL may exclusively influence the click graph, such as navigational queries. In order to avoid the adverse effect on learning algorithms, previous work presented in [14] simply identified some navigational queries and removed them from the click graph. Unfortunately, the deletion of such queries leads to the loss of some information. Another related problem is that the raw click frequency can be easily manipulated as it is prone to spam by some malicious clicks. To deal with these critical problems, we explore a novel entropy-biased framework which incorpo-
Categories and Subject Descriptors: H.3.3 [Information Storage and Retrieval]: Information Search and Retrieval—retrieval models, query formulation General Terms: Algorithms, Experimentation Keywords: Entropy-biased model, click graph, click frequency, inverse query frequency, user frequency
1.
q
Yahoo
2
Query log analysis has received substantial attention in recent years, in which the click graph is an important technique for describing the relationship between queries and URLs. State-of-the-art approaches based on the raw click frequencies for modeling the click graph, however, are not noise-eliminated. Nor do they handle heterogeneous queryURL pairs well. In this paper, we investigate and develop a novel entropy-biased framework for modeling click graphs. The intuition behind this model is that various query-URL pairs should be treated differently, i.e., common clicks on less frequent but more specific URLs are of greater value than common clicks on frequent and general URLs. Based on this intuition, we utilize the entropy information of the URLs and introduce a new concept, namely the inverse query frequency (IQF), to weigh the importance (discriminative ability) of a click on a certain URL. The IQF weighting scheme is never explicitly explored or statistically examined for any bipartite graphs in the information retrieval literature. We not only formally define and quantify this scheme, but also incorporate it with the click frequency and user frequency information on the click graph for an effective query representation. To illustrate our methodology, we conduct experiments with the AOL query log data for query similarity analysis and query suggestion tasks. Experimental results demonstrate that considerable improvements in performance are obtained with our entropy-biased models.
INTRODUCTION
Recently query log analysis has been studied widely for improving search engines’ efficacy and usability. Such stud-
Permission to make digital or hard copies of all or part of this work for personal or classroom use is granted without fee provided that copies are not made or distributed for profit or commercial advantage and that copies bear this notice and the full citation on the first page. To copy otherwise, to republish, to post on servers or to redistribute to lists, requires prior specific permission and/or a fee. SIGIR’09, July 19–23, 2009, Boston, Massachusetts, USA. Copyright 2009 ACM 978-1-60558-483-6/09/07 ...$5.00.
339
rates raw click frequencies and other information with the entropy information of the connected URLs. The basic idea of the entropy-biased model is that various query-URL pairs should be treated differently. Let us look at the query “map” (q2 ) and its connected URLs, which is shown in Fig. 1. The click frequency from q2 to d3 is the same as the count (10) from q2 to d1 . There is a critical question when only consider the raw click frequency: Is a single click on different URLs in the click graph equally important? Clearly not! In this case, at an intuitive level, one click on d3 may capture more meaningful information, or be more important than one click on d1 . The key difference is that the connected URLs are different: One URL is “www.mapquest.com”, which is connected with 2 queries; while another URL is “www.yahoo.com”, which is connected with 3 queries. Before performing a theoretical analysis, we first briefly review the entropy and information theory [23]. Suppose there is a URL which is commonly clicked and connected with most of the queries (with equal probability), this tends to increase the ambiguity (uncertainty) of the URL. However, if the URL is clicked and connected with fewer queries, this tends to increase the specificity of the URL. A frequently clicked URL thus functions in retrieval as a nonspecific URL, even though its meaning may be quite specific in the ordinary sense. Therefore, a single click on a specific URL is most likely to be more important for distinguishing the specificity of the query than another click on an ambiguous URL. Based on the above intuition, we introduce a new concept, denoted as the inverse query frequency, to weigh the importance of a click on a certain URL, which can be extended and used for other bipartite graphs. Consequently, we propose a novel entropy-biased model, namely CF-IQF model, to represent the query, which simultaneously combines the inverse query frequency information with the raw click frequency. As the raw click frequency can be easily manipulated, we develop and use the number of users associated with the query-URL pair, namely the user frequency (UF model), instead of the raw click frequency (CF model) to improve the resistance against malicious click data. Moreover, the inverse query frequency can be incorporated with the user frequency, as another entropy-biased UF-IQF model, to achieve better performance. To illustrate our methodology, we apply the entropy-biased models to query similarity analysis and query suggestion tasks using the real-world AOL query log data. The main concern is to increase the precision of the top-n retrieved results. For the query similarity analysis, we compare six different models, including four models (CF, CF-IQF, UF and UF-IQF) based on the click graph and two models (TF and TF-IDF) based on the query terms. It is shown that CF-IQF model improves over CF model by up to 6.12%, while UF-IQF over UF by up to 5.5%. As expected, UF-IQF and UF outperform CF-IQF and CF respectively. In addition, UF-IQF model significantly improves the traditional TF-IDF model by up to 21.89%. For the query suggestion task, evaluation results also show that the entropy-biased models outperform the baseline models, indicating that the improvements in our proposed models are consistent and promising. In a nutshell, our contributions of this paper are: (1) the introduction of a new notion, namely the inverse query frequency, to weigh the importance of a click on a certain URL, which can be extended and used for other bipartite graphs; (2) the identification of a new source, called the user fre-
quency, for diminishing the manipulation of the malicious clicks; (3) the framework of the entropy-biased model for the click graph, which simultaneously combines the inverse query frequency with the click frequency and user frequency information; and (4) the first formal model to distinguish the variation on different query-URL pairs in the click graph. The rest of this paper is organized as follows. We briefly review some related work on query log analysis in Section 2. In Section 3 we present the proposed query representation models. Section 4 describes two basic applications of these models, which are the query similarity analysis and query suggestion. We then describe and report the experimental evaluation in Section 5. Finally, we present our conclusions and future work in Section 6.
2. RELATED WORK With the advance of search technologies, many approaches have been proposed to utilize and analyze query logs to enhance the search results in various aspects. A common model for utilizing query logs from search engines is in the form of a click graph [5]. Based on the click graph, many research efforts in query log analysis have been devoted to query clustering [3, 26], query suggestion [13, 15], query classification [14] and user behavior understanding [19, 6, 4, 9]. The use of the click data for query clustering has been suggested by Befferman and Berger [3], who proposed an agglomerative clustering technique to identify related queries and Web pages. Wen et al. [26] combined query content information and click-through information and applied a density-based method to cluster queries. Craswell and Szummer [5] used click graph random walks for relevance rank in image search. Mei et al. [15] proposed an approach to query suggestion by computing the hitting time on a click graph. [14] presented the use of click graphs in improving query intent classifiers. These methods are proposed based on the click graph, while our objective is to investigate a better model to utilize and represent the click graph. There are several approaches that have tried to model the representation of queries or documents on the click graph. Baeza-Yates et al. [1] used the content of clicked Web pages to define a term-weight vector model for a query. They considered terms in the URLs clicked after a query. Each term was weighted according to the number of occurrences of the query and the number of clicks of the documents in which the term appeared. In [2], the authors introduced another vectorial representation for the queries without considering the content information. Queries were represented as points in a high dimensional space, where each dimension corresponds to a unique URL. The weight assigned to each dimension was equal to the click frequency. This is one of the traditional click frequency models. Moreover, Poblete et al. [17] proposed the query-set document model by mining frequent query patterns to represent documents rather than the content information of the documents. However, these existing methods do not distinguish the variation on different query-URL pairs. Besides, there is a trend to explore the query logs and model queries with variation for personalization [8, 24]. Dou et al. [8] explored click entropy to measure the variability in click results, while Teevan et al. [24] proposed result entropy to capture how often results change. In this paper, we also utilize the entropy information of the URL. Other methods are focused on personalization for different queries, while
340
our proposed entropy-biased models are different, which are focused on the weighting scheme of various query-URL pairs. This work is also related to the term frequency inverse document frequency (TF-IDF) model [12, 22], which has a significant effect in the information retrieval field. Our proposed method shares the key point to identify and tune the importance of a query-URL edge as TF-IDF for a term. The major difference is that the TF-IDF model is applied to find the term weight in a document, while our entropybiased models are employed to identify the edge weight of the click graph, which can also be applied to other bipartite graphs without the content information.
3.
Symbol C cij ufij n(dj ) idf (dj ) p(dj |qi ) p(qi |dj ) Pq2d Pd2q
Table 1: Table of Notation. Meaning M × N query-URL matrix Click frequency between query qi and URL dj , with the entry (i, j) of the matrix C User frequency between qi and dj Number of queries associated with URL dj Importance of a certain URL dj Transition probability from qi to dj Transition probability from dj to qi An M × N query-URL probability matrix An N × M URL-query probability matrix
QUERY REPRESENTATION MODELS number of clicks for qi . The notation p(qi |dj ) denotes the transition probability from the URL dj to the query qi ,
As stated above, the issue of how to represent queries based on the click graph is critical to the task of effectively analyzing query logs. In this section, we first introduce the preliminaries and notations, and then investigate and explore the query representation models for the click graph.
p(qi |dj ) =
cij , cf (dj )
(2)
P where cf (dj ) = i∈Q cij , and it denotes the aggregated number of clicks for the URL dj . Although the click frequency cij is the same, the transition probabilities p(qi |dj ) and p(dj |qi ) are generally not symmetric because of the various normalization. If there is no edge between qi and dj , the transition probability is equal to 0. After calculating all these transition probabilities, we obtain two kinds of matrices: Pq2d ∈ RM ×N and Pd2q ∈ RN×M . Taking the click graph of Fig. 1 as an example, we can get the transition matrix Pq2d as shown in Table 2(b). Without considering the content information, the query qi can be represented by a vector of documents weighted as the → i-th row of the matrix Pq2d : − qi = hPq2d (i, 1), ..., Pq2d (i, N )i, and meanwhile the document dj can be represented by a vector of queries weighted as the j-th row of the matrix → − Pd2q : dj = hPd2q (j, 1), ..., Pd2q (j, M )i. After vectorization, it can be used to measure the similarity between queries and applied to other query log analysis. According to Table 2(b), for example, the most similar queriy of q2 (“map”) is q1 (“Yahoo”) using the cosine similarity.
3.1 Preliminaries and Notations Let Q = {q1 , q2 , ..., qM } be the set of M unique queries submitted to a search engine during a specific period of time. Let D = {d1 , d2 , ..., dN } be the set of N URLs clicked for those queries. A click graph is a query-URL bipartite graph G = (Q ∪ D, E) where every edge in E connects a vertex in the query set Q and one in the URL set D. For q ∈ Q and d ∈ D, the pair (q, d) is an edge of E if and only if there is a user who clicked on URL d after submitting the query q. For each edge (qi , dj ) ∈ E, we associate a numeric weight cij , known as the click frequency, that measures the number of times the URL dj was clicked when shown in response to the query qi . Let C be an M × N matrix, whose M rows correspond to the queries of Q and whose N columns correspond to the URLs of D, and the entry (i, j) contains a value cij . The click frequency matrix of Fig. 1 is shown in Table 2(a). Let U = {u1 , u2 , ..., uK } be the set of K users who submitted the queries and clicked on the URLs. Now, a query instance can be made up of one or more hq, d, ui triples. It is obvious that every edge (qi , dj ) in the click graph has a set of users associated with it, so we introduce a new notion ufij , referred to as the user frequency, that measures the total number of users who submitted the query qi and clicked on the URL dj . This measurement can be a good supplement of the click frequency for a robust query representation. To further explore the information of query logs, we aggregate the number of queries that are connected with a URL dj and use n(dj ) to denote it. Some other notations are briefly shown in Table 1, and will be defined in the following subsections.
3.3 Entropy-biased Model The CF model only considers the raw click frequency, and treats different query-URL pairs equally even if some URLs are very heavily clicked. More generally, a great variation in URL distribution is likely to appear, and it may thus cause the loss of important information since different query-URL pairs are not sufficiently distinguished. For example, the click frequency c21 is equal to c23 in Fig. 1. However, it may be more reasonable to weight these two edges differently because of the variation of the connected URLs. In this paper, we define int(q, d) to be true when the query q has clicks on d at least once. Let n(dj ) be the total number of queries (query frequency) that are connected with the URL dj , which is defined as X n(dj ) = 1int(qi ,dj ) .
3.2 Click Frequency Model Traditionally, the edge of the click graph is weighted by the raw click frequency between a query and a URL, which we call click frequency (CF) model. Given qi ∈ Q and dj ∈ D, the transition probability [5, 18, 15] from the query qi to the URL dj is defined by normalizing the click frequency from the query qi as cij , (1) p(dj |qi ) = cf (qi ) P where cf (qi ) = j∈D cij , and it denotes the aggregated
i∈Q
It is predicted that the more general and highly ranked URL would be clicked and connected with more queries than the specific URLs. Thus the less specific URLs would have a larger collection distribution than the more specific ones, which tends to increase the ambiguity and uncertainty of
341
Table 2: Matrix representation for the example click graph. (b) CF transition probabilities (c) CF-IQF transition probabilities (a) Click frequency matrix C q1 q2 q3 q4
d1 50 10 5 0
d2 5 2 2 2
d3 0 10 5 0
d4 0 0 10 10
Pq2d q1 q2 q3 q4
d1 0.909 0.455 0.227 0
d2 0.091 0.091 0.091 0.167
d3 0 0.455 0.227 0
d4 0 0 0.455 0.833
′ Pq2d q1 q2 q3 q4
d1 1 0.293 0.122 0
d2 0 0 0 0
d3 0 0.707 0.293 0
d4 0 0 0.586 1
the URLs in the ordinary sense. Using information theory, the entropy [23] of a URL dj is defined as X E(dj ) = − p(qi |dj ) log p(qi |dj ). (3) i∈Q
Suppose that the URL dj is connected with those queries with equal probability p(qi |dj ) = n(d1 j ) , the maximum entropy is transformed to E(dj ) = log n(dj ).
(4)
Generally, the entropy of the URL tends to be proportional to the query frequency n(dj ). In order to simplify the calculation, we roughly use the maximum entropy to approximate the exact entropy in the following analysis. It is argued that the discriminative ability of a URL should be inversely proportional to the entropy, hence a (heavilyclicked) URL with a high query frequency is less discriminative overall. This motivates us to propose a novel and important concept, referred to as the inverse query frequency, to measure the discriminative ability of the URL dj . Suppose |Q| is the total number of queries in the query log, the inverse query frequency for the URL dj is defined as, iqf (dj ) = log |Q| − log n(dj ) = log
|Q| , n(dj )
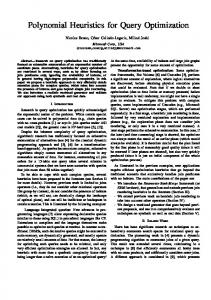
Figure 2: The surface specified by the click frequency, query frequency and cfiqf, with color specified by the cfiqf value. The color is proportional to the surface height. hence such weights tend to diminish the influence of heavilyclicked URLs. The new transition probability from qi to dj becomes
(5)
p′c (dj |qi ) =
which is similar to the inverse document frequency for the term [12]. The inverse query frequency factor has several benefits. The most important one is that it can constrain and diminish the influence of some heavily-clicked URLs. This will tend to balance the inherent bias of clicks for those highly ranked URLs [6]. Furthermore, the inverse query frequency can be incorporated with other factors to tune the representation models as shown in the following subsections.
(7)
P where cf iqf (qi ) = The new matrix j∈D cf iqf (qi , dj ). ′ Pq2d of Fig. 1 is shown in Table 2(c). Based on this matrix, it can be calculated that the most similar query of q2 (“map”) is q3 (“travel”), which is more reasonable than the result of CF model. Currently, we only consider changing the transition probability from the query to the URL, and keeping the transition probability p(qi |dj ) from the URL to the query as the same as that of CF model.
3.3.1 CF-IQF Model In the entropy-biased model, we incorporate the inverse query frequency with the raw click frequency in a unified CF-IQF model, namely cf iqf (qi , dj ) = cij · iqf (dj ).
cf iqf (qi , dj ) , cf iqf (qi )
3.3.2 UF Model and UF-IQF Model Another drawback of the CF model is that it is prone to spam by some malicious clicks, and it can be easily influenced by a single user if he/she clicked on a certain URL thousands of times. To address the problem, we introduce a new concept user frequency (UF), which denotes the number of users associated with the query-URL pair, instead of the click frequency, to improve the resistance against malicious click data. Let int(qi , dj , uk ) to be true if a user uk submitted the query qi and clicked on the URL dj at least once, then the user frequency ufij is defined as X uij = 1int(qi ,dj ,uk ) .
(6)
The intuition behind the CF-IQF model is that query-URL pairs are treated differently according to the inverse query frequency, so that the common clicks on less frequent yet more specific URLs are of greater value than the common clicks on frequent URLs. Figure 2 shows the surface specified by the click frequency, query frequency, cf iqf , with color specified by the cf iqf value. The color is proportional to the surface height. A high weight cf iqf is reached by a high click frequency for the query-URL pair and a low query frequency associated with the URL in the whole query log. As shown in Fig. 2, the query-URL pair A, which has the same click frequency with B, will be weighted much higher than B because of the associated inverse query frequency,
k∈U
Based on the user frequency, we can obtain UF model similar to CF model. Intuitively, UF model reinforces the capability of diminishing the effect of some manipulated clicks.
342
4.2 Graph-based Random Walk Model
To further distinguish the performance of the model, we also incorporate the user frequency with the inverse query frequency in a unified UF-IQF model, uf iqf (qi , dj ) = ufij · iqf (dj ).
In previous studies [5, 18, 15], the click graph has been thought of as a random walk between queries and URLs according to the transition probabilities Pq2d and Pd2q . To consider the vertices in one side, such as the query-to-query graph, then a new random walk can be introduced by the transition probability from qi to qj , X p(qj |qi ) = p(dk |qi )p(qj |dk ). (12)
(8)
With Eq. 8, the transition probability from qi to dj becomes p′u (dj |qi ) = where uf iqf (qi ) =
P
j∈D
uf iqf (qi , dj ) , uf iqf (qi )
(9)
uf iqf (qi , dj ).
k∈D
We use Pq2q to denote the transition matrix whose entry (i, j) has the value p(qj |qi ). It is important to note that the self-transition probability exists naturally in the model. The personalized PageRank [11, 10] is the steady-state distribution of the random walk, which is usually used to rank vertices on the graph in a query dependent way. The corresponding linear system of personalized PageRank can be shown as: X (0) Rjn+1 = (1 − α)Rj + α · p(qj |qi )Rin , (13)
3.4 Connection with Other Methods In this subsection, we establish the connection between our entropy-biased model and the famous TF-IDF model [12, 22]. Over the years, the weighting scheme TF-IDF has been extensively and successfully used in the vector space model for text retrieval. Several researchers [20, 7, 21] have tried to interpret IDF based on binary independence retrieval, Poisson, information entropy and language modeling. Although the success of the TF-IDF in the text mining is widely claimed, it has never been explored to bipartite graphs. The idea of measuring the discriminative ability of the URL by IQF is totally new, and it can be expected to produce the similar effects on click graphs as IDF on text mining. Moreover, our entropy-biased model is employed to identify the edge weighting of the click graph, which can also be applied to other bipartite graphs without the content information. As the query can also be represented by the vector of terms using TF and TF-IDF models, we will compare the performance of these two models with our proposed models in Section 5.3.
4.
i (0)
where Rj is a personalized (or query dependent) initial values for vertex j, and n is the steps of a random walk. We (0) may set Rj = 1 if vj is the given query and 0 otherwise. The parameter α is usually set to be 0.7 in previous studies. Since the objective is to show the effectiveness of our proposed models for query suggestion, we present the query suggestions ranked by personalized PageRank in Section 5.4.
5. EXPERIMENTAL EVALUATION
MINING QUERY LOG ON CLICK GRAPH
The proposed query representation models can be applied to mine the query log in many cases, such as query-to-query similarity, query clustering, query suggestion, etc. For the comparison of different models, we focus on two tasks: (1) the fundamental query-to-query similarity analysis, which is very suitable for evaluating the performance of the proposed query representation models, and (2) the popular query suggestion task, which is to find semantically related queries for a given query using the graph-based random walk model.
5.1 Data Collection and Analysis The dataset that we study is adapted from the query log of AOL search engine [16]. The entire collection consists of 19, 442, 629 user click-through records. These records contain 10, 154, 742 unique queries and 1, 632, 789 unique URLs submitted from about 650, 000 users over three months (from March to May 2006). As shown in Table 3, each record of the click contains the same information: UserID, Query, Rank and ClickURL (we do not show the Time properties due to the limited space). This dataset is the raw data recorded by the search engine, and contains a lot of noises. Hence, we conduct a similar method employed in [25] to clean the raw data. We clean the data by removing the queries that appear less than 2 times, and by combining the near-duplicated queries which have the same terms without the stopwords and punctuation marks (for example, “google’s image” and “google image” will be combined as the same query). After cleaning, we get totally 883, 913 queries and 967, 174 URLs in our data collection. After the construction of the click graph, we observe that a total of 4, 900, 387 edges exist, which indicates that each query has 5.54 distinct clicks, and each URL is clicked by 5.07 distinct queries. Moreover,
4.1 Query-to-Query Similarity Measurement As the query can be represented by a vector of documents (or a vector of terms), two common similarity measurements will be used to calculate the similarity between queries: one is the cosine similarity and the other is the Jaccard coefficient. The cosine similarity is a measure of similarity between two vectors by finding the angle θ between them. It is represented using a dot product and magnitude as → − → qi · − qj , (10) Cos(θ) = − → → k q kk − q k i
j
− where → qi denotes the vector of a query. The Jaccard coefficient is defined as the value of the intersection divided by the value of the union of the query vectors: P |Pq2d (i, n) ∩ Pq2d (j, n)| → → , (11) J(− qi , − qj ) = Pn∈N n∈N |Pq2d (i, n) ∪ Pq2d (j, n)| → where P (i, n) denotes the n-th value of − q . We report and q2d
In the following experiments we compare our proposed models with other methods on the tasks of mining query logs through an empirical evaluation. We define the following task: Given a query and a click graph, the system has to identify a list of queries which are most similar or semantically relevant to the given query. In the rest of this section, we introduce the data collection, the assessments and evaluation metrics, and present the evaluation results.
i
analyze the query similarity results in Section 5.3.
343
Table 4: Comparison of different methods by P@1 and P@10. We also show the percentage of relative improvement in the lower part.
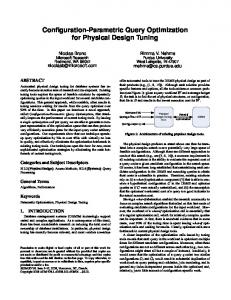
Figure 3: The distributions of the (a) click frequency, (b) user frequency and (c) query frequency. taken as a whole, this data collection has 250, 127 unique terms which appear in all the queries. It has been shown in [2] that the occurrences of queries and the clicks of URLs exhibit a power-law distribution. However, the properties of the user frequency and query frequency have not been well explored. Fig. 3 shows the distributions of the click frequency (cij ) and the user frequency (ufij ) associated with the query-URL edges, and the query frequency (n(dj )) associated with the URLs. All of them exhibit power-law distributions in the figure.
It is difficult to evaluate the quality of query similarity/relevance rankings due to the scarcity of data that can be examined publicly. For an automatic evaluation, we utilize the same method used in [2] to evaluate the similarity of retrieved queries, but engage the Google Directory1 instead of the Open Directory Project2 . When a user types a query in Google Directory, besides site matches, we can also find category matches in the form of paths between directories. Moreover, these categories are ordered by relevance. For instance, the query “United States” would provide the hierarchical category “Regional > North America > United States”, while one of the results for “National Parks” would be “Regional > North America > United States > Travel and Tourism > National Parks and Monuments”. Hence, to measure how similar two queries are, we can use a notion of similarity between the corresponding categories provided by the search results of Google Directory. In particular, we measure the similarity between two categories Cai and Car as the length of their longest common prefix P (Cai , Car ) divided by the length of the longest path between Cai and Car . More precisely, the similarity is defined as:
where Sim(qi , qr ) means the similarity between qi and qr . In our experiments, we report the precision from P @1 to P @10, and take the average over all the 300 distinct queries.
5.3 Query Similarity Analysis We consider the question whether our proposed method can boost the performance using the entropy-biased models for the fundamental query similarity analysis tasks. We compare six different models, including four models (CF, CF-IQF, UF and UF-IQF) based on the click graph and two models (TF and TF-IDF) based on the query content information, and report the precisions from P @1 to P @10 in Fig. 4 using two similarity measurements. In this figure we can see, as expected, that our proposed entropy-biased CFIQF model outperforms the CF model in all the metrics from P @1 to P @10. Similarly to what happens between the CFIQF and CF models, the performance of the UF-IQF model is better than that of the UF model. The results support our intuition of the entropy-biased framework about treating various query-URL pairs differently. When comparing the results of UF with CF, and the results of UF-IQF with CF-IQF, we can observe that the UF and UF-IQF models perform better than the CF and CF-IQF models respectively, which indicates the user frequency associated with the query-URL pair is more robust than the click frequency for modeling the click graph. We also compare our models with the TF and TF-IDF models to see whether the improvements of CF-IQF and UF-IQF over CF and UF models are consistent with the
Sim(Cai , Car ) = |P (Cai , Car )|/ max(|Cai |, |Car |), (14) where |Cai | denotes the length of a path. For instance, the similarity between the above two queries is 3/5 since they share the path “Regional > North America > United States” and the longest one is made of five directories. We evaluate the similarity between two queries by measuring the simi2
larity between the aggregated categories of the two queries, among the top 5 answers provided by Google Directory. To give a fair assessment, we randomly select 300 distinct queries from the data collection, then retrieve a list of similar queries using the proposed methods for each of these queries. For the evaluation of the task, we adopt the precision at rank n to measure the relevance of the top n results of the retrieved list with respect to a given query qr , which is defined as Pn i=1 Sim(qi , qr ) P @n = , (15) n
Figure 4: The performance comparison of six models (CF, CF-IQF, UF, UF-IQF, TF and TF-IDF models) using two different similarity measurements. improvement of the TF-IDF over TF model. According to Fig. 4, it is obvious that the TF-IDF model improves the performance of the TF model, with the same observations of our entropy-biased models. The reason is that they share the same key point to identify and tune the importance of a term or a query-URL edge. The major difference is that the TF-IDF model is used to find the weight value of a term in a document, which has a significant effect in the information retrieval field. However, our entropy-biased models are applicable in identifying the weight of the edge for the click graph, which can be extended to other bipartite graphs without the content information. To gain a better insight into the details of the results, we show the comparison of different models using P @1 and P @10 in Table 4. The first part shows the absolute precisions of those models, and the second part illustrates the percentage of relative improvements. A quick scan of the first part, accompanying with Fig. 4, reveals that UF-IQF achieves the best performance in most cases. When looking at the relative improvements of those models (the top four lines of the lower part), we can see that CF-IQF improves over CF by up to 6.12%, UF-IQF over UF by up to 5.5%, and UF-IQF over CF by up to 6.51%. While TF-IDF improves over TF by up to 9.79% for P @10 using Jaccard coefficient, this is because the precision of TF is much lower than other methods, which can be easily be improved. In terms of the final four lines in Table 4, another interesting comparison is seen between the proposed models on the click graph and the traditional models on the query content information. Based on the click graph, CF and UF models improve the traditional TF model significantly from 9.76% to 30.02%, while CF-IQF and UF-IQF models also improve the traditional TF-IDF model from 8.44% to 21.89%. The results reconfirm many previous studies [2, 19] that the click graph catches more semantic relations between queries than the query terms. According to the experimental results, we can argue that it is very essential and promising to consider the entropy-biased models for the click graph. To test the sensitivity of the similarity measurement of our entropy-biased models, we compare the results of the Jaccard coefficient, and find that the improvements are consistent with the cosine similarity, which indicates that our entropy-biased models are independent of the similarity measurements. In addition, we notice that Jaccard coefficient performs better than cosine similarity using CF, CF-IQF,
Table 5: Examples of query suggestions generated by two different models on click graph. CF model
CF-IQF model
Query = aa american airlines american airlines alcoholics anonymous alcoholics anonymous aa.com aa.com airlines airlines Query = east texas real estate google east texas acreage east texas acreage tyler real estate texas real estate tyler texas realtors tyler real estate texas real estate Query = home gym equipment home gyms home gyms gym equipment gym equipment treadmills treadmills buy.com edge 329 upright exercise bike
UF and UF-IQF models on the click graph, while cosine similarity is better than Jaccard coefficient using TF and TF-IDF models on the query content information.
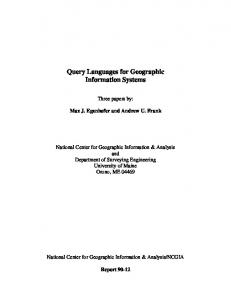
5.4 Random Walk Evaluation In this subsection, we present the comparison of suggestions generated using the same random walk method with CF and CF-IQF models (we do not show the comparison of UF and UF-IQF models due to space constraints and similar results). To better understand the improvements of our entropy-biased models, we evaluate the performance of our methods with different number of steps (from 2 to 50). Figure 5 illustrates the precisions (P @10) of CF and CF-IQF models for different parameter n. With the increase of n, both models improve their performance, which can also converge quickly after about 10 steps. As shown in Fig. 5, it is very clear that the CF-IQF model always performs better than the CF model. We selectively show the detailed results ranked by the transition probabilities in Table 5. In general, the top-4 suggestions generated by the CF model and the CF-IQF model are similar, and mostly semantically relevant to the original query. For the first example in Table 5, these two models generate the same suggestions, since the transition probabilities in both models are usually similar. From these suggested
345
ated with the Microsoft-CUHK Joint Laboratory for HumanCentric Computing and Interface Technologies.
Average precision (P@10)
0.35 0.345
8. REFERENCES
0.34
[1] R. A. Baeza-Yates, C. A. Hurtado, and M. Mendoza. Query recommendation using query logs in search engines. In EDBT Workshops, pages 588–596, 2004. [2] R. A. Baeza-Yates and A. Tiberi. Extracting semantic relations from query logs. In KDD, pages 76–85, 2007. [3] D. Beeferman and A. L. Berger. Agglomerative clustering of a search engine query log. In KDD, pages 407–416, 2000. [4] M. Bilenko and R. W. White. Mining the search trails of surfing crowds: identifying relevant websites from user activity. In WWW, pages 51–60, 2008. [5] N. Craswell and M. Szummer. Random walks on the click graph. In SIGIR, pages 239–246, 2007. [6] N. Craswell, O. Zoeter, M. Taylor, and B. Ramsey. An experimental comparison of click position-bias models. In WSDM, pages 87–94, 2008. [7] A. P. de Vries and T. R¨ olleke. Relevance information: a loss of entropy but a gain for idf? In SIGIR, pages 282–289, 2005. [8] Z. Dou, R. Song, and J.-R. Wen. A large-scale evaluation and analysis of personalized search strategies. In WWW, pages 581–590, 2007. [9] G. Dupret and B. Piwowarski. A user browsing model to predict search engine click data from past observations. In SIGIR, pages 331–338, 2008. [10] T. Haveliwala, S. Kamvar, and G. Jeh. An analytical comparison of approaches to personalizing PageRank. Preprint, June, 2003. [11] G. Jeh and J. Widom. Scaling personalized web search. In WWW, pages 271–279, 2003. [12] K. S. Jones. A statistical interpretation of term specificity and its application in retrieval. Journal of Documentation, 28(1):11–21, 1972. [13] R. Jones, B. Rey, O. Madani, and W. Greiner. Generating query substitutions. In WWW, pages 387–396, 2006. [14] X. Li, Y.-Y. Wang, et al. Learning query intent from regularized click graphs. In SIGIR, pages 339–346, 2008. [15] Q. Mei, D. Zhou, and K. W. Church. Query suggestion using hitting time. In CIKM, pages 469–478, 2008. [16] G. Pass, A. Chowdhury, and C. Torgeson. A picture of search. In Infoscale, page 1, 2006. [17] B. Poblete and R. A. Baeza-Yates. Query-sets: using implicit feedback and query patterns to organize web documents. In WWW, pages 41–50, 2008. [18] B. Poblete, C. Castillo, and A. Gionis. Dr. searcher and Mr. browser: a unified hyperlink-click graph. In CIKM, pages 1123–1132, 2008. [19] F. Radlinski and T. Joachims. Active exploration for learning rankings from clickthrough data. In KDD, pages 570–579, 2007. [20] S. Robertson. Understanding inverse document frequency: on theoretical arguments for IDF. Journal of Documentation, 60:503–520, 2004. [21] T. Roelleke and J. Wang. Tf-idf uncovered: a study of theories and probabilities. In SIGIR, pages 435–442, 2008. [22] G. Salton and C. Buckley. Term-Weighting Approaches in Automatic Text Retrieval. Information Processing and Management, 24(5):513–23, 1988. [23] C. E. Shannon. Prediction and entropy of printed english. The Bell System Technical Journal, 30:50–64, 1950. [24] J. Teevan, S. T. Dumais, and D. J. Liebling. To personalize or not to personalize: modeling queries with variation in user intent. In SIGIR, pages 163–170, 2008. [25] X. Wang and C. Zhai. Learn from web search logs to organize search results. In SIGIR, pages 87–94, 2007. [26] J.-R. Wen, J.-Y. Nie, and H. Zhang. Clustering user queries of a search engine. In WWW, pages 162–168, 2001.
0.335 0.33 0.325 0.32
CF CF−IQF 2
3
5 10 20 The steps (n) of a random walk
50
Figure 5: The performance of random walk model. results, we see that our models not only capture the most common sense, the “american airline”, they also successfully predict infrequent query “alcoholics anonymous” as suggestion. After looking into the last two examples, one important observation is that our CF-IQF model can boost more relevant queries as suggestion and reduce some irrelevant queries. To see the suggestions for “east texas real estate”, for example, we notice that the first suggestion “google”, provided by the CF model, is irrelevant to the original query. This is because there is a edge between the query “east texas real estate” and a heavily-clicked URL “www.google.com”, which are highly associated with the query “google” so as to generate the high transition probability from “east texas real estate” to “google”. In the last example, the irrelevant suggestion “buy.com” in the CF model arises from the similar reason. Comparing with the CF model, the CF-IQF model can successfully constrain such irrelevant queries and return mostly relevant suggestions (e.g., upright exercise bike), because it reduces the adverse factor in such situations by considering the inverse query frequency in the click graph.
6.
CONCLUSIONS AND FUTURE WORK
In this paper we present the novel entropy-biased models for click graphs, whose basic idea is to treat various query-URL pairs differently according to the inverse query frequency. Although its fundamental concept is very simple, the IQF weighting scheme is never explicitly explored or statistically examined for any bipartite graphs in the information retrieval literature. We not only formally define and quantify this scheme, but also propose the new entropybiased framework to incorporate it on the click graph for an effective query representation. We apply proposed models to mine the query log and compare with the baseline models in two popular tasks. Experimental results show that the improvements of our proposed models are consistent and promising. In future work, it would be interesting to apply this entropy-biased model to identify some noise click data. Furthermore, we would like to investigate the performance of our model in other bipartite graphs to see if the proposed method might have an impact on any bipartite graphs.
7.
ACKNOWLEDGMENTS
The authors would like to thank Lei Zhang for the discussion and comments, and the anonymous reviewers for many helpful comments on the manuscript. This work is supported by two grants from the Research Grants Council of the Hong Kong SAR, China (Project No. CUHK4128/08E and Project No. CUHK4158/08E). This work is also affili-