envlp: A MATLAB Toolbox for Computing Envelope Estimators in ...
Recommend Documents
MATLAB code, ranging from a full-blown Message-Passing Interface (MPI) to a simple ... This code is inherently embarrassingly parallel. .... Start the timer tic;.
May 14, 2010 - Here, we have developed a MATLAB toolbox called Data ... Imaging and Communications in Medicine (DICOM) files and click a few buttons to ...
For instance, the Schrödinger's Cat Theory says that the quantum state of a photoncan basically be in more than one place in the same time, which means that ...
Email: [email protected]. Jesús Liceaga-Castro .... transformation, then the closed loop with negative feedback is stable if and only if the ...
Due to the strong link between theory and practice in speech communication ... We introduce the PhaseLab Toolbox, comprising the MATLAB® implementations ...
Jun 12, 2009 ... parallel genetic algorithm-based design of a MIMO controller. Parallel genetic
algorithms (PGA) ... Keywords: Matlab Parallel Computing toolbox, parallel
genetic algorithms, MIMO controller design ... Po-We-9, 098.pdf. 277 ...
Here we present a Matlab/Octave toolbox for the application of GSA, called SAFE ... 2014), and the Python Sensitivity Analysis Library SALib (Herman,. 2014).
Approximate processing times measured using a conventional computer (Intel ... Unzip the file SIMToolbox.zip with the toolbox into your working directory. It ... has a different arrangement, you can use an option prepare directory which allows to ...
Jul 21, 2014 - PSYCHOACOUSTICS is a new MATLAB toolbox which implements three classic ...... authors (Communication Disorders Technologies Inc.).
Mar 15, 2018 - DynaSim is an open-source MATLAB/GNU Octave toolbox for rapid prototyping of ...... In contrast, comprehensive python-based solutions.
Abstract: A new CAD tool: the CRONE Matlab toolbox, is presented for engineers and researchers in mathematics and engineering sciences, particularly for ...
documented website under a GNU-GPL license, our aim is ... initial feature design step. 1. ..... are simple template-based approaches, referred to as Tb and.
May 15, 2015 - Here we present a Matlab/Octave toolbox for the application of GSA, called SAFE ... effective investigation and communication of GSA results.
See release notes on page 58. Readers are assumed to be familiar with Matlab
and should have a basic understanding of field of statistical pattern recognition.
PL #5 – MatLab Neural Networks Toolbox. Alexandra Moutinho. Example #1
Create a feedforward backpropagation network with a hidden layer. Here is a ...
PL #2 – MatLab Fuzzy Toolbox. Alexandra Moutinho. Problem: You are driving a
car A on a highway. You want to keep a safe distance to car B in front of you.
Apr 22, 2003 - inference system, and/or a checking data set that helps with model overfitting .... http://www.mathworks.com/access/helpdesk/help/toolbox/.
Feb 10, 2016 - The following is taken from the Matlab Image Processing Toolbox users guide. A complete online ... image processing algorithms. You can view ...
Apr 22, 2003 - Using a given input/output data set, the toolbox function ... This learning method works similarly to that of neural networks. ... load demo data.
introduction of this Matlab Toolbox, different FRI methods can be used for
different real ... [6] (Bouchon-Meunier, Marsala, and Rifqi), and VKK method [7] (
Vass ...
sensing, video communication, biomedical, transportation system. ... mathematical modelling and the software toolbox development in Matlab is an easy and ...
tic research, including data import and export as well as different graphical representations of the data. This .... Read from HDD (data included in ITA-Toolbox).
Jan 8, 2005 - [email protected] (A. Varga), [email protected] (J. Magni). 1. Introduction. In modelling uncertainties in linear systems the lin-.
software under the Berkeley Software Distribution (BSD) license. Recently, the authors decided to migrate devel- opment to the RWTH Aachen GitLab repository ...
envlp: A MATLAB Toolbox for Computing Envelope Estimators in ...
Dec 11, 2014 - University of Minnesota. Zhihua Su. University of Florida ..... The functions that fit the envelope models are the core functions of this package.
Journal of Statistical Software
JSS
December 2014, Volume 62, Issue 8.
http://www.jstatsoft.org/
envlp: A MATLAB Toolbox for Computing Envelope Estimators in Multivariate Analysis Dennis Cook
Zhihua Su
Yi Yang
University of Minnesota
University of Florida
University of Minnesota
Abstract Envelope models and methods represent new constructions that can lead to substantial increases in estimation efficiency in multivariate analyses. The envlp toolbox implements a variety of envelope estimators under the framework of multivariate linear regression, including the envelope model, partial envelope model, heteroscedastic envelope model, inner envelope model, scaled envelope model, and envelope model in the predictor space. The toolbox also implements the envelope model for estimating a multivariate mean. The capabilities of this toolbox include estimation of the model parameters, as well as performing standard multivariate inference in the context of envelope models; for example, prediction and prediction errors, F test for two nested models, the standard errors for contrasts or linear combinations of coefficients, and more. Examples and datasets are contained in the toolbox to illustrate the use of each model. All functions and datasets are documented.
1. Introduction The envelope model is a new construction originally introduced by Cook, Li, and Chiaromonte (2010) in the context of multivariate linear regression Y = α + βX + ε,
(1)
where Y ∈ Rr is the multivariate response vector, X ∈ Rp is the predictor vector centered at 0 in the sample, the error vectors ε ∈ Rr are identically and independently distributed across observations with mean 0 and positive definite covariance matrix Σ ∈ Rr×r , and α ∈ Rr is the unknown intercept. Unless specified otherwise, we assume that the predictors are nonstochastic. The key parameters are the elements of the coefficient matrix β ∈ Rr×p . Compared
2
envlp: A MATLAB Toolbox for Envelope Models
b , the envelope estimator β b is potentially to the standard ordinary least squares estimator β ols em less variable and thus more efficient. This is achieved by allowing for the possibility that the distribution of some linear combinations of Y is invariant to changes in X, and we call this the immaterial part of Y. The immaterial part of Y provides no worthwhile information on b . The envelope model identifies and accounts for β, and yet it increases the variation in β ols the immaterial information and therefore reduces the variation in estimation. This reduction can be substantial, especially when the immaterial part of Y introduces large variation. Several extensions have been developed following Cook et al. (2010). The partial envelope model (Su and Cook 2011) focuses on the estimation of the coefficients for a selected subset of the predictors, and is therefore more efficient in estimating those coefficients. The inner envelope model (Su and Cook 2012) applies the enveloping idea in a novel way, which results in new methodology that is able to gain efficiency even when there is no immaterial information in the data. The heteroscedastic envelope model (Su and Cook 2013) removes the constant variance assumption in the envelope model, making it more flexible and more widely applicable. The scaled envelope model (Cook and Su 2013) is a scale invariant version of the envelope model, which can offer efficiency gains beyond those from the envelope model itself. The envelope model in the predictor space (Cook, Helland, and Su 2013) focuses on dimension reduction for the predictors. It is equivalent to the partial least squares (PLS) approach in the population and yet performs better than PLS with finite samples. The envelope model that estimates a multivariate mean can be viewed as an alternative to Stein estimation. Like the other methods it is particularly effective and can perform better than Stein estimation when there is immaterial information present in the data. The only software so far that performs envelope estimation is the MATLAB (The MathWorks Inc. 2012b) package LDR (Cook, Forzani, and Tomassi 2009). This package is mainly focused on likelihood-based sufficient dimension reduction, not envelope estimation. It implements the basic envelope model in Cook et al. (2010), but not any of its extensions or any inference methods in the envelope model context. This article describes the toolbox envlp, which implements all the existing envelope methods. It also contains functions for dimension selection, bootstrap estimation, prediction and hypothesis testing. Examples are provided to illustrate the use of the toolbox. All the documentation, as well as updates are available at the website http://code.google.com/p/envlp/. The rest of this paper is organized as follows. The envelope models are discussed in Section 2. Section 3 is an overview of the toolbox. Section 4 provides some examples on using the package. Discussion on future developments is contained in Section 5.
2. Envelope models 2.1. The basic envelope model Let (Γ, Γ0 ) ∈ Rr×r be an orthogonal matrix. If > > Γ> 0 Y | X ∼ Γ0 Y, and Γ Y
Γ> 0 Y | X,
then Γ> 0 Y carries no information on β and it represents the immaterial part of Y, while Γ> Y is the material part. Let B = span(β). Cook et al. (2010) showed that the previous two
Journal of Statistical Software
3
conditions are equivalent to the following two conditions (2a) B ⊆ span(Γ),
(2b) Σ = PΓ ΣPΓ + QΓ ΣQΓ ,
(2)
where P(·) is a projection matrix onto the subspace indicated by its argument and Q(·) = I − P(·) . If we have (2b), span(Γ) is called a reducing subspace of Σ (Conway 1990). An envelope subspace is defined as the smallest reducing subspace of Σ containing B (Cook et al. 2010), and is denoted by EΣ (B). In the context of (1), let Γ ∈ Rr×u span the envelope subspace EΣ (B). The envelope model is then written as follows Y = α + ΓηX + ε,
Σ = Σ1 + Σ2 = ΓΩΓ> + Γ0 Ω0 Γ> 0,
where β = Γη, η ∈ Ru×p , Ω ∈ Ru×u and Ω0 ∈ R(r−u)×(r−u) are unknown positive definite matrices, u is the dimension of the envelope subspace. From this model, the two conditions in (2) are satisfied: B is contained in span(Γ), and Σ is the sum of Σ1 = VAR(PΓ Y), the variance related to the material part of Y, and Σ2 = VAR(QΓ Y), the variance related to the immaterial part. It is seen from the envelope model that β and Σ are linked by Γ and it is this link that results in more efficient estimation of β. In effect, the estimation process accounts for the variation in the immaterial information Γ> 0 Y. Let k · k denote the spectral norm of a matrix. When kΣ1 k kΣ2 k, the immaterial part has relatively large variation and the envelope model will offer substantial efficiency gains over the standard model (1). When u = r, there is no immaterial information in Y, and the envelope model is equivalent to the standard model (1). This will happen when the rank of β is equal to r.
2.2. Partial envelope model The partial envelope model (Su and Cook 2011) is appropriate when part of the predictors are of special interest. It is often more efficient than the envelope model for the purpose of estimating the regression coefficients for those predictors. > > p1 are the predictors of special Suppose we can partition X to (X> 1 , X2 ) , where X1 ∈ R p interest and X2 ∈ R 2 are covariates, p1 + p2 = p. Then β can be partitioned accordingly into (β 1 , β 2 ), and (1) can be written as
Y = α + β 1 X1 + β 2 X2 + ε, where β 1 ∈ Rr×p1 is the key parameter.
The partial envelope model applies the enveloping idea on β 1 : Let B1 = span(β 1 ). A partial Σ-envelope of B1 , denoted by EΣ (B1 ), is the smallest reducing subspace of Σ containing B1 . The coordinate form of the partial envelope model is Y = α + ΓηX1 + β 2 X2 + ε,
Σ = Σ1 + Σ2 = ΓΩΓ> + Γ0 Ω0 Γ> 0,
⊥ (B ), the subspace orthogonal to E (B ), u is where Γ ∈ Rr×u1 spans EΣ (B1 ), Γ0 spans EΣ 1 1 Σ 1 > the dimension of EΣ (B1 ), η = Γ β 1 ∈ Ru1 ×p , Ω ∈ Ru1 ×u1 and Ω0 ∈ R(r−u1 )×(r−u1 ) are both positive definite matrices. Compared to the envelope model, EΣ (B1 ) ⊆ EΣ (B) and u1 ≤ u. Intuitively, more information is immaterial relative to β 1 , so the partial envelope model is typically more efficient than the envelope model for the purpose of estimating β 1 .
The partial envelope model degenerates to the standard model when u1 = r, which means no information is immaterial to β 1 . This happens when the rank of β 1 is equal to r. So
4
envlp: A MATLAB Toolbox for Envelope Models
in a regression problem where rank(β) = r, the envelope model degenerates to the standard model; while as long as p1 < r, the partial envelope model is still applicable. In this sense, the partial envelope model is more flexible than the envelope model.
2.3. Heteroscedastic envelope model The envelope model in Section 2.1 assumes homogeneity of the error variance. The heteroscedastic envelope model (Su and Cook 2013) removes this assumption and allows for non-constant covariance structure. The heteroscedastic envelope model was developed in the context of estimating multivariate means for different populations. This problem can be formulated as Y(i)j = µ + β (i) + ε(i)j , i = 1, . . . , p, j = 1, . . . , n(i) , (3) where the subscripts with parentheses denote groups and subscripts without parentheses denote observations within a group, Y(i)j ∈ Rr is the jth observation in the ith group, µ ∈ Rr r is the grand mean and Ppover all the observations, β (i) ∈ R is the main effect of the ith group we assume that i=1 n(i) β (i) = 0, n(i) is the sample size for the ith group, ε(i)j ∈ Rr follows a distribution with mean 0 and covariance matrix Σ(i) ∈ Rr×r . From this formulation, the errors have heteroscedastic covariance structure. The heteroscedastic envelope model applies the enveloping idea on all the β (i) ’s, and at the same time accommodates the heteroscedastic covariance structure. Let M = {Σ(i) : i = 1, . . . , p} be the collection of covariance matrices and let B = span(β (1) , . . . , β (p) ). The Menvelope of B, denoted by EM (B), is the intersection of all subspaces that contain B and reduce each member of M. The coordinate form of this model is Y(i)j = µ + Γη (i) + ε(i)j ,
Σ(i) = Σ1(i) + Σ2 = ΓΩ1(i) Γ> + Γ0 Ω0 Γ> 0,
where β (i) = Γη (i) , Γ ∈ Rr×u is a semi-orthogonal matrix that spans EM (B), Γ0 ∈ Rr×(r−u) spans its orthogonal complement, η (i) = Γ> β (i) ∈ Ru , Ω1(i) ∈ Ru×u and Ω0 ∈ R(r−u)×(r−u) are both positive definite matrices, and u is the dimension of EM (B). Notice that Ω0 is constant over different populations because the distribution of the immaterial part is invariant to the changes in X. When u = r, the heteroscedastic envelope model degenerates to the standard model (3). Compared with the envelope model in Section 2.1, recognizing the heteroscedastic error structure leads to more reliable estimators and greater efficiency gains. To test homogeneity of the covariance matrices, Box’s M test (Johnson and Wichern 2007) can be used.
2.4. Inner envelope model The inner envelope model (Su and Cook 2012) provides an envelope method that can achieve efficiency gains even when all of Y is material. It has a different mechanism in utilizing the tool of reducing subspaces. Under the standard model (1), an inner Σ-envelope of B, denoted by IE Σ (B), is the reducing subspace of Σ with maximal dimension that is contained in B. Let Γ1 ∈ Rr×u be an orthogonal basis that spans IE Σ (B). The coordinate form of the inner envelope model is then > Y = α + (Γ1 η > 1 + Γ0 Bη 2 )X + ε,
> Σ = Γ1 Ω1 Γ> 1 + Γ0 Ω0 Γ0 ,
Journal of Statistical Software
5
> r×(r−u) spans IE (B)⊥ , B ∈ R(r−u)×(p−u) is an orthogonal where β = Γ1 η > Σ 1 + Γ0 Bη 2 , Γ0 ∈ R matrix such that span(Γ1 , Γ0 B) = B, η 1 ∈ Rp×u , η 2 ∈ Rp×(p−u) , Ω1 ∈ Ru×u and Ω0 ∈ R(r−u)×(r−u) are positive definite matrices, u is the dimension of IE Σ (B).
The inner envelope model divides β into two parts by IE Σ (B). If the part Γ1 η > 1 is estimated with greater precision than the standard model (particularly when kΣ1 k kΣ2 k), and the part Γ0 Bη > 2 is estimated with about the same precision, then overall we get better efficiency in estimating β. The possible values of u are from 0 to p. When u = 0, the inner envelope model reduces to the standard model and when u = p, the inner envelope model is equivalent to the envelope model in Section 2.1.
2.5. Scaled envelope model The scaled envelope model (Cook and Su 2013) is a scale invariant version of the envelope model in Section 2.1. It is invariant under scale transformation of the responses and can achieve efficiency gains beyond those offered by the envelope model. It is an alternative choice to the envelope model especially when u = r is inferred via the envelope model. Let Λ ∈ Rr×r be a diagonal matrix to represent the scale transformation of the responses. Its diagonal elements are λi > 0, i = 1, . . . , r, with λ1 = 1 and the rest to be estimated. Under the framework of (1), the coordinate form of a scaled envelope model is Y = α + ΛΓηX + ε,
Σ = ΛΓΩΓ> Λ + ΛΓ0 Ω0 Γ> 0 Λ,
where Γ ∈ Rr×u is a semi-orthogonal matrix that spans the Λ−1 ΣΛ−1 -envelope of Λ−1 B, Γ0 ∈ Rr×(r−u) is the completion of Γ, η ∈ Ru×p , Ω ∈ Ru×u and Ω0 ∈ R(r−u)×(r−u) are positive definite matrices, and u is the dimension of the Λ−1 ΣΛ−1 -envelope of Λ−1 B. The scaled envelope model reduces to the standard model (1) when u = r. Like the other envelope methods, the goal of the scaled envelope is to improve estimation efficiency in the estimation of β = ΛΓη. When u < r, the scaled envelope model is not nested within the standard model or any scaled envelope model with a larger dimension, so likelihood ratio testing cannot be applied for selection of u.
2.6. Envelope model in the predictor space The envelope model in the predictor space (Cook et al. 2013) is based on the possibility that the distribution of the full response vector Y is invariant to changes in some linear combinations of the predictors X. It can be applied under the context of (1) with the response being univariate or multivariate. In terms of prediction, the performance of this estimator is asymptotically as good as or better than the least squares estimator. In population, it is equivalent to the PLS estimator obtained from the SIMPLS algorithm (de Jong 1993), but it typically has better performance with finite samples. In contrast to the previous envelope models, we now assume that the predictors are random so (Y, X) has a joint distribution. Let ΣX = VAR(X) and let B ∗ = span(β). Then the ΣX envelope of B ∗ , denoted by EΣX (B ∗ ), is the smallest reducing subspace of ΣX that contains B ∗ . Letting Γ ∈ Rp×u be an orthogonal basis of EΣX (B ∗ ), the coordinate form of the envelope model in the predictor space is Y = µ + η > Ω−1 Γ> X + ε,
ΣX = ΓΩΓ> + Γ0 Ω0 Γ> 0,
(4)
6
envlp: A MATLAB Toolbox for Envelope Models
⊥ (B ∗ ), η ∈ Ru×r , Ω ∈ where β = η > Ω−1 Γ> , Γ0 ∈ Rp×(p−u) is an orthogonal basis for EΣ X Ru×u , Ω0 ∈ R(p−u)×(p−u) , and u is the dimension of the envelope EΣX (B ∗ ). When u = p, this envelope model reduces to the standard model (1).
Under model (4), let E denote EΣX (B ∗ ) for subscripts, then Y is conditionally uncorrelated with QE X given PE X, and QE X is uncorrelated with PE X. Then QE X is immaterial to the regression. By recognizing and accounting for the immaterial part, the envelope model (4) has a better prediction performance than the standard model or even the PLS estimator.
2.7. Envelope model with small sample size When the sample size is smaller than r in the envelope model (Section 2.1) or p in the envelope model in the predictor space (Section 2.6), the usual envelope estimators cannot be computed. In these cases, a sequential algorithm (Cook 2012) can be used to obtain estimators that are (i) equivalent to the usual envelope estimators in the population, (ii) not generally as efficient when n > r or n > p, but (iii) can still provide useful results in small samples. The usual estimators of an envelope subspace are obtained by optimizing an objective function over a Grassmann manifold. For example, to estimate EΣ (B) (cf. Section 2.1), we minimize the following objective function over a Grassmann manifold G(r, u): b = arg min log |Γ> Σ b res Γ| + log |Γ> Σ b −1 Γ|, Γ Y Γ∈G(r,u)
b Y ∈ Rr×r is the sample covariance matrix of Y, Σ b res ∈ Rr×r is the sample covariance where Σ matrix of the residuals from the least squares regression of Y given X, and | · | is the determib Y is singular when the sample size is smaller than r and consequently the nant. The matrix Σ objective function is not well-defined. However, a sequential algorithm can be used to obtain an alternative estimator of Γ. This estimator then allows straightforward computation of the other parameters in the envelope model, including β. For u ∈ Ra×b , S = span(u) ⊆ span(M), where M ∈ Ra×a is a semi-positive definite matrix. Suppose that the M-envelope of S, EM (S), has dimension d. Set w0 = 0, W = w0 , and U = uu> . Then, for k = 0, 1, . . . , d − 1, construct Ek = span(MWk )
wk+1 = l1 (QEk UQEk ) Wk+1 = span(w0 , . . . , wk , wk+1 ), where l1 (A) means the eigenvector corresponding to the largest eigenvalue of A. At termination, EM (S) = span(Wd ). The sample version of this algorithm is obtained by simply substituting sample versions of U and M. This sequential algorithm can be used for estimating a general envelope subspace. In the toolbox envlp, it is implemented for the envelope model and the envelope model in the predictor space. For the envelope model in the predictor space, Cook et al. (2013) showed that in the population the envelope subspace provided by this algorithm is the same as that provided by the SIMPLS algorithm. The sequential algorithm described above can also be used for large sample sizes, and it is much faster than performing the Grassmann manifold optimization. It also provides a
Journal of Statistical Software
7
√
n-consistent estimator of the envelope subspace, although with large sample sizes, this estimator’s performance may not be as good as that of the estimator based on Grassmann optimization.
2.8. Envelope estimator for multivariate mean The context for the envelope methodology in this section is a bit different from that in previous sections, as now we consider estimating the multivariate mean, not fitting multivariate linear regression. Assuming that the sample Y1 , . . . , Yn is independent and identically distributed ¯ = Pn Yi is a natural with mean µ and covariance matrix Σ ∈ Rp×p , the sample mean Y i=1 estimator of µ. James and Stein (1961) proved that this estimator is not admissible and is dominated by the James-Stein estimator for p ≥ 3. Preliminary investigations have indicated that the envelope estimator for the multivariate mean has a smaller mean square error than ¯ and it often has a smaller mean square error than the James-Stein estimator. Y, The envelope estimator for the multivariate mean is based on the assumption that µ is orthogonal to some eigenvectors of Σ. Diaconis and Freedman (1984) showed that as the dimension tends to infinity, two random vectors are orthogonal to each other with probability 1. In the envelope model for estimating the multivariate mean, it is assumed that µ lies within the space spanned by a subset of the eigenvectors of Σ, and we call the space S. By a result in Cook et al. (2010), S is the Σ-envelope of M, where M = span(µ). Let Γ ∈ Rp×u be a semi-orthogonal matrix that spans EΣ (M), then the envelope model is µ = Γη,
Σ = ΓΩΓ> + Γ0 Ω0 Γ> 0,
where u is the dimension of EΣ (M), Γ0 ∈ Rp×(p−u) is the completion of Γ, η ∈ Ru , Ω ∈ Ru×u ˆ em = and Ω0 ∈ R(p−u)×(p−u) carry the coordinates. The envelope estimator has the form µ ¯ P b Y. Γ
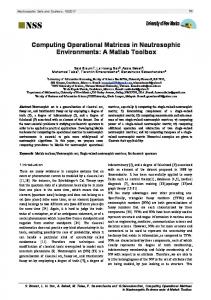
The difference between the James-Stein estimator and the envelope estimator can be visualized ¯ The James-Stein in Figure 1. In the figure, the ellipse represents the distribution of Y. ¯ towards the origin. In contrast to µ ˆ JS , ˆ JS , and it shrinks Y estimator of µ is denoted as µ ¯ ˆ ˆ em is the projection of Y onto the estimated envelope EΣ (M). In the envelope estimator µ this figure, EΣ (M) aligns with the eigenvector corresponding to the smaller eigenvalue of Σ. ¯ and it is expected to have a ˆ em is much less variant than Y, Then the envelope estimator µ ¯ ˆ JS . smaller mean squared error than Y, or even µ
2.9. Role of normality None of the envelope models discussed in Sections 2.1 to 2.8 require constraints on the distribution of the errors ε beyond those listed previously. Adding the assumption that the errors are normally distributed facilitates an analysis by providing a well-defined likelihood and asymptotic standard errors. Excluding the sequential methods, all fitting in the envlp toolbox is based on normal likelihoods, along with their corresponding inference methods. Those √ likelihoods also provide n-consistent estimators without normality and experience has shown that they perform well in non-normal settings. However, inference methods may be impacted by clear deviations from normality and then it is recommended that the bootstrap methods available in the envlp toolbox be used for standard errors and inference. The bootstrap is the only method provided for computing standard errors for the sequential estimators, as listed in Table 1.
8
envlp: A MATLAB Toolbox for Envelope Models
ˆ JS and envelope estimator µ ˆ em . Figure 1: Graphical illustration of James-Stein estimator µ
3. Toolbox overview The toolbox envlp implements all the envelope methods discussed in Section 2. It is modularized, with nine modules, each written for a model: env for the basic envelope model, henv for the heteroscedastic envelope model, ienv for the inner envelope model, penv for the partial envelope model, senv for the scaled envelope model, xenv for the envelope model in the predictor space, envmean for the envelope estimator of the multivariate mean, envseq and xenvpls are counterparts of env and xenv in small sample size cases. Each module has three parts: the core function that fits the model, dimension selection functions, and inference tools. In this toolbox, the core function always has the same name as the module. The dimension selection functions and inference tools available are different from module to module, as the nature of the models is different. All modules will be described in detail later in this section. The structure of this toolbox is summarized in Table 1. This toolbox relies on MATLAB toolbox sg min (Lippert 2004) for Grassmann manifold optimization. sg min uses the analytical first derivative and numerical second derivative of the objective function to perform the optimization, and we find it is stable. Some modifications are made to it for the envelope model context. A few auxiliary functions in the toolbox envlp rely on the MATLAB Statistics toolbox (The MathWorks Inc. 2012a), the LDR toolbox (Cook et al. 2009), the Tcodes toolbox (Strang 2000) and function MBoxtest (Trujillo-Ortiz and Hernandez-Walls 2002). To install the toolbox, direct the MATLAB working directory to the folder “envlp”, and type the command install_envlp. If a previous version is present, simply replace the folder by that of the latest version and type install_envlp. The installation will be completed if
9
Journal of Statistical Software Module env envseq henv
Inference tools Estimation and prediction Bootstrap for estimating standard errors Hypothesis test on coefficients
Section
Bootstrap for estimating standard errors Estimation and prediction Bootstrap for estimating standard errors Hypothesis test on coefficients
2.7
Estimation and prediction Bootstrap for estimating standard errors Hypothesis test on coefficients Estimation and prediction Bootstrap for estimating standard errors Hypothesis test on coefficients Estimation and prediction Bootstrap for estimating standard errors Hypothesis test on coefficients Estimation and prediction Bootstrap for estimating standard errors Hypothesis test on coefficients Bootstrap for estimating standard errors Estimation and prediction Bootstrap for estimating standard errors Hypothesis test
2.1
2.3
2.4
2.2
2.5
2.6 2.7 2.8
Table 1: Structure of toolbox envlp. you agree with the license agreement. You do not need to load the auxiliary functions or toolboxes mentioned before. Once the toolbox is installed, you can call functions or datasets in the toolbox from any current working directory. The toolbox contains three types of functions: the core functions, functions for dimension selection and functions for inference tools. Section 3.1 to 3.3 are devoted to the description of these three types.
3.1. Core functions The functions that fit the envelope models are the core functions of this package. There are nine of them, one in each module, and they share the same names as the module names. For example, the function env fits the envelope model, and the function envmean finds the envelope estimator for the multivariate mean. The envelope models in the regression context
10
envlp: A MATLAB Toolbox for Envelope Models
are env, henv, ienv, penv, senv, xenv, envseq and xenvpls. The inputs for these models are X, Y and u, where X and Y store the data matrices for the predictors and the responses, and u is the dimension of the envelope, which can be obtained by the functions discussed in Section 3.2. The inputs for envmean are the data matrix Y and the dimension of the envelope u, as this context does not involve any predictors. The output of these nine functions is a list containing the envelope estimators of model parameters, and important statistics calculated from the models like the value of the maximized log-likelihood function, the asymptotic covariance matrix of the estimators, the number of parameters in the model and many others. We present an example by applying the envelope model to the wheat protein data in Cook et al. (2010). The wheat protein data contains seven variables, the logarithms of near infrared reflectance measured at six wavelengths and a group indicator taking value 0 or 1 for wheat with low or high protein content. In multivariate linear regression (1), we take the group indicator as the predictor and the spectral measurements as responses. The regression coefficients are then the mean differences between the two groups. For demonstration purpose, we take only the third and fourth measurements as responses, so that we can visualize the data. First we load the data and assign the predictor and responses. load wheatprotein.txt X = wheatprotein(:, 8); Y = wheatprotein(:, 3 : 4); Figure 2 displays the data with two axes assigned to the two responses. For better visualization, we centered the data to have mean 0. Under the standard model, the estimated coefficients in β are 7.52 and −2.06, with the associated standard errors for these two elements being 8.64 and 9.49. The standard errors returned by Out.asySE are asymptotic, for actual √ standard errors, we need to multiply by 1/ n, where n is the sample size. Out1 = fit_OLS(X, Y); Out1.betaOLS ans = 7.5224 -2.0609 n = 50; Out1.asySE / sqrt(n) ans = 8.6372 9.4852 b so it is hard The standard errors are large relative to the absolute value of elements in β, to tell the difference between the two groups. The two curves in the left panel of Figure 2 present the projection distribution of the two groups onto the Y1 axis, with the solid line for the high protein group and the dashed line for the low protein group. The projection path for
11
75
75
Journal of Statistical Software
EbΣ (B) -25
Y2 (2nd response)
-25
A
B1
B2
-75
-75
Y2 (2nd response)
25
25
⊥ EbΣ (B)
-65
-20
25
Y1 (1st response)
70
-65
-20
25
70
Y1 (1st response)
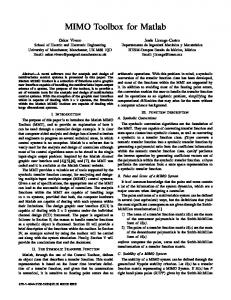
Figure 2: Graphical illustration of the working mechanism of the envelope model. The solid dots mark the wheat with high protein content and the open circles mark the wheat with low protein content. a sample point ‘x’ is marked as A in the plot. We notice that the two curves almost overlap with each other, so it is hard to distinguish between the two groups. This is consistent with b and their associated standard errors. the comparison of the absolute values of elements in β
To fit the envelope model to this data, we need the dimension of the envelope. Dimension selection will be discussed in Section 3.2, for now we just fixed the dimension of the envelope at 1. ModelOutput = env(X, Y, 1); ModelOutput ModelOutput = beta: Sigma: Gamma: Gamma0: eta: Omega: Omega0: alpha: l: covMatrix: asyEnv: ratio: paramNum: n:
After fitting the envelope model, the output is a list containing the estimates of regression coefficients β, error covariance matrix Σ, parameters in the envelope model including Γ, η, Ω, and Ω0 , as well as important statistics like the value of the maximized log-likelihood l, the b the asymptotic standard error for each element asymptotic covariance matrix of vectorized β, b in β, the number of parameters in the model and the sample size. To get the estimated group difference, we call the respective component in the list ModelOutput.beta. Similar b by dividing their to the standard model, we can get the standard errors for elements in β √ asymptotic standard errors by n. ModelOutput.beta ans = 5.1405 -4.6782 ModelOutput.asySE / sqrt(n) ans = 0.5142 0.4685 b are 5.14 and −4.68, with standard errors The envelope estimators of the two elements in β b the standard errors are small 0.51 and 0.47. Compared to the size of the elements in β, and it is easy to tell the difference between the two groups. The right panel of Figure 2 illustrates the envelope analysis: The envelope model identifies the variation in the direction ⊥ (B) as carrying no information on β, so a sample data point ‘x’ is projected first onto of EbΣ the envelope subspace EbΣ (B), and then onto the Y1 axis. The projection route is marked as B. The uniqueness of the envelope model is reflected on the first segment of B, which accounts for the immaterial information in the data. The two curves on the Y1 axis are projection distributions of the two groups, with each data point following route similar to B. The two curves are well separated, indicating that we have obtained substantial efficiency gains. To quantify the gains, we can compare the standard errors of the standard estimator and the envelope estimator by taking their ratios. In this example, the ratios are 16.80 and 20.25 for b the two elements in β.
3.2. Dimension selection
Likelihood based methods including Akaike information criteria (AIC), Bayesian information criteria (BIC) and likelihood ratio testing (LRT) are implemented for selecting the dimension of an envelope. In small sample size cases where the likelihood is not well-determined, we select the dimension by m-fold cross validation (CV). The functions modelselectaic, modelselectbic and modelselectlrt choose the dimension for the envelope models in the regression context by AIC, BIC and LRT. The common inputs for these three functions are data matrices X and Y and modelType, while LRT has an additional input alpha indicating the significance level. The choices for modelType are ’env’, ’henv’, ’ienv’, ’penv’, ’senv’ and ’xenv’.
Journal of Statistical Software
13
The function mfoldcv chooses the dimension of the envelope models by m-fold CV. It divides the data into m folds of about equal size, and then uses one fold in turn as testing samples and the rest as training samples. The function returns the dimension that minimizes the average squared prediction errors using the identity inner product. The inputs for mfoldcv are data matrices X, Y, number of folds m and modelType. This method can be applied to any model, so the choices for modelType are ’env’, ’envseq’, ’henv’, ’ienv’, ’penv’, ’senv’, ’xenv’, ’xenvpls’ and ’envmean’. We write separate dimension selection functions for envelope estimator of multivariate means, as they have different input variables. The input variable of aic_envmean, bic_envmean and lrt_envmean is the data matrix Y only. The output for all the dimension selection functions is an integer u for the dimension of the envelope subspace. Back to the wheat protein data example discussed in Section 3.1, we applied AIC, BIC and LRT with significance level 0.01 to select the dimension. u1 = modelselectaic(X, Y, 'env'); u1 u1 = 1 u2 = modelselectbic(X, Y, 'env'); u2 u2 = 1 u3 = modelselectlrt(X, Y, 0.01, 'env'); u3 u3 = 1 We notice that all three criteria agree that the dimension of the envelope subspace is 1. According to the right panel in Figure 2, u = 1 is well agreed by the data, and the estimated envelope subspace EbΣ (B) is marked in the plot.
3.3. Inference tools
The inference tools provided by toolbox envlp include bootstrap estimation of standard errors, estimation and prediction at a new observation, and hypothesis testing. The function bootstrapse computes the standard errors for elements in the estimated regression coefficients by bootstrapping the residuals. Its inputs are data matrices X, Y, the
14
envlp: A MATLAB Toolbox for Envelope Models
dimension of the envelope u, number of bootstrap samples B, and modelType, which can be ’env’, ’envseq’, ’henv’, ’ienv’, ’penv’, ’senv’, ’xenv’ or ’xenvpls’. The output bootse is a matrix having the same dimension as β with each element being the standard b The function btrsp_envmean computes the standard error of the corresponding element in β. ˆ em . Its inputs and output are similar to bootstrapse, except that it errors for elements in µ does not need X and modelType for input. The function predict performs estimation or prediction for envelope models in the regression context. It returns a list PredictOutput which includes the estimated or predicted value, its standard errors and covariance matrix. The input ModelOutput is the output list from the core functions, Xnew is a column vector containing the value of X at which to estimate or predict Y, infType can be chosen from ’estimation’ or ’prediction’, and modelType can be ’env’, ’henv’, ’ienv’, ’penv’, ’senv’ or ’xenv’. In the context of estimating a multivariate mean, the prediction function is called predict_envmean. It has similar structure as predict except that it does not have inputs Xnew and modelType. The function testcoefficient tests if certain linear combination of the rows or columns of the regression coefficients are equal to some pre-specified values. More specifically, letting L, R and A be a × r, p × b and a × b matrices of constants, testcoefficient tests H0 : LβR = A versus Ha : LβR 6= A. The inputs are ModelOutput which is the output from the core functions, TestInput which is a list that specifies L, R and A in the hypotheses and modelType which can be chosen from env, henv, ienv, penv, senv and xenv. The output TestOutput is a list that contains test statistic, degrees of freedom, p value and the covariance b matrix of vectorized LβR. At the same time, a table is printed out to display the test results. The function testcoefficient_envmean is for testing H0 : Lµ = A versus Ha : Lµ 6= A, where µ is the multivariate mean, L is an a × r matrix and A is an a × 1 vector. The output of testcoefficient_envmean has the same form as testcoefficient, but its input does not include modelType. b can Continuing with the wheat protein example, the standard error of each element in β also be estimated by residual bootstrap, which is obtained by the command bootstrapse. The inputs for bootstrapse are the predictors X, the responses Y, the dimension of the envelope model u, the number of bootstrap samples B, and a string that represents the model modelType. We took u = 1 as discussed in Section 3.2, and we put ’env’ for modelType. rand('seed', 0) B = 100; bootse = bootstrapse(X, Y, 1, B, 'env') bootse = 0.5155 0.4770 Recall that the standard errors calculated using asymptotic standard errors are 0.5142 and 0.4685, which are quite close to the bootstrap standard errors. We do not set seeds for the function bootstrapse, so the user can get different results each time he runs the function. But when B is large, the results should be close to each other. Now to test if β = 0, we use the function testcoefficient. If we do not input L, R and A and leave the input TestInput as blank, then by default it is testing if β = 0.
Journal of Statistical Software
15
TestOutput = testcoefficient(ModelOutput, 'env'); Test Hypothesis Chisq Statistic DF P-value ------------------------------------------------------L * beta * R = A 100.416 2 0.0000 ------------------------------------------------------The output table shows a highly significant p value, which is strong evidence that the two wheat groups are different.
3.4. Monitoring and controlling the convergence speed The running time for most examples in the package is in the order of seconds, some are in the order of minutes. It can take longer for larger datasets. Envelope estimation relies on Grassmann manifold optimization, which uses an iterative algorithm. The running time of the functions depends on the nature of the methods, tolerance levels for convergence and the starting value. For example, using AIC or BIC for dimension selection takes longer than using LRT because of different stopping criteria; senv runs longer than env because of its method of estimation; setting the tolerance level at 10−7 can reduce running time compared to setting the tolerance level at 10−9 . For this purpose, we add an optional argument Opts to each function so that the user can monitor the iteration process and adjust the tolerance level. Opts is a list, and it provides the user the option to display the current number of iterations, specify a starting value, control the maximum number of iteration and set the tolerance levels. If the user does not define any of the components, default values will be used. For more details, please refer to the user’s guide.
4. Example In this section, we provide one more example which uses the module henv. We hope the user can get an idea of the similarity and difference in the usage of different modules. The water strider data was analyzed by Su and Cook (2013). It has 30 measurements of eight characteristics for each of the three species of water striders: L. esakii, L. dissortis and L. rufoscutellatus. In the data file “waterstrider.mat”, X contains the two group indicators and Y contains the eight characteristics. The coding of the group indicators is a little different from the usual, the first group indicator takes value 1, 0 and −1 for L. esakii, L. dissortis and L. rufoscutellatus, and the second group indicator takes value 1, 0 and −1 for L. dissortis, L. esakii and L. rufoscutellatus. The interest lies in comparison of the three species. First we test if the covariance matrices of the different species are the same. Box’s M test (Johnson and Wichern 2007) is implemented in the toolbox for this purpose. load waterstrider.mat alpha = 0.01; TestOutput = mtest(X, Y, alpha); -----------------------------------------------MBox Chi-sqr. df P
16
envlp: A MATLAB Toolbox for Envelope Models
-----------------------------------------------157.5977 137.3361 72 0.0000 -----------------------------------------------Covariance matrices are significantly different. The highly significant p value suggests that the covariance matrices for the three species are different. Therefore, it is not appropriate to use the basic envelope model which assumes constant covariance matrices across the species. Instead we use the heteroscedastic envelope model to fit this data. u1 = modelselectaic(X, Y, 'henv'); u1 u1 = 6 u2 = modelselectbic(X, Y, 'henv'); u2 u2 = 4 u3 = modelselectlrt(X, Y, 0.01, 'henv'); u3 u3 = 6 AIC and LRT with significance level 0.01 both yield u = 6 while BIC selects u = 4. To be more conservative, we fit the heteroscedastic envelope model with u = 6. ModelOutput = henv(X, Y, 6); ModelOutput ModelOutput = mu: mug: Yfit: Gamma: Gamma0: beta: groupInd:
As we are in the context of comparing a multivariate mean for different populations, the output list for the heteroscedastic envelope model contains the estimates of the grand mean µ, the group means µ(i) , and the error covariance matrices for each group Σ(i) . The output list also has the constituent parameters and important statistics just as in the output list of env. To get the estimated group mean, we call ModelOutput.mug. ModelOutput.mug ans = -1.1417 -1.4063 -1.3314 -0.3113 0.4003 0.4107 0.3467 -0.1954
If there are p groups, ModelOutput.mug will have p columns, each for one group. We can find the corresponding group indicators by calling ModelOutput.groupInd ans = -1 0 1
-1 1 0
The ith row in ModelOutput.groupInd corresponds to the ith column in ModelOutput.mug. For example, the estimated mean vector of the eight characteristics for L. rufoscutellatus is in the first column of ModelOutput.mug. To predict a new observation, we input its group indicator. Suppose we want to predict a new observation of L. dissortis. Xnew = [0 1]'; PredictOutput = prediction(ModelOutput, Xnew, 'prediction', 'henv'); [PredictOutput.value, PredictOutput.SE]
18
envlp: A MATLAB Toolbox for Envelope Models
ans = -1.1267 -1.4067 -1.3336 -0.1839 0.3847 0.3753 0.3271 -0.2100
The first column gives the predicted value, which is the estimated group mean, and the prediction errors are in the second column. The usage of other modules is similar; the inputs and outputs of the functions are only tailored for the different models. For details on the syntax and semantics of the functions, the user can refer to the reference manual.
5. Conclusion The MATLAB toolbox envlp implements a variety of envelope models in the context of multivariate linear regression and estimating multivariate means. Complete documentation is provided for each function and a user’s guide to the toolbox is also available. Description for all datasets is also included. Scripts are provided to reproduce all published results of these methods. The package is modularized and it is easy for the user to follow the structure of the package if they want to add new methods to the toolbox. Our aim for the future is to extent the package and add more methods to the toolbox as well as providing more inference tools. Updates can be checked on the toolbox website.
Acknowledgments We are grateful to the editor and two referees for their insightful suggestions and comments that helped us improve the paper. We also thank Guangyu Zhu for his comments on previous versions of the toolbox. The research in this article is supported in part by National Science Foundation Grants DMS-1007547, DMS-1407460 and SES-1156026.
References Conway JB (1990). A Course in Functional Analysis. Springer-Verlag. Cook RD (2012). “Lecture Notes on Dimension Reduction.” School of Statistics, University of Minnesota, Minneapolis. Cook RD, Forzani L, Tomassi D (2009). “LDR: A Package for Likelihood-Based Sufficient Dimension Reduction.” Journal of Statistical Software, 39(3), 1–20. URL http: //jstatsoft.org/v39/i03/.
Journal of Statistical Software
19
Cook RD, Helland I, Su Z (2013). “Envelopes and Partial Least Squares Regression.” Journal of the Royal Statistical Society B, 75(5), 851–877. Cook RD, Li B, Chiaromonte F (2010). “Envelope Models for Parsimonious and Efficient Multivariate Linear Regression.” Statistica Sinica, 20(3), 927–1010. Cook RD, Su Z (2013). “Scaled Envelopes: Scale Invariant and Efficient Estimation in Multivariate Linear Regression.” Biometrika, 100(4), 939–954. de Jong S (1993). “SIMPLS: An Alternative Approach to Partial Least Squares Regression.” Chemometrics and Intelligent Laboratory Systems, 18(3), 251–263. Diaconis P, Freedman D (1984). “Asymptotics of Graphical Projection Pursuit.” The Annals of Statistics, 12(3), 793–815. James W, Stein C (1961). “Estimation with Quadratic Loss.” In Proceedings of the Fourth Berkeley Symposium on Mathematical Statistics and Probability, volume 1, pp. 361–379. Johnson RA, Wichern DW (2007). Applied Multivariate Statistical Analysis. Prentice Hall, Upper Saddle River. Lippert R (2004). sg min: Stiefel Grassmann Optimization. MATLAB package version 2.4.3. URL http://web.mit.edu/~ripper/www/sgmin.html. Strang G (2000). Tcodes – MATLAB Teaching Codes. Massachusetts Institute of Technology, Cambridge, Massachusetts. URL http://web.mit.edu/18.06/www/Course-Info/ Tcodes.html. Su Z, Cook RD (2011). “Partial Envelopes for Efficient Estimation in Multivariate Linear Regression.” Biometrika, 98(1), 133–146. Su Z, Cook RD (2012). “Inner Envelopes: Efficient Estimation in Multivariate Linear Regression.” Biometrika, 99(3), 687–702. Su Z, Cook RD (2013). “Estimation of Multivariate Means with Heteroscedastic Errors Using Envelope Models.” Statistica Sinica, 23(1), 213–230. The MathWorks Inc (2012a). Statistics Toolbox – MATLAB: Perform Statistical Modeling and Analysis. Natick, Massachusetts. URL http://www.mathworks.com/products/ statistics/. The MathWorks Inc (2012b). MATLAB – The Language of Technical Computing, Version 8.0. Natick, Massachusetts. URL http://www.mathworks.com/products/matlab/. Trujillo-Ortiz A, Hernandez-Walls R (2002). MBoxtest: Multivariate Statistical Testing for the Homogeneity of Covariance Matrices by the Box’s M. A MATLAB file, URL http: //www.mathworks.com/matlabcentral/fileexchange/2733.
20
envlp: A MATLAB Toolbox for Envelope Models
Affiliation: Dennis Cook, Yi Yang School of Statistics University of Minnesota E-mail: [email protected], [email protected] URL: http://users.stat.umn.edu/~rdcook/, http://users.stat.umn.edu/~yiyang/ Zhihua Su Department of Statistics University of Florida E-mail: [email protected] URL: http://www.stat.ufl.edu/~zhihuasu/
Journal of Statistical Software published by the American Statistical Association Volume 62, Issue 8 December 2014