Fit the data to a straight line, and from the equation of the straight line ... You will use Excel to analyze data from an experiment of the type just described to ...
1 Enzyme Kinetics In this exercise we will look at the catalytic behavior of enzymes. You will use Excel to answer the questions in the exercise section. At the end of this session, you must hand in answers to all the questions, along with print outs of any plots you created.
Background Enzymes are the catalysts of biological systems and are extremely efficient and specific as catalysts. In fact, typically, an enzyme accelerates the rate of a reaction by factors of at least a million compared to the rate of the same reaction in the absence of the enzyme. Most biological reactions do not occur at perceptible rates in the absence of enzymes. One of the simplest biological reactions catalyzed by an enzyme is the hydration of CO2. The catalyst in this reaction is carbonic anhydrase. This reaction is part of the respiration cycle which expels CO2 from the body. Carbonic anhydrase is a highly efficient enzyme – each enzyme molecule can catalyze the hydration of 105 CO2 molecules per second.
Enzymes are highly specific. Typically a particular enzyme catalyzes only a single chemical reaction or a set of closely related chemical reactions. As is true of any catalyst, enzymes do not alter the equilibrium point of the reaction. This means that the enzyme accelerates the forward and reverse reaction by precisely the same factor. For example, consider the interconversion of A and B.
A↔B
(1)
Suppose that in the absence of the enzyme the forward rate constant (kf) is 10-4 s-1 and the reverse rate constant (kr) is 10-6 s-1. The equilibrium constant (Keq) is given by the ratio of the two rate constants.
K eq
[B] k f 10 −4 = = = = 100 [A] k r 10 −6
(2)
The equilibrium concentration of B is 100 times that of A whether or not an enzyme is present. However, in the absence of an enzyme the reaction could take more than an hour to approach this equilibrium, whereas in the presence of an enzyme, equilibrium could be attained within a
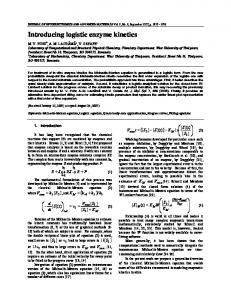
2 second. The enzyme lowers the height of the energy barrier to the reaction thereby increasing the rate of the reaction, but since the rate of both the forward and reverse reaction are affected by the same amount, the equilibrium constant is not affected by the presence of the enzyme. the same amount (see Figure 1)
Figure 1 where, EAf is the activation energy for the forward reaction (AÆB) in the absence of a catalyst and E’Af is the activation energy for the forward reaction (AÆB) in the presence of a catalyst, and ∆Go is the change in free energy for the reaction. The equilibrium constant is related to ∆Go as follows:
K eq = e
−∆G o / RT
Since ∆Go is the same for the catalyzed and uncatalyzed reaction, Keq is the same for both reactions.
One reason for the efficiency and specificity of an enzyme is the way the enzyme interacts with the reactant molecule, more commonly known as the substrate, in enzyme catalyzed reactions. The enzyme and substrate interact to form an enzyme-substrate complex. The interactions between the substrate and active site are weak, noncovalent interactions (i.e. the substrate does not covalently bind to the active site but weakly interacts with it through interactions like hydrogen-bonding, van der Waals interactions, etc). The orientation in which the two interact
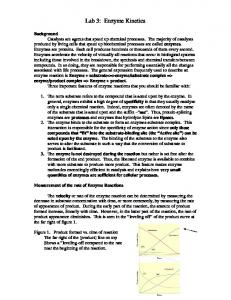
3 is highly favorable for facilitating conversion of the substrate to product. In the enzymesubstrate complex, the substrate molecule binds to a very specific region of the enzyme molecule called the active site. These active sites are highly selective for a specific substrate molecule with which the enzyme binds. This is why enzymes are such highly specific catalysts, catalyzing a single reaction, or a set of closely related reactions. There are two proposed models to explain the specificity of the interaction between the substrate molecule and the active site of an enzyme. (a) The “lock and key” model – in this model the substrate has a shape matching the enzyme’s active site (see figure 2)
Figure 2
(b) The “induced fit model” – the active site has a shape complementary to that of the substrate after the substrate is bound (see figure 3)
4 Figure 3
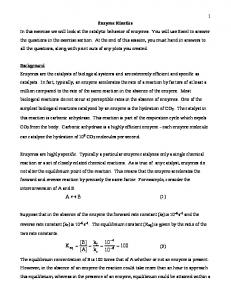
Enzyme kinetics The mechanism of enzyme catalyzed reactions is often studied by making kinetic measurements on enzyme-substrate reaction systems. These studies include measuring rates of the enzyme-catalyzed reactions at different substrate and enzyme concentrations. Here we will look at a simple model for the catalytic behavior of an enzyme and the kinetic model that arises from this model. For many enzymes, if we were to plot the rate of catalysis, V (also known as the reaction velocity), vs. the substrate concentration, [S] (at a fixed enzyme concentration) we would see a plot as shown in figure 4.
Figure 4
Looking at this plot, we see that V varies linearly with [S] for small [S]. As [S] increases, V “plateaus” indicating that V becomes independent of [S] at large values of [S]. The simplest model which accounts for this behavior is: k1
k2
E + S↔ ES→ E + P
(3)
k −1
where E is the enzyme, S the substrate, ES the enzyme-substrate complex, P the product of the enzyme-catalyzed reaction, k1 the rate constant of the forward reaction of E+S, k-1 the rate of the reverse reaction where the enzyme-substrate complex, ES, falls apart to E+S and k2 the rate constant of the forward reaction of ES forming E+P. In this model, it is assumed that none of
5 the product reacts with the enzyme to form the enzyme-substrate complex, ES (this is true during the initial stages of the reaction when [P] is low, but towards the end of the reaction when [P] is high this may no longer be true). We need to derive an expression that relates the reaction velocity, V, to the concentrations of the substrate and enzyme and the rates of the individual steps. From equation (3) the reaction velocity, V can be expressed as:
V = k2 [ES]
(4)
Since ES is an intermediate and hence its concentration unknown, we have to express [ES] in terms of known values. The rates at which [ES] is formed and falls apart are: Rate of formation of [ES] = k1 [E] [S]
(5)
Rate at which [ES] falls apart = (k-1 + k2) [ES]
(6)
We can use the steady-state approximation to express V in terms of known quantities. Under the steady-state approximation, the concentration of the intermediate [ES] stays a constant, while the concentrations of reactants and product change. The steady state occurs when eqn 5 = eqn 6 i.e.
k1 [E] [S] = (k-1 + k2) [ES]
(7)
[E][S]k1 k −1 + k 2
(8)
Rearranging,
[ES] =
Define, KM, the Michaelis constant, as
KM =
k −1 + k 2 k1
(9)
[E][S] KM
(10)
Substituting (9) into (8)
[ES] =
Since in most situations the enzyme concentration is very small ([E] >KM, so that [S]/([S]+KM) approaches 1. In this limit, we can express Vmax (from (15)) as: Vmax = k2 [Eo]
(16)
Substituting (16) into (15),
V = Vmax
[S] [S]+ K M
(17)
If we were to plot V vs S the resulting plot will have a shape as shown in figure 4. Hence, equation (17) describes the kinetic behavior of an enzyme as modeled by the kinetic scheme in equation (3). Looking at equation (17) at very low [S], when [S] >KM, V=Vmax and hence independent of [S] (the “plateau” region of the plot in figure 4). Equation (17) can be re-arranged as:
1 1 1 K = + M V Vmax Vmax [S]
(18)
If we were to plot 1/V vs. 1/[S] we would obtain a straight line with a y-intercept = 1/Vmax and a slope =KM/Vmax (see figure 5). This plot is called a Lineweaver-Burke plot.
y = 2.055E+05x + 1.284E+05
1/[S]
Figure 5
Significance of KM From equation 18, when [S] = KM, then V=Vmax/2. Hence KM is equal to the substrate concentration at which the reaction rate is half its maximum value. In other words, if an enzyme has a small value of KM, it achieves its maximum catalytic efficiency at low substrate concentrations. Hence, the smaller the value of KM, the more efficient is the catalyst. The value of KM for an enzyme depends on the particular substrate . It also depends on the pH of the solution and the temperature at which the reaction is carried out. For most enzymes KM lies between 10-1 and 10-7 M.
8 Determining KM and Vmax experimentally To characterize an enzyme-catalyzed reaction KM and Vmax need to be determined. The way this is done experimentally is to measure the rate of catalysis (reaction velocity) for different substrate concentrations. In other words, determine V at different values of [S]. Then plotting 1/V vs. 1/[S] we should obtain a straight line described by equation (18). From the y-intercept and the slope, the values of KM and Vmax can be determined. For example, use EXCEL to plot the data shown below. Fit the data to a straight line, and from the equation of the straight line determine the values of KM and Vmax. [S] (mM) 8.33 5.55 2.77 1.38 0.83
V (mM/sec) 3.62E-06 3.39E-06 2.75E-06 1.99E-06 1.49E-06
1/[S] (mM-1) 0.12 0.18 0.36 0.72 1.2
1/V (sec/mM) 2.76E+05 2.95E+05 3.64E+05 5.02E+05 6.73E+05
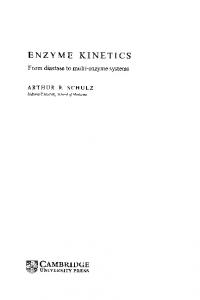
You should obtain a plot as shown in figure 6 below. From the fit to the data show that KM = 1.6 for this data and Vmax is 4.32 x 10⁻⁶ mM/sec
8.00E+05
y = 3.700E+05x + 2.311E+05
7.00E+05 6.00E+05 5.00E+05 4.00E+05 3.00E+05 2.00E+05 1.00E+05 0.00E+00 0
0.2
0.4
0.6 1/[S]
0.8
1
1.2
1.4
9 Figure 6
10 EXERCISES Use Excel to answer the questions given below. 1) In a typical experiment to characterize an enzyme, KM and Vmax need to be measured. To do this, first a series of experiments are run, where for a given initial substrate concentration, the rate at which the product is formed is monitored. The rate of product formation is monitored by measuring the product concentration as a function of time. A plot of concentration of product vs. time will be linear at short time (as long as most of the substrate molecules have not reacted) and the slope of the linear fit to the data is the rate of product formation for a given initial substrate concentration. This is the rate of the reaction (V). The experiment is repeated for different initial substrate concentrations (keeping the enzyme concentration fixed) and the rate of product formation at each of these substrate concentrations determined. This series of experiments results in a set of data: reaction rates (V) as a function of substrate concentration [S]. Using this data a plot of 1/V vs. 1/[S] is constructed – this plot should be linear as dictated by equation (18), and from the linear fit KM and Vmax are determined. You will use Excel to analyze data from an experiment of the type just described to determine the KM and Vmax that characterizes the enzyme used. Open the file “exercise1” in Excel. (Give the file a new name [File -> SAVE AS], save to DISK, and work from this saved file.) This file contains the data from five runs (RUN 1 to RUN 5) monitoring the product concentration as a function of time for different initial substrate concentrations (all carried out with the same enzyme concentration). Plot each data set as product concentration vs. time. Fit the data to a straight line and determine the slope. The slope is the rate of the reaction, V, for a particular value of [S]. Note: In the “Add Trendline” dialog box (accessed from the Chart menu), first select “Linear” (for a linear fit to the data) and then click on Options and select the “Display equation on chart” option. This should show the equation of the straight line fit to the data. Double click on the equation. This will bring up another dialog box. Click on the “Number” option and choose Scientific and increase the number of decimal places to 3. You should end up with five values of V for each of the five values of [S]. Plot 1/V vs. 1/[S] and determine KM and Vmax from the straight line fit to the data and equation 18.
11 Submit a printout of the plot of 1/V vs. 1/[S] and report the values of KM and Vmax.
2) Open file “exercise2” in Excel. (Give the file a new name [File -> SAVE AS], save to DISK, and work from this saved file.) This file contains a series of data from three experiments. In each experiment, the reaction rates (V) were monitored as a function of substrate concentration [S], but in each of the three experiments a DIFFERENT ENZYME was used. The concentration of the enzymes was kept fixed, as well as the pH of the solution and the temperature of the reaction. In addition, the V’s for each experiment were determined for the same substrate concentration. From the data given, plot Lineweaver-Burke plots for each experiment, determine which enzyme (X, Y or Z) is catalytically most efficient, and explain why. Submit printouts of the plots you created along with your calculations for KM. 3) Auxiliary questions: (i)
What are the units for KM and why does this constant have these units?
(ii)
In the Michaelis-Menten Scheme, what would happen to V (equation 15) if, instead of making the steady-state approximation, you assumed that the enzyme-substrate complex (ES) were in equilibrium with E+S? Show what approximation you would need to make in the steady-state result for V to get the equilibrium result for V.