the Phycocyanin a Subunit Phycocyanobilin Lyase* ... Phycocyanin is a phycobiliprotein that bears adducts of PCB ..... tured by removal of urea by dialysis.
THEJOURNAI. OF BloLoGlrnL CHEMISTRY 0 1994 by The American Society for Biochemistry and Molecular Biology, Inc.
Vol. 269,No. 12, Issue of March 25, pp. 8686-8694, 1994 Printed in U.S.A.
Oligomeric Structure, Enzyme Kinetics, and Substrate Specificity of the Phycocyanin a Subunit Phycocyanobilin Lyase* (Received for publication, October 12, 1993, and in revised form, December 28, 1993)
Craig D. Fairchild4 and Alexander N. Glazers From the Department of Molecular and Cell Biology, Uniuersity of California, Berkeley, California 94720
Phycobiliproteins carry linear tetrapyrrole chromopeptidewithinnative phycobiliproteins greatly affect their phores (bilins) thioether-linked to specific cysteine resi- spectroscopic properties. Generally, a native phycobiliprotein dues. The process of bilin attachment to apoprotein in has a strongly enhanced long wavelength visible absorption vivo has been characterized for only one bilin attach- peak anda much higherfluorescence quantum yield relative to subunit its denatured form or to bilin not associated with protein. ment site on one phycobiliprotein, that on athe of phycocyanin (apc).In the cyanobacterium SynechoPhycocyanin is a phycobiliprotein that bears adductsof PCB coccus sp. PCC 7002, the additionof phycocyanobilin to a t residues a-Cys-84 and p-Cys-82 and p-Cys-155. PCB reacts apo-aPCis catalyzed by the protein productsof the cpcE spontaneously with apophycocyanin in vitro at a-Cys-84 and and cpcFgenes. We have purified and further characterp-Cys-82 (but not a t p-155), to form an unnatural adduct, 3‘ized the recombinant CpcE and CpcF proteins. CpcE cysteinylmesobiliverdin, which contains an extra double bond and CpcF form an enzymatically active 1:l complex (Cpbetween carbons 2 and 3 of ring A of the bilin (5, 6). PEB also cEF), stable to size exclusion chromatography. CpcEF causes a reductionin apc fluorescence and strongly af- reacts at a-Cys-84 and 6-Cys-82 to form a similar adduct with fects its absorption spectrum buthas no effect on the p a double bond at C2-C3 of ring A (7). In the cyanobacterium Synechococcus sp. PCC 7002, the atsubunit. TheCpcEF bilin additionactivity exhibits simple Michaelis-Menten kinetics with respect to the tachment of PCB to the a subunit of phycocyanin (apc)is cataapo-aPCand to bilin. CpcEF also catalyzes the addition lyzed by a specific protein bilin lyase, which is encoded by the of phycoerythrobilin to apo-aPc; phycoerythrobilin is genes cpcE and cpcF. The phycobiliproteins of this organism thought to be on the biosynthetic pathway of phycocya- have eight PCB attachment sites on seven polypeptides. Inacnobilin. CpcEF shows a preference for phycocyanobilintivation of cpcE or cpcF by interposon insertion leadsto loss of relative to phycoerythrobilin, both in binding affinity correct bilin attachment toapc but not to any of the otherPCB and in the rate of catalysis, sufficient to account for attachment sites (8, 9). The protein products of these genes, selective attachment of phycocyanobilin to apo-aPC. CpcE and CpcF, have been expressed separately inEscherichia coli and shown to catalyze together thecorrect addition of PCB to apo-aPc (10). A number of genes with varying degrees of In cyanobacteria and red algae, phycobiliproteins are the homology to cpcE and cpcF have been characterized in other major components of a thylakoid membrane-associated macro- cyanobacteria (for a review see Ref. ll),although none of these molecular light-harvesting complex, the phycobilisome (1).The has been shown to encode a protein bilin lyase. The present study presents further characterization of CpcE phycobiliproteins carry covalently attached linear tetrapyrrole prosthetic groups (bilins). In different species, the number of and CpcF and of their enzymatic activity. Purification schemes different bilins on the various phycobiliproteins ranges from for recombinant CpcE and CpcF are presented. The purified proteins wereused to establish thatCpcE and CpcF form a 1:1 one to three, and the number of distinctattachmentsites complex, which is henceforth termed CpcEF. Various assays for ranges from eight to more than 20. The bilins phycocyanobilin (PCB)’ and phycoerythrobilin catalysis and substrate binding failed to show any activity for (PEB) can be cleaved from phycobiliproteins by refluxing in the individual CpcE or CpcF polypeptides. of Since PEB isa biosynthetic intermediate in the formation methanol (2, 3). This treatment results in the elimination of a phycobiliprotein cysteine fromthe 3‘carbon of the bilin to yield PCB in a red alga (12), and presumably in cyanobacteria as a linear tetrapyrrole withan ethylidene at theC-3 position (the well, the specificity of CpcEF for its bilin substrate is of parIUPAC numbering scheme for bilins and the structures of PCB ticular interest. Kinetic data presented hereshow that CpcEF, exhibalthough it can catalyze the addition of PEB to apo-aPC, and PEB is shown in Ref. 4). its specificity for PCB both in binding afflnity and the rate of The conformation and interactions of bilins with the polycatalysis. CpcEF has also been shown to catalyze the rapid transferof * This work was supported in part by National Institutes of Health Grant GM 28994 (to A. N. G.). The costs of publication of this article bilin fromholo-aPCto apo-aPc (10).This resultimplies that Cpbetween protein andbilin were defrayed in part by the payment of page charges. This article must cEF can access the thioether linkage therefore be herebymarked “aduertisement” in accordancewith 18 in apc,which shouldrequire at least partialunfolding of the holo U.S.C. Section 1734 solely to indicate this fact. subunit. In support of this notion, we report here that CpcEF $ Present address: University of CaliforniaBerkeleylLTSDA Plant alters the absorption and dramatically reduces fluorescence the Gene Expression Center,800 Buchanan St., Albany, CA 94710. emission of the a subunit, butnot the p subunit, of phycocyanin. (i To whom correspondence should be addressed: MCB:Stanley/ Donner ASU, 229 Stanley Hall, University of California, Berkeley, CA A change in thefluorescence of a holo subunit maybe a conve94720. Tel.: 510-642-3126;Fax: 510-643-9290. nient assayfor phycobiliprotein bilinlyases yet to be discovered. Theabbreviations used are: PCB, phycocyanobilin; PEB, phycoerythrobilin; cypc, C-phycocyanincy subunit; DTT, dithiothreitol;PAGE, EXPERIMENTAL PROCEDURES polyacrylamide gel electrophoresis; HPLC, high performance liquid CpcE and CpcFPurification-Crude CpcE and CpcF inclusion bodies chromatography;PCB*,addition-competentform of PCB;SEC, size were prepared and solubilized in 9 M urea at pH 1.9, as described exclusion chromatography; MBV, mesobiliverdin.
8686
Phycocyanin a Subunit Phycocyanobilin Lyase
8687
previously (10). The protein solution was brought mto M DTT 10 and pH oxide with mixing (the final concentration of dimethyl sulfoxide did not exceed 1.2% by volume). CpcE activity was assayed inthe presence of a 7.5-8.0by the addition of solid DTT and 1.5 M Tris-HC1, pH 8, and incubated at room temperature for 1 h. CpcE and CpcF solutions were 2-fold molar excess of CpcF and vice versa. CpcEF Kinetics-The rate of gain in uncorrected fluorescence emisthen ultracentrifuged (30 min at 100,000 x g ) and filtered through a 0.2-pm pore size membrane. Each solution (4-5 ml) was then exchanged sion at 640 nm was converted to the rate of formation of holo-aPc by comparison with the 640 nm emission of a known concentration of into 8 M urea, 20 mM Tris-HCI, pH 7.5 (plus 1 nm DTT for CpcF) by holo-aPc under assay conditions. passage through a Sephadex G-25 column (80-ml bed volume) in the The proportionof PCB* (addition-competent PCB; see Ref. 10) in the same solvent. Aliquots of each protein (9 ml, 35-40 mg of protein) wereloaded onto stock PCB was estimated as follows. An assay with a large amount of CpcEF (200-300 nM) was performed with20 &mPCB and 10 p~ apo-aPc. a Mono Q HR 10/10 column (Pharmacia LKB Biotechnology, Inc.) on a Under these conditions a clear, biphasic rate of fluorescence gain is Perkin-Elmer series 410 BioLC system; the column waspreequilislower, second rate was extrapolated back to the time brated in8 M urea, 20 nm Tris-HC1, pH 7.5, and the flow rate through- observed (10). The of mixing, and thislevel of fluorescence was taken as being a result of out was 4 mumin. The column was washed for 2 min in the starting the addition of all of the PCB* to apo-aPc. This fluorescence was consolvent and then eluted with a linear gradient of NaCl in the same verted into a concentration by comparison with a solution of holo-aPc of solvent: 35 min, 0-0.35 M NaCl for CpcE; 35 min, 0-0.2 M NaCl for CpcF. Two-ml fractions were collected. The fractions were evaluated by SDS- known concentration. The higher concentrations of PCB used in some assays were suffiPAGE, and those containing CpcE or CpcF werepooled, brought to5 mM cient to reduce the observed fluorescence by attenuation of the excitaDTT, and acidified to pH 2.5 with concentratedHCI. tion and emission energies (the so-called "trivial reabsorption" phenomReverse-phase HPLC was performed with a semipreparative scale C, enon). For experiments where [PCB] varied, the function relating apc column (Hi-Pore RP-304, Bio-Rad) in the solvent system used for the empirically. This separation of phycobiliprotein subunits (13):aqueous, 0.1% trifluoro- fluorescence reduction and [PCB]wasdetermined acetic acid; organic,2:l acetonitri1e:isopropyl alcohol, 0.1% trifluoroace- function was then usedto correct the ratesof fluorescence gain in each tic acid. Aliquots of CpcE (1.4 ml, 2 mg of protein) and CpcF (1.5 ml, 1.5assay. When [PCB] was held constant, this correction was not necessary; the conversion from fluorescence gain t o holo-aPc formed was mg of protein) Mono Q pools were loaded without further treatment made using a solutionof holo-aPc in 20 1"PCB. onto the C, column in 35% organic solvent, 3 mumin flow rate. The Kinetic parameters were determined by iterative curve fit t o the elution gradients, after 2 min at 35%organicsolvent,were:CpcE, 3 5 4 5 % organic in 2 min, 5.571% in 32 min; CpcF, 3 5 4 5 % organic in Michaelis-Mentenequation, V, = [SIV,,,,,/([Sl + K,,,), where S is the substrate whose concentration was varied and V, is the initial rate, 5 min, 5540% in 5 min, and 60-70% in 30 min. (Abelbeck Software), with weightCpcE and CpcF pools were reduced to 0.20 volume by rotary evapo- using the program KaleidaGraphTM ing proportional t o V, (15). The KI for PEB was calculated from the ration. Some precipitate formed during this step; this precipitate dissolved on dilution of the concentratedpools 1:2 (v/v) with 9 M urea-HCI, observed K , (K)) for PCB in the presenceof PEB using the formulas K: = dm and a = 1 + [Il/KI. 10 m Tris-HC1, pH 2.5. The pools were dialyzed against the urea For comparison of the rates of the CpcEF-mediated additionof PEB diluent containing 1 nm DTT. Dialyzed CpcE and CpcF were stored at of bilin, larger 4 "C (DTT was added tothe CpcF solution to a final concentrationof 5 or PCB to apo-aPc in near saturating concentration volume reactions were used (3 ml), and assays were allowed to proceed mM). , was 10 p ~ and , Renaturation of CpcE and CpcF-For assay of fractions from chro- for 5 min. Bilin concentrations were 20 p ~ apo-aPc CpcEF was 2.0 nM for the PCB reactions and 30nM for PEB reactions. matography, CpcE or CpcF solutions in urea (HPLC fractions were reduced t o 0.20 volume by evaporation with a streamof N, and diluted Reactions were quenched by the addition of 0.25 volume of cold 50% (w/v) trichloroacetic acid. The quenched assay mixtures were kept at 1:5 with 9 M acid-urea) were diluted1 : l O (v/v) into 50 mM Tris-HC1, pH 8, 75 nm NaCl, and clarified by centrifugation; small aliquotsof these -20 "C overnight. Protein precipitates were collected by centrifugation a t 4 "C, dissolved in 0.3 m18M urea-HC1,lO mM 2-mercaptoethanol, pH solutions were then used in the bilin addition assays. 2.5, and protein separatedfrom unreacted bilin by Sephadex G-25 chroFor all other studies, purified CpcE, CpcF, or CpcE and CpcF stock matography in the same solvent (20-mlcolumn volume). The first 280 solutions in9 M acid-urea were dilutedto final concentrations: 45pg/ml nm-absorbing peak wascollected in each case, in volume a of 1 ml, and CpcE; 30 pg/ml CpcF in 3 M urea, 150mM Tris-HC1, pH 8,O.1mM MgCl,, 1 nm thioglycolate. These solutions were then dialyzeda t 4 "C against its absorption spectrum was taken with the urea solvent as a reference. The spectra from the +CpcEF and -CpcEF reaction mixtures were 75 nm NaCl, 50 mM Tris-HC1, pH 8, 1.1 m MgCl,, 1 nm disodium adjusted to the sameA,,, with a n allowance for the absorbance caused pyrophosphate, 1 mM thioglycolate. For some experiments the renatured proteins were concentrated by ultrafiltration with a 10.000 mo- by CpcEF. This was doneto correct for unequal recovery of the protein from the reactions and does have a significanteffect on the final values lecular weight cutoff membrane (YM-10, funicon). Protein solutions were then ultracentrifuged (30 min, 100,000 x g ) and filter-sterilized determined (the factors were 1.039 for +CpcEF PEB, and 1.095 for -CpcEF PCB). Since PEB and PCB adducts have some absorbance at through a 0.2-pm filter prior to storagea t 4 "C. small underestimationof the CpcEFDetermination of CpcE a n d CpcF Concentrations-The concentra- 280 nm, the adjustment leadsa to tions of impure CpcE and CpcF, and of CpcE renatured together with mediated addition rates,which should to some extent cancel out in the ratio of these rates. the variouspools of purified CpcF, were determined by SDS-PAGE and The amount of CpcEF-mediated adduct formation was determined comparison of Coomassie-stained bands with protein standardsrun on from the difference spectra, +CpcEF minuscontrol, using thefollowing the same gel. extinction coefficients for bilin peptides in 8 M acid-urea: PEB adduct, Concentrations of solutions of purified CpcE and CpcF were deter= 53,700 M-' cm-' (16); PCB adduct, P 3 = 33,800 M" cm-' (17). mined spectroscopically, with czSo calculated from the Trp and Tyr conOther Methods-PCB and apo-aPc,holo-aPC,and holo-P phycocyanin tent ascertained from the amino acid sequences: under denaturing conwere prepared, and their concentrations were determined a s described ditions, 35,640 cm" (A;: = 1.22/cm) for CpcE and 20,220 M - I cm-' previously (10). Denatured apo-aPc was prepared from protein exposed A (:: = 0.91/cm) for CpcF; under native conditions, P o of 38,440 M-' cm" A (::: = 1.32/cm) for CpcE and 21,060M-' cm-' (A:$ = 0.95/cm) for to 10 nm D m , dialyzed extensively against 5 m ammonium acetate, CpcF (14). The concentration of native CpcEF was calculated assuming and lyophilized. Thelyophilized protein was suspended a t 16 mg/ml in 8 M urea, 75 nm NaCl, 50 nm Tris-HC1, pH 8, and diluted1:lO in assay a 1:l ratioof CpcE to CpcF. Assays for the Additionof Bilin to apo-aPc-All addition assays were buffer. PEB was prepared as described previously (7). The main PEB peak performed at 37 "C on a Perkin-Elmer MPF-44B fluorescence spectrophotometer with slit widths of 5 nm for excitation and 8 nm for emis- from reverse-phase HPLC purification was used for the experiments presented here, and its concentration was determined using the c594 of sion, in a square cuvetteof 4-mm path length. PEB dimethyl ester (25,200 M - I cm"; Ref. 18)with PEB diluted into 5% For relative CpcEF activity with PCB as the bilin substrate, the increase in uncorrected 640 nm emission with 600 nm excitation was (v/v) HCl in methanol. monitored continuously over time. For each concentration of apo-aPc RESULTS and PCB, the nonenzymatic rate of fluorescence gain was determined with an aliquot of the appropriate buffer in place of CpcEF. Unless Recombinant CpcE and CpcF proteins were subjected to two otherwise noted, each reaction mixture contained 75 mM NaCl, 50 mM purification steps under denaturing conditions: ion exchange Tris-HC1, pH 8.0, 1 nm MgCl,, 1 nm disodium pyrophosphate, 1 mM thioglycolate. The latter three ingredients were added toapo-aPc and chromatography in 8 M urea on Mono Q, and reverse-phase C4 Tris-NaCI with mixing, after which CpcEF was added with mixing, and HPLC. Fractions were analyzed by SDS-PAGE and pooled fracthen the assay was initiated by the addition of bilin in dimethyl sulf- tions by a bilin addition assay.
Phycocyanin
8688
(Y
Subunit Phycocyanobilin Lyase
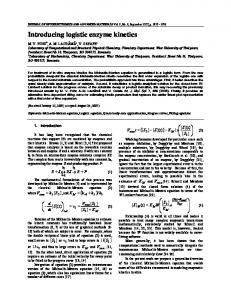
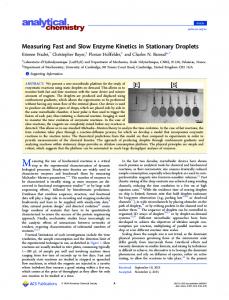
ing organic solvent. The 29-kDa polypeptide eluted in 67.5% organic solvent; CpcE activity in the bilin addition assays correlated with this peak. The final punty of the 29-kDa CpcE fraction is illustrated inFig. lC, lane1. The 28.5-kDa polypeptide eluted a t a much lower organic solvent content, around 54%;it lacked CpcE activity in the bilin addition assays. 29 -1 Purification of CpcF-CpcF protein overexpressed in E. coli is to some extent lost in the soluble fraction of cell lysate (Fig. 1 B , lane 1 ), but thebulk of CpcF ultimately is solubilized only in acid-urea (lane 4 ). Polypeptides of the apparent molecular mass of CpcF (22 kDa) eluted in three peaks from the Mono Q column. These c l 2 3 4 5 were pooled separately and are referred to below as early, main, and late. The three Mono Q pools of CpcF were purified further 66 by reverse-phase HPLC. The 22-kDa polypeptide of the main 45 Mono Q fraction eluted in 64% organic solvent. That of the early Mono Q fraction eluted in two peaks, in 63%(early-1) and 65%(early-2)organic solvent.That of the latefraction eluted in 65%organic solvent. To assess the relative activity of these four CpcF fractions, 12.4 - each was renatured in the presence of active CpcE. By SDSPAGE, the concentration of CpcE and CpcF in each renatured protein mixture was roughly equivalent. The resultsof the bilin FIG.1. CpcE and CpcF proteins overexpressed in E. coli. Coo- addition assays for each, expressedas the percent of main CpcF massie-stained SDS-polyacrylamide gels (Laemmli system (19),monoactivity, were: main, 100%; early-1, 29%; early-2, 64%; late, polyacrylamide stacking gel). Sizestandards mer:bis ratio of 37.5, 10% 19%.Although assay error and disparity in enzyme concentra(in kDa) were: bovine serum albumin, 65;ovalbumin, 45;carbonic anhydrase, 29;avidin, 18;horse heart myoglobin, 17; hen egg white ly- tion may account for some of the variation observed, it isclear sozyme, 14.4; cytochrome c, 12.4. The predicted molecular mass for that all of the CpcF fractions, with the possible exception of CpcE is 29.2 kDa and for CpcF is 22.2 kDa. For the gels inpanels A and B,the amount loaded in each lane is a similar percentage of the prepa- early-2, have lower activity when renatured in thepresence of ration at each step. Panel A, CpcE expression; 14% polyacrylamide. CpcE than does main CpcF. The mainfraction of CpcF was used Lanes 1 and 2, whole cells solubilized and samples trichloroacetic acid- in all experiments described below. The final purity of this precipitated, uninduced (lane 1 ), and induced (lane 2 ) with isopropyl- fraction of CpcF is illustrated in Fig. lC, lane 5 . 1-thio-P-n-galactopyranoside;lane 3 , supernatant from centrifugation Evidence for Physical Interaction between CpcE and CpcFof cell lysate; lane 4, 1% Triton X-100wash of the pellet from cell lysis; The SDS-polyacrylamide gel of the renaturation products of lane 5, supernatant of acid-urea solubilization of washed inclusion bodies. Panel B,CpcF expression; 12% polyacrylamide. Lane 1, superna- CpcE, CpcF, or both together (Fig. 1C) illustrates three intertant from centrifugation of cell lysate; lane 2, 1% Triton X-100wash of esting points. First, themolar ratio of CpcE to CpcF left soluble the pelletfrom cell lysis; lane 3,50mM Tris-HC1, pH8,wash of the pellet after renaturation is approximately 1:l (Fig. lC, lane 3; the from the detergent wash; lane 4 , supernatant of acid-urea solubilization of washed inclusion bodies. Panel C, purified CpcE and CpcF, 146 ratio of Coomassie stain densities is3:2, the approximate ratio polyacrylamide. Lanes 1 (CpcE) and 5 (CpcF), purified proteins in 9 M of calculated molecular masses CpcE:F). This ratio is mainacid-urea. Lanes 2 (CpcE), 3 (CpcEF), and 4 (CpcF) are proteins rena- tained even with renaturation of higher concentrations of CpcE tured by removal of urea by dialysis. CpcE and CpcEF had been con- and F (greater than0.2 mg/ml each), when most of the protein centrated by ultrafiltration. is lost to aggregation. Second, on storage of renatured CpcE at Purification of CpcE-The result of an inclusion body prepa- 4 "C slow proteolysis takes place (Fig. lC, lane 2); this proteration of recombinant CpcE is shown in Fig. LA. As described olysis is retarded in the presence ofCpcF. Third, CpcEF topreviously (lo), when the cpcE gene is induced with isopropyl- gether can be concentrated by ultrafiltration without substan1-thio-P-D-galactopyranoside, three new bands become appar- tial loss of activity (to a t least 0.8 mg/ml), whereas CpcF, ent on SDS-PAGE of solubilized E. coli cells (Fig. LA, lanes 1 although itcan be concentratedin soluble form, loses nearly all and 2): a band with apparent molecular mass 31 kDa, and two of its activity in theprocess. CpcE can be concentrated to a limit closely spaced bands of 29 kDa (labeled CpcE) and 28.5 kDa. of about 0.3 mg/ml without loss of activity. Most of the 28.5-kDa band islost in thesoluble fraction of cell CpcE and CpcF proteins, separately renatured,can be comlysate (lane3), and what remains after washing and is solubi- bined to yield active enzyme, although theactivity is less than lized in acid-urea solutionis predominantly the 29- and 31-kDa that for co-renatured CpcEF(Table I, line 3, compared with line bands (lane 5 ) .The amountof the 29- and 31-kDa bands rela- 1).Extra CpcE, with the amountof CpcF held constant, led to tive to that of the 28.5-kDa band varies from preparation to an increasein addition activity withseparately renatured propreparation of CpcE-producing cells, and some preparations teins (Table I, lines 4 and 51, but additional CpcE added to contained almost exclusively the 28.5-kDa product. co-renatured CpcEF did not increase addition activity (line 7; The 31-kDa polypeptide eluted from the Mono Q column in compare with line 1). Extra CpcF, whether withseparately two peaks early in the NaCl gradient; these fractions did not renatured CpcE (Table I, line6)or co-renatured CpcEF (line 8), exhibit any CpcE activity in bilin addition assays andwere not not only does not increase addition activity, but it may inhibit purified further. The 28.5-kDa polypeptide coeluted with the i t slightly. earliest eluting 31-kDa peak. In a separate preparation enThat both CpcE and CpcF are required for bilin addition riched for the 28.5-kDa polypeptide, this peak was collected for activity, along with the additional evidence discussed above, further purification. The 29-kDa polypeptide eluted later in the together suggested that thetwo proteins might form a complex NaCl gradient than the 31-kDa peaks and was collected for of 1:l stoichiometry. To test this hypothesis, SEC was perfurther purification. formed with renatured, CpcE, CpcF, and CpcEF concentrated Portions of the 28.5- and 29-kDa Mono Q fractions were by ultrafiltration; 280 nm absorbance profiles are shown in Fig. loaded onto a C4 column and elutedwith a gradient of increas- 2, and the apparent molecular masses of these and other pro"
"""
"
Phycocyanin aPhycocyanobilin Subunit
Lyase
8689
TABLEI1 TABLEI Apparent molecular mass of proteins by HPLC SEC relative to Bilin addition activity of CpcE and CpcF renatured separately and globular protein standards together CpcE and CpcF where separatedby a slash were renatured together; Calculated Apparent mass sample mass Protein where separated by a plus sign they were renatured separately. Bilin kDa kDa addition activity is expressedas either the gain in relative fluorescence (with the rate of nonenzymatic gain in fluorescence, 5.05 min", sub48 51.4" CpcEF renatured together tracted from each) or as the percent activity relativet o the first entry. 30 29.2 "29 kDa" CpcEh 21 ? "28.5 kDa" CpcEb Gain relative in Relative 19 18.2 Holo-a PC addition fluorescence Enzyme Apo-a PC 17 17.6 (per min) activity %
1. 1 p~ CpcE/CpcF 2. 0.5 p~ CpcE/CpcF 3. 1 V M CpcE + 1 PM CpcF 4. 2 V M CpcE + 1 PM CpcF 5. 3 p~ CpcE + 1 PM CpcF 6. 1 p~ CpcE + 2CpcF 7. 1 p~ CpcE/CpcF + 1 p~ CpcE 8. 1 p~ CpcE/CpcF + 1 p~ CpcF
*
4.53 0.10" 1.93 1.45 3.00 3.52 1.19 4.71 3.99
(100) 42 32 66 78 26 104 88
Calculated mass for a CpcEF heterodimer. Theapparentmolecularmassesdetermined given in quotation marks.
by SDS-PAGE are
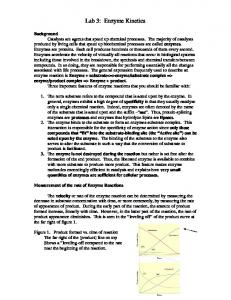
sembled the sum of the profiles of the two components. SDSPAGE analysis of fractions from SEC of CpcEF, apo-ape, and the two mixed together reinforce this analysis (not shown). The 28.5-kDa product of the CpcE preparation was renatured alone and in thepresence of CpcF and subjected to SEC. 1p~ CpcE/CpcF the results from two assays were averaged and the The 28.5-kDa protein eluted in a sharp peak with an apparent observed range is indicated. molecular mass of 21 kDa, and itselution was unaltered in the sample renatured with CpcF. Whether themobility of the 28.50.05 670 158 45 17 kDa polypeptide is anomalous on SDS-PAGE or SEC or both is not clear. Quenching of Holo-aPc Fluorescence Emission by CpcEF-It has been demonstrated that CpcEF can transfer the bilin of holo-cyPCto apo-cyPc (10). Todo this, CpcEF presumably must access the thioetherbond that links the bilin to the polypeptide chain of holo-aPC,a bond that isburied in thefolded subunit. If this notion is correct, interaction of CpcEF with holo-cyPCmust require, at the least, disruption of the local environment of the chromophore. Any such disruption should result in changes in c the absorbance and emission spectra of the cy subunit. FurtherF? o , , , , , , , , , , more, these spectroscopic changesshould only occur when 4 6 8 10 12 14 CpcEF is mixed with the a subunit, not with the p subunit of Time (min) phycocyanin. FIG.2. Size exclusion chromatography of CpcE,CpcF, and Spectroscopic changes are in fact observable upon mixing of CpcEF. HPLC SEC was performed with a 300 x 7.5 mm Bio-Si1 TSK250 column (Bio-Rad). The solvent was 100 mM Napi, pH 6.8, at a flow CpcEF with ape, or the MBV adduct of apo-aPC,but not with p rate of 1 mumin; 100 pl of protein solution was injected. Upper truce, phycocyanin. As shown in Table 111,the fluorescence of holo-aPC CpcEF. Middle truce, CpcE. Lower trace, CpcF. 100-pl injections con- is reduced in the presence of CpcEF. The fluorescence of p tained 47 pg of CpcEF; 4.8 pgof CpcE; and 11pg of CpcF. The elution phycocyanin is unalteredby CpcEF. The extentof fluorescence times of A,,, peaks corresponding to globular protein standards are marked withurrows: thyroglobulin (670 kDa), 6.25 min; y-globulin t 158 loss of holo-aPCdepends on the ratioof CpcEF to ape as well as kDa), 9.50 min; ovalbumin (45 kDa), 11.00 min; and myoglobin (17 the concentration of cypc. Compare the first line of Table I11 kDa),13.00min.Theriseinaround14miniscaused by buffer with the first line of Table IV; both are 1:l ratios of CpcEF to components; subtraction of the chromatogram of CpcF renaturation ape, but thereduction of fluorescence at 642 nm in the mixture buffer (not shown) from that of CpcF protein did not reveal any late with 1.5 p~ apc is 49%, whereas thatof the mixture with 0.77 eluting Azso peak. PM apc is only 35%. teins of interest relative to globularprotein standards are The absorbance spectrum of holo-cyPCin the presence of sufof CpcE is consistent withits ficient CpcEF to cause a 71% loss of fluorescence emission at listed inTable 11. The elution time monomeric molecular mass. CpcF, however, elutes as a broad 642 nm has two notable features (Fig. 3A). First, the ratio of region of 280 nm absorbance. As noted above, concentrated the absorbance peaks red:near U V is shifted from 4.2 without CpcF lacks addition activityin thepresence of CpcE; active (not CpcEF to 0.8 with CpcEF. This change is the result of increase concentrated by ultrafiltration) CpcF was also loaded onto the in the nearUV peak and decrease in thered peak. Second, the size exclusion column, but no substantial 280 nm absorbance near UV peak is sharpened, with a A, of 364 nm, in the eluted in the size range of 15-670 kDa, nor did any fractions presence of CpcEF. The reasonfor splitting of the nearUV peak collected contain CpcF activity (not shown). in apc in the absence of CpcEF is not known; although this The elution time of the main CpcEF 280 nm peak is consist- preparation of apc had this feature, others prepared by the ent with the calculated molecular mass of a 1:l complex of same method have a single, broad peak at 357 nm and a red: CpcE and CpcF (Table 11). Furthermore, the presence of both near UV ratio of 3.3 (see Ref. 20). CpcE and CpcF proteins andCpcEF activitycorrelate well with The fluorescence emission spectrum of ape with an amount the 280 nm peak (not shown). When separately renaturedCpcE of CpcEF sufficient to cause a 52% loss of emission at 642 nm and CpcF are mixed prior to SEC, the height of the 11.8-min (Fig. 3 A ) is not significantly shifted relativeto theapc emission CpcE peak is reduced, and there is a new (shoulder) peak spectrum in the absence of CpcEF. For these samples, the abeluting a t around 10.9 min (not shown). sorbance a t the excitation wavelength, 580 nm, was reduced Apo-ape, apc MBV adduct, holo-aPC,and PCB were individu- 20% in the presence of CpcEF. Thus, thereis a real reduction in ally mixed with CpcEF and the SEC elution profiles of the the quantumyield of apc in thepresence of CpcEF, here a 40% mixtures compared with those of the individual components. loss relative to that of cypc alone, and not just a change in The elution profiles of the mixtures in each case closely re- absorbance.
+
+ +
+
Phycocyanin a Subunit Phycocyanobilin Lyase
8690
TABLE111 Change influorescence emission of apt, P phycocyanin, and gC MBV adduct in the presenceof CpcEF The conditionsfor assay of addition of PCB to apo-aPc were used, but without eitherof the substrates. Phycobiliprotein was mixed with assay buffer, and the fluorescence emission was monitored until it stabilized. CpcE, CpcF, or CpcEF was then added, and the emission was again allowed to stabilize (5-10 min). The X,,c&,, (nm) were: a,P phycocyanin, 600/642; a-MBV adduct, 620/668. The change influorescence emission at the wavelength monitored is expressed as a percent relative t o a control mixture of phycobiliprotein plus the final dialysis bufferfrom CpcEF renaturation; a different control mixture was used for each line. Phycocyanin subunit
[CpcEFI
Ratio [CpcEFl: [biliproteinl
Change in emission ~
w 0.77 7.70 2.25 7.50 0.77
IC
0.77 VM a 0.77 PM a 0.56 PM a-MBV 0.75 PM a-MBV 0.77 PM
1:1 10:1 4: 1 1O:l 1:l
0.04 0.05i
-35.0 -71.0 -37.4 -50.6 +0.3
TABLEIV Change influorescence emission of phycocyanin subunits in the presence of CpcE or CpcF alone The change in fluorescence emission at the wavelength monitored is expressed as a percent, relativeto a control mixture of phycobiliprotein plus the final dialysis buEer(s)from CpcE or CpcF renaturation; three different control mixtures were used. Thecontrol mixture for lines 1-4 contained CpcE and CpcF dialysis buffers, that for 5 and 6, and that for 7 contained CpcE dialysis buffer. The A,,Jh,, (nm) were: a subunit, 600/642; P subunit, 590/630. CpcE, CpcF
Phycocyanin subunit (1.5PM)
Change in emission k 1.6")
1. 1.5 PM CpcEFb 1.5 2. PM CpcE + CpcF 3. 1.5 PM CpcE only 4. 1.5 VM CpcF only 5. 4.8 PM CpcE only 6. 2.2 PM CpcF only 7. 4.8 PM CpcE only
a a a a a a
-49 -25 +2.7 -2.2 +9.4
P
+10
%
-0.8
P
9
0.04
~
0.03
~
l
300
~
~
400
~
~
500 X (nm)
~
~
600
~
~
~
~
700
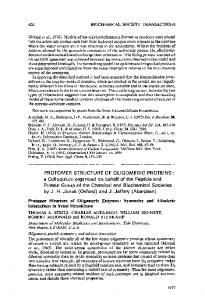
FIG.3. Absorbance and emission spectra of aPc CpcEF. Emission spectra were obtained as described Table in 111. Absorbance spectra were then takenof the mixtures, aftercooling to room temperature, in a 1-cm path length quartz cuvette on a Perkin-Elmer A6 spectrophotometer with assay mixture lacking protein as the reference. Thin lines, -CpcEF; thick lines, +CpcEF; solid lines, absorbance;broken lines, uncorrected fluorescence emission. Panel A , spectra of apc. Absorbance spectra of 0.77 p apc 2 7.7 VM CpcEF, fluorescence emission spectra of 0.63 VM apc k 1.9 V M CpcEF. Panel B , spectra of (xpc MBV adduct (0.75 PM) * 7.5 PM CpcEF. The MBV adduct of apo-aPc was prepared by nonenzymatic reactionof PCB with prereduced apo-aPc in 50 nm Napi, 5 mM EDTA, pH 7, as described previously for apo-ap phycocyanin (5).
Some measurements were taken in duplicate, and the mean perCpcF, when added together, reduce aPc fluorescence emission cent error is shown. (Table IV, line 2), albeit not as effkiently as when renatured CpcE and CpcF renatured together; entry 2 is separately renatured CpcE and CpcF. together to form CpcEF (line 1); this difference parallels that
The change in the absorbance spectrum of aPc MBV adduct in the presence of CpcEF (Fig. 3B) is similar t o that seen for holo-aPc (with its natural PCB chromophore). There is a n increase and sharpening of the nearUV peak, again with a slight shift in theA,, from 369 to 367 nm. Also, there is a decrease in the red peak but, as with apt, without a shift in the A,, which is 650 nm withor without CpcEF. The red:near UV ratio is changed from 3.0 to 1.3 in the presence of CpcEF, and the red peak is broadened somewhat. There isa substantial shift in the fluorescence emission spectrum of aPc MBV adduct in the presence of CpcEF (Fig. 3B). The peak is blue shifted, from 668 to 646 nm. Thus, although the reduction in emission a t 668 nm is 50%, there is little change in quantum yield: a loss of only 6% relative to that of aPCMBV adduct without CpcEF. With the reduction in absorbance at theexcitation wavelength factoredin (13% a t 580 nm), the change in quantum yield of the aPc MBV adduct in the presence of CpcEF, relative to that of apc MBV adduct alone, becomes positive, a 10% gain. Since the spectra are of uncorrected emission, and shifted, these quantum yields are only relative; nevertheless,it is reasonable to conclude that thereis no dramatic loss in the quantumyield of the apc MBV adduct in the presence of CpcEF. CpcE and CpcF were tested separately to assign functions to each subunit of the lyase. Separatelyrenatured CpcE and
observed for the bilin addition assay. Similar concentrations of CpcE or CpcF alone do not have a large effect on aPc emission (Table IV, lines 3 and 4), although CpcE may cause a slight gain in fluorescence and CpcF a slight decrease. A larger amountof CpcF does not cause a decrease (Table IV, line 6), but 3-fold more CpcE causes approximately a %fold greater gain in emission (line 5). However, this CpcE effect is not phycocyanin subunit-specific, since the higher concentration of CpcE yields a similar gain in emission for p phycocyanin (Table IV, line 7). Since CpcEF causes large spectroscopic changes in (Y subunits bearingbilin, the spectrumof the bilin substrate, PCB, in the presence of CpcEF was examined. After a 20-min incubation at room temperature, thePCB absorption spectrum in the presence of CpcEF showed a very slight decrease in the red: near U V ratio (6%) and a small red shift in the peak red A, (5 nm) relative toa control mixture (data notshown). There was no substantial, further change after a 7-h incubation. CpcE or CpcF alone had no significant effect on the absorption spectrum of PCB. There was no significant fluorescence for any of the mixtures at zero time or after 30 min. Kinetics of CpcEF-mediated Additionof PCB to Apo-gC-In the course of these investigations, a fresh preparation of PCB was found to contain a higher fraction of PCB* than previous preparations (2.0% compared with < 0.5%).This PCB had been prepared in the standard way but with rotary evaporation to a small volume, rather than to dryness, in the final step. This
~
~
Lyase Phycocyanobilin Phycocyanin a Subunit
8691 + CpcEF
....,..............PEB only
8
I
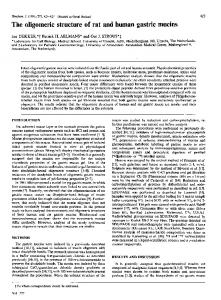
FIG.4. Rate of CpcEF mediated PCB addition toapo-aP" as a function of substrate concentration. Initial rates of holo-aPr formation (Vi) per 0.5-ml assay were determined as described under "Experimental Procedures." Panel A, initial rate versus [PCB], fit t o the Michaelis-Mentenequation.The data shown are from two separate dilution series of PCB; in each dilution, the final concentration of trifluoroacetic acid was 7.5% (prior t o addition to the assay mixture). These assays were performed in 150 mM Tris-HC1, pH 8, rather than 75 mM NaCl, 50 mM Tris-HCI, pH 8, to buffer theacid PCB solutions. The concentration of CpcEF was 15 n ~The . K,, for PCB from this fit is 1.2 (e0.2) p,the V,, 3.97 (k 0.31) pmol min". Panel B , initial rateversus [apo-aPc], fit to the Michaelis-Menten equation. The concentration of CpcEF was 10 nM. The K,,, for apo-aPC is 10.8(e 2.8) p ~ the , V,, 7.3 (k 1.4)pmol rnin". Insets, Lineweaver-Burk plots of each data set.
change resulted ina stock solution of PCB in approximately 1:l (v/v) trifluoroacetic acid:dimethyl sulfoxide rather than neat dimethyl sulfoxide. Dilution of this stock solution with dimethyl sulfoxide resulted in slow loss of PCB*. Some attempts were made to separatePCB* from bulk PCB by reverse-phase HPLC, but these were unsuccessful. The PCB stock solution containing 2% PCB* was used for all assays described below. A plot of the rateof holo-aPc formation uersus [PCB] and the linear fit to a Lineweaver-Burk plot of the same data demonstrate Michaelis-Menten kinetics with a K , for PCB of 1.2 PM (Fig. 4). If the real substratefor CpcEF is PCB*, a K,* of 24 nM ( 2 4 nM) can be calculated, equal to 2% of the K, for bulk PCB. Plots of the rateof holo-ape formation uersus [apo-aPC] similarly exhibit Michaelis-Menten kinetics, witha K,,, for apo-aPC of 10.8 PM (Fig. 4B).This result indicates that the PCB kinetic studies were performed in a subsaturating concentration of apo-aPc (10 p j , so the kcat of CpcEF was calculated from the apo-aPC data only and determined to be 1.5 ( 2 0.3) rnin". Since some rearrangement of apo-aPC may be required for CpcEF to access a-Cys-84, bilinaddition assays were performed with 3 PM denatured apo-aPCas a substrate. The rates of 640 nm emission gain were similar whether denaturedapoaPc was added 5 min before starting the reaction by the addition of bilin (2.49 arbitrary unitdmin), or the reaction was initiated by the addition of denatured apo-ape (2.82 unitdmin). The rateobtained with 3p~ native apo-ape was slightlyhigher (3.24 unitdminj. CpcEF Specificity for Bilin: PCB Versus PEB-PEB serves as a bilin substrate for CpcEF-mediated addition to apo-cwPC.PEB by itself in the assay buffer has significant fluorescence (Fig. 51, which does not change over time. As demonstrated for apo-aP phycocyanin (7), PEB forms a fluorescent adduct with apo-aPC nonenzymatically at a measurable rate. The predominant adduct formed is a 15,16-dihydrobiliviolin rather than PEB, as evidenced by a red shifted fluorescence emission maximum relative to PEB-containing proteins (Fig. 5; Ref. 7). In thepresence of CpcEF, the rateof gain influorescence is increased, and the product has a blue shifted emission maximum (Fig. 5). By subtraction of the PEB-only emission spectrum, thespectra of the nonenzymatic and CpcEF-mediated addition products can be derived. The 571 nm emission maximum for the
550
'
I
570
'
I
590
-
I
'
(
I
630
610
.
I
650
*
I
670
4
FIG.5. Fluorescence emission spectra of PEB and productsof PEB addition to apo-aPc z CpcEF. In standardbilin addition assay buffer, emission spectra of 20 p~ PEB only, or PEB and 10 PM apo-aPC e 0.3 PM CpcEF, after a 5-min incubation a t 37 "C. With the emission spectrum of PEB only subtracted from each, the emission maxima are 571 nm for +CpcEF, 587 nm for -CpcEF. A,, = 540 nm.
CpcEF-mediated addition productis similar tothose of natural PEB-bearing proteins, which have emission maxima in the range 570-581 nm (21,221. The a subunit of Calothrix sp. PCC 7601 C-phycoerythrin has an emission maximum of 574 nm. Interestingly, the gain in571 nm fluorescence in thepresence of CpcEF does not have the biphasic character seen for PCB addition. This suggests that all or nearly all of the PEB is competent for CpcEF-mediated addition to apo-aPC. Given that CpcEF can use PEB as a substrate, it was of interest to determine whether CpcEF mighthave the PEBPCB isomerase function described in the red alga Cyanidium caldarium (12). Bilin addition assay mixtures containing very high concentrations of CpcEF (0.85 VM) and 1.5 PM PEB were preincubated at 37 "C in the presence of 1 mM thioglycolate or 1 mM reduced glutathione for 45 min. Apo-aPC was added to start thereactions, and after25 min the emission spectra of the products were compared: the spectrawere essentially identical, and similar to that shown in Fig. 5. There was no indication of significant PCB adduct fluorescence in eithercase with excitation a t 600 nm. Two methods were used t o assess the relative catalytic efficiency of CpcEF with PEB and PCB as its bilin substrate. For relative binding affinity for each bilin, the kinetics of PCB addition in thepresence of PEB were used to determine theKI of PEB asa competitive inhibitor of PCB addition. For relative turnover rate with each bilin, the amount of adduct formed in a period of time with high [bilin] was measured. For the KI of PEB, thekinetic data from one of the two PCB dilution series was compared with data obtained using the same dilutions of PCB along with 5 VM PEB. The addition of 5 PM PEB did not greatly affect the nonenzymatic rate o f fluorescence gain at 640 nm, but PEB addition in the presence of CpcEF did produce a small rate of 640 nm fluorescence gain. This rate was notassessed in thepresence of PCB; presumably, PCB should act as a competitive inhibitor for PEB addition, and any correction for the gain in fluorescence caused by the PEB addition should be less in higher [PCB]. Therefore, the CpcEF-mediated fluorescence gain at 640 nm because of the PEB addition in the absence of PCB was first simply subtracted from each observed rate in the presence of PCB. The KI for PEB was calculated, theoretical PCB-inhibited rates of fluorescence gain caused by the PEB addition were calculated for each [PCB], and these rates were subtracted from the observed rates. These rates were used to calculate a new KI, and the procedure was reiterated once. The resultant rates of the PCB addition to apo-aPC in the presence of PEB,
Phycocyanin a Subunit Phycocyanobilin Lyase
8692
1
0
5
10
15
20
25
30
[PCB1 (WM)
t
xx)
I
I
400
500
I
600 1 (nm)
I
700
800
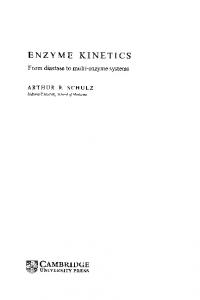
FIG.7. CpcEF-mediated addition of PEB or PCB to apo-aPc FIG.6. PEB inhibition of CpcEF-mediated PCB addition to apo-aPc.Initial ratesof holo-aPc formation (V,) per 0.5-ml assay in thewith a near saturating bilin concentration:difference spectra in acid-urea of the products of addition z CpcEF. The reaction conpresence of PCB alone were determined as described under “Experimental Procedures.” Initial rates of holo-aPc formation in thepresence ditions and treatmentof the products are described under “Experimenof 5 PM PEB were corrected for the contribution of PEB addition t o tal Procedures.” The difference spectra shown are of the +CpcEF and apo-aPc as described under “Results.” The concentration of CpcEF in -CpcEF reaction products in 1m18 of M acid-urea, 10 mM 2-mercaptoeach assay was15 nM. Curve fits are to the Michaelis-Menten equation. ethanol. Broken line, difference spectrum of PEB addition products. The kinetic parameters derived from these fits are: K,,, for PCB only, Solid line, difference spectrum of PCB addition products. 1.85 (2 0.83) p;observed K,,, for PCB in the presence of 5 PMPEB, 12.58 ( 2 0.46) PM; V, for PCB only, 3.67 ( 2 0.43) pmol min”; VmaXin the and 96.3 pmol, although 15 times more CpcEF was present in presence of 5 p PEB, 3.33 (20.07) pmol min”. Inset, Lineweaver-Burk the PEB reaction (91 versus 6.1 pmol). Based on these values, plots of the same data. the turnover rate for PEB is0.16 rnin”, and for PCB, 3.2 min”.
with a fit of the data to the Michaelis-Menten equation, are shown in Fig. 6. The kinetic parameters derived from these plots, which show a n increase in theobserved K, for PCB in thepresence of PEB but a similar V,,,, verify that PEBis a competitive inhibitor of PCB addition with a KI of 0.86 (2 0.44) PM. This is illustrated graphically in the Lineweaver-Burk plot of the data (Fig. 6, inset). The ratios of KI to K , and KI to K,*, using the K, for Fig, 4 A , can PCB and theK,* for PCB* from the full data set in be considered a measure of the relativeaffinity of CpcEF for the bilins.These are: K I X m , 0.72; KI:K,,,*, 30 (with a range of 15-65, using error limitsfor each value in theratio). For estimation of the relative efficiency of CpcEF with each bilin substrate, the rate of addition of each to apo-aPC was determined at a near saturatingconcentration of bilin. Bilin at 20 was used; this is near saturating for PCB containing 2% PCB* and should alsobe so for PEB, if the KI for PEB inhibition of PCB addition is similart o the K , for CpcEF-mediated PEB addition. Since the extinction coefficient of native apc PEB adduct is not known, it was necessary to use denatured assay products for quantitation; established extinction coefficients for thioether-linked PCB and PEB in acid-urea could then be used. The difference spectra of the reaction products, +CpcEF minus control, for PCB and PEB additionreactions are shown in Fig. 7. These difference spectra can be considered the spectra of bilin adducts formed by CpcEF. The difference spectrum for PCB addition product mixture has the correct long wavelength ,,,A 663 nm, but a lower red:near UV ratio thando known PCB peptides(0.6 versus l.O), presumablybecause of an MBV component; MBV peptides have a lower red:near UV ratio ( 5 ) .The difference spectrum for PEB additionproduct mixture hastwo peaks inaddition to that of PEB adduct(560 nm). One,at 665 nm, may be a PCB adduct. It ispossible that there isa small amount of PCB in thestock PEB, formed by isomerization during purification, or on storage. As noted above, preincubation of CpcEF with PEBdoes not change the emission spectrum of the reactionproducts, so CpcEF does not appear to have PEBPCB isomerase activity. The identity of the other peak,at 784 nm, is unknown. The amounts of PEB and PCB adducts formed by CpcEF in 5 min, calculated from the difference spectra, were similar, 74.4
Thus, the ratio of kcat PCB to PEB is 19. The error for this method of rate determination is probably large but was not determined; a realistic estimate is an error similar to thatfor the kinetic constants observed above, about 25%, which translates into a range of 12-32 for the ratio of kcat PCB:PEB. The turnover ratefor PCB from this experiment is substantially higher than that calculated from the datafor variation of [apo-aPcl in Fig. 4B, 1.5 min”. A better comparison is with the turnover rate of 0.53 min” from the variation of [PCB] in the presence of 10 p~ apo-aPC (Fig. 4A),the concentration used for this experiment. Differentpreparations of CpcEF were used for these experiments, and the different turnover rates are likely to reflect variation inspecific activity of CpcEF. Each renatured preparation of CpcEF differs somewhat in specific activity, and the activity decays over time at 4 “C. The ratio of turnover numbers for PCB and PEB should not be affected by this variation. DISCUSSION
Overexpression in E. coli yielded what appeared to be multiple forms of both CpcE and CpcF. The four CpcF fractions differed in the specific activity for bilin addition, but all were active in the presence of CpcE. All four forms have similar mobility on SDS-PAGE, but this does not preclude partial proteolysis (near the termini) as the source of variation. CpcF contains two cysteine residues, so it is possible that oxidation might affect the chromatographic and enzymatic properties of the protein. It is not certain that each of the threepolypeptides produced in E. coli on overexpression of CpcE is derived from the cpcE gene. Only one, that with an apparent molecular mass of 29 kDa on SDS-PAGE, has the mass predicted from the coding sequence of cpcE as well as bilin addition activity in the presence of CpcF. One interpretation of the results is that the polypeptide of apparent molecular mass 31 kDa is a n E. coli protein which co-aggregates with overexpressed full-length CpcE in vivo. This sort of co-aggregation in inclusion bodies has been observed previously (23). The polypeptide of 28.5-kDa apparent molecular mass may be a proteolysis product of CpcE; if so, this proteolysis must result in loss of a portion of CpcE required for association with CpcF and bilin addition activity. The resultsof HPLC SEC, along with the increased solubility and stabilityof each protein in the presence of the other,indi-
Phycocyanin a Subunit Phycocyanobilin Lyase
8693
Since the conformationof the bilin incup' is a stretched form cate that CpcE andCpcFinteracttoform at leastahet(all 2, but anti, syn, anti;Ref. 27), it is reasonable to suggest erodimer. It is possible that CpcEF may form higher order oligomers that are not stable to SEC under the conditions used. t h a t PCB'" may be the particular stretched isomer equivalent to that found in the holoprotein product of addition. Some support The physical association of CpcE and F helps to explain the lack of function of either protein alone, whether measured as for this notion is provided in CpcEF-mediated additionof PEB bilinadditionactivity, cypc fluorescencequenching, or, more to apo-ap", which lacks the previously observed clear biphasic character of the CpcEF-mediated addition of PCB (10). PEB tentatively, a n effect on the absorption spectrum of PCB. The quenchingof fluorescence and reduction in red:nearUV lacks the conformational constraint of conjugation across the absorbance ratio of holo-ape by CpcEF verifies that the pres- C-15 bridge between rings C a n d D and thus does not require ence of the lyase can shiftup(' into an unfolded or rearranged synlanti isomerization to convert from acyclohelical conformaconformation, at least in the region that surrounds the bilin. Ittion to one closer to that found in the holo-a subunit. This fact of "PEB'"" to the point i s a n open question whether this shift is actually induced by may increase the effective concentration t h a t t h e slower, secondary, linear rate seen with PCB is not CpcEF binding or is the result of a change in a preexisting equilibriumbetweendifferent ape conformations which is obvious for PEB. Although PEB can serve as the bilin substrate for CpcEFdriven by the binding of one to CpcEF. That the loss of fluorescence is not caused by proteolysis is demonstrated by t h e lack mediated addition toapo-a"", CpcEF shows somespecificity for of effect of either CpcE or CpcF alone, aswell as the lack of a PCB"' both in binding and in turnover rate. The Michaelismajor change in size of a"