Feb 6, 2013 - IPv4 network architectures to IPv6, or to reduce the use of IPv4 .... the influence of the limited bandwidth in our test lab, and to measure only the ...
Erlang-based dimensioning for IPv4 Address+Port translation Florent FOURCOT, Bertrand GRELOT, Isabelle KRAEMER, Fr´ed´eric ´ Tanguy ROPITAULT, Laurent TOUTAIN PERRIN, Patrick MAILLE,
To cite this version: Florent FOURCOT, Bertrand GRELOT, Isabelle KRAEMER, Fr´ed´eric PERRIN, Patrick ´ et al.. Erlang-based dimensioning for IPv4 Address+Port translation. ICC 2012: MAILLE, IEEE International Conference on Communications, Jun 2012, Ottawa, Canada. IEEE, pp.1230-1234, 2012, .
HAL Id: hal-00785727 https://hal.archives-ouvertes.fr/hal-00785727 Submitted on 6 Feb 2013
HAL is a multi-disciplinary open access archive for the deposit and dissemination of scientific research documents, whether they are published or not. The documents may come from teaching and research institutions in France or abroad, or from public or private research centers.
L’archive ouverte pluridisciplinaire HAL, est destin´ee au d´epˆot et `a la diffusion de documents scientifiques de niveau recherche, publi´es ou non, ´emanant des ´etablissements d’enseignement et de recherche fran¸cais ou ´etrangers, des laboratoires publics ou priv´es.
Erlang-based dimensioning for IPv4 Address+Port translation Florent Fourcot, Bertrand Grelot, Isabelle Kraemer, Fr´ed´eric Perrin Patrick Maill´e, Tanguy Ropitault, and Laurent Toutain Institut Telecom; Telecom Bretagne 2, rue de la Chˆataigneraie CS 17607 35576 Cesson S´evign´e Cedex, France Universit´e europ´eenne de Bretagne Email: {first}.{last}@telecom-bretagne.eu
Abstract—As the IPv4 address pool is being exhausted, it becomes urgent to find a way to migrate IPv4 network architectures to IPv6, or to reduce the use of IPv4 addresses. In this paper, we discuss a strategy known as “Address + Port” translation, which consists in several users sharing the same IPv4 address and being distinguished by a range of port numbers. Of critical importance for the feasibility of such a mechanism is the knowledge of the minimum number of ports to allocate to users so that no service degradation is perceived. To that extent, we analyse the port consumption of the most port-consuming Internet applications, web browsing, and present some aggregate port consumption curves for the student population of our campus. Our results suggest that a port range of 1000 ports is totally transparent to users (which would allow to share a single IPv4 address among 64 users), while 400 ports (i.e., 150 users per address) is sufficient for most of users. Finally, the number of users per address could be further improved by benefiting from statistical multiplexing, i.e., using dynamical instead of fixed port range allocation. Index Terms—IPv6, IPv4 address shortage, Address+Port, NAT, dimensioning
I. Introduction Due to the increasing number of devices connected to the Internet, the IPv4 address pool has been exhausted since February 2011. IPv6 implementations are already available on operating systems such as Linux, Windows and Mac OS so everything should be ready to migrate from IPv4 to IPv6 hosts by using dual-stack. However, IPv6 is not widely deployed for some reasons such as operators (ISP) and software-designers having to invest some efforts without immediate return, users not seeing the benefits of IPv6 (do they even know the existence of IP?), and no IPv6-only killer application being available. For those reasons, a migration process is needed to smoothly implement IPv6 in the Internet and to allow the use of IPv4 while the Internet is not IPv6 only. Address+Port (A+P) is viewed by providers as a way to cope with the IPv4 address shortage during that transition phase. A+P consists in sharing the same IPv4 public address between several users (home-gateway or hosts directly connected to the Internet), each user being differentiated by
a range of TCP/UDP ports (and possibly be allocated an IPv6 address). When a node wants to communicate with an A+P host, a special equipment (which location may vary depending on A+P solutions) intercepts the packet destined to the shared IPv4 public address, examines the IPv4 destination port-range, and forwards the packet to the A+P host. The special equipment forwards packets to the A+P host possibly through IP-in-IP tunnels (IPv4-inIPv6 or IPv4-in-IPv4 encapsulation) or Network Address Translators (NAT). Conversely, if an A+P host wants to communicate with a node in the Internet, it forwards the IPv4 packet (with the source port in its port-range) to the special equipment which decapsulates or NAT the packet depending on the A+P solution. A+P hosts may obtain the address of the special equipment thanks to DHCPv4 or DHCPv6 [2]. Many strategies are studied in this direction such as Port-Range-Router [1], 4rd [7], or Dual-Stack Lite [3] -a NAT-based solution which could be used jointly with A+P-. The goal of this paper is to verify that A+P fits to reallife environment, and more precisely to determine some appropriate port range spans, to maximize the number of users sharing an address while still experiencing good Internet performance. The remainder of this paper is organized as follows. In Section II we focus on a theoretical estimation of ports needs, with a simple mathematical model. Section III describes the algorithm of our program to simulate web browsing, the most port-consuming Internet application. Section IV contains our results and our analysis of the compatibility with the mathematical model. In Section V we provide port consumption data from Internet usage of Telecom Bretagne students, which gives experimental insights about the dimensioning of the user port ranges. We highlight the sporadicity of the port consumption, suggesting that dynamical port range allocations would bring a large improvement in terms of port management. We give some concluding remarks and suggest some directions for future work in Section VI.
1245
II. How many ports do I need? In this section, we wish to perform an optimal dimensioning of port range widths, in terms of maximizing the number of users per address, while keeping the A+P mechanism seamless in terms of perceived performance. To do so, we set up a simple mathematical model. Let us consider a single A+P user i who has been allocated a given number, say Ni , of ports. The port range is therefore sufficient if the user never needs more than N ports for his Internet usage. We denote by A the set of applications that are available to each user. As we will point out in the next section, each application corresponds to a given profile of port consumption over time; to keep things simple we consider that the port consumption of an application a ∈ A is constant and given by pa during its usage (in practice, we will take na as the observed peak port number of the application during our test period). A user i can be characterized by her behavior in terms of application use: • we model user i launching each application a ∈ A (during periods when i is online) by independent Poisson processes of rate λia , • usage durations of each application are assumed independent, with mean 1/µia for each application a ∈ A. With that model, the probability Bai of user i being constrained by the number of ports available when launching an application a can be computed using the well-known stochastic knapsack (an extension of Erlang B formula for heterogeneous services): if we assume that the application is not launched where the number of available ports is insufficient1 , then we have [8] P Q j ni ∈Sa α∈A ρα,i /nα ! , (1) Ba,i = 1 − P Q j ni ∈S α∈A ρα,i /nα ! where • ρα,i = λα,i /µα,i is the traffic generated (in number of ports) by user i with application α ∈ A; • ni = (nα,i )α∈A represents a vector of the number of applications nα,i of each type α launched by user i and still � running; P • S = ni = (nα,i )α∈A : α∈A nα,i pα ≤ Ni is the set of vectors ni such that no restriction with respect to the total number� of ports is Pperceived; • for a ∈ A, Sa = ni : pa + α∈A nα,i pα ≤ Ni is the set of vectors ni such that an extra application a ∈ A could be launched with no restriction in terms of port number being perceived. In practice, computing directly that probability is difficult since the sets S and Sa are prohibitively large for moderate values of N and A. However, some efficient recursive algorithms exist [8]. 1 Remark that in reality the application is likely to run anyway but only be slowed. However since we intend to dimension port ranges such that port shortage occur with very low probability, the difference between both models will be negligible.
Some long-term data would be needed to estimate the parameters λa,i and 1/µa,i in order to perform an individual port range dimensioning. In other words, relation (1) can be used to determine the minimal number Ni of ports to allocate to user i such that the probability of port shortage be sufficiently low (say, 10−3 for example). We do not consider the estimation of those individual behavior parameters in this paper; we rather focus on estimating the port consumption parameter pa per application, through measurements of simulated user behavior. To estimate the port consumption of a popular application and the impact of user experience in case of lack of ports, we have emulated a web browsing behavior, as described in the next section. III. Simulating a web browsing session The first issue of our measurement-based study was to identify the most port-consuming applications. We analyzed the traffic on a student network (see Section V), some results being displayed in Figure 6. HTTP happens to be the most-consuming protocol with always more than 50% of total port consumption (and more than 90% when users are very active), peer-to-peer coming second. Other popular applications like Video Games and Instant messaging need only few ports. We therefore focus here on web browsing, that in addition is more likely to be sensitive to Quality-of-service degradation than peer-to-peer applications. We simulated end-users browsing the web, and measured the response time as a function of the severity of port starvation. The following procedure has been applied: 1) choose an arbitrary web page as a starting point, and initialize an empty pool of addresses; 2) download the page, and all img, script and link elements; 3) add the target of all links to the pool of addresses; 4) sleep for some time; 5) select at random a new address from the pool; 6) go back to point 2. We created in this manner several surf sessions, with the starting point set to planet.debian.org, twitter.com and del.icio.us. These starting points were chosen because these pages have a lot of external links. In order to get repeatable results, we launched a one-hour long browsing session for each starting point, recording all the pages seen. We then replayed the session, in different environment. The pause between two pages follows an exponential distribution, with a mean pause time of 15 seconds. As our concern is the response time of remote servers, for each element we measure the time it takes to establish a TCP connection to port 80. This enables us to alleviate the influence of the limited bandwidth in our test lab, and to measure only the impact of the limitation of TCP ports. The scripts used in the experiments, along with the resulting data, are available online [4].
1246
3 9 21
45
93
180
Time (seconds)
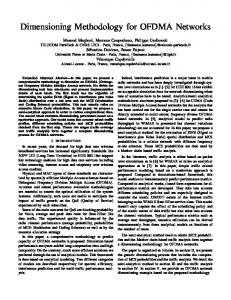
Fig. 1: Distribution of the connection establishment times – 500 ports available, 3 simulated clients.
IV. Experimental results A. What happens when ports are missing Figure 1 shows how long it takes for each client to start downloading a file. The x axis is the time since the first SYN packet, the y axis is the proportion of connections that receive the first byte of the element within that time. In this figure, we used three clients, each with one different starting point. Each client was using 15 threads to download pages. Each connection from a client to a remote server uses one port on the router. However, when the connection is closed, the port on the router is not immediately marked as free and reusable. This is the normal behavior of TCP: some segments may be late, in the wrong order, and thus arrive after the FIN packet that closed the connection. As a result, even if there are never more than 3 × 15 = 45 connections opened simultaneously, there are many more than 45 ports used of the router. This is why, for our experiments carried out with 500 ports, a lot of requests that can not be satisfied, leading to a very poor user experience (see Figure 2) . When the router cannot give out a port to a client, it has no way to warn it that it cannot let the connection through. The only indication for the client that the initial SYN was dropped is the lack of a SYN+ACK response. From the point of view of the end-user, all she can see is a long delay in contacting the server, without any feedback. We see on Figure 1 that a lot of requests are satisfied in 3 (resp. 9, 21, 45, etc.) seconds, resulting in a stair-step distribution of connection establishment durations. These requests correspond to connections where the 1st (resp. the 2nd, 3rd, etc.) SYN segments from the client were dropped by the router, but the following attempt went through and the remote server answered quickly (in less than 100 ms). Linux’ strategy for retransmitting the initial SYN packet is an exponential back-off [5]: the retransmission
B. Number of failed attempts When a web page cannot be accessed, the end-user cannot determine whether the problem comes from a router starving for TCP ports, or from a slow or dead remote server. Her web surfing is just disrupted. We decide that a web object (the HTML page itself, or an embedded image) cannot be fetched based on the impatience of the user. In the following, we will set the threshold after which a request is considered a failure to τ = 5 seconds. This is half the time users can be expected to wait, and well above the comfort zone [6]. Figure 2 shows the number of elements who took more than 5, 2.9 and 170 seconds to load (or rather, the proportion of TCP connections who took longer than this delay to be established). 2.9 seconds is just Linux’ initial TCP timeout, and a threshold of 170 seconds counts the number of elements that we completely gave up trying to fetch. Proportion of failed requests (in %)
Proportion of successful connections
time Tn of the nth packet is Tn = (2n − 1) × 3 seconds; we observe clearly marked stages at these periods, with an upper bound at 180 seconds, where we give up trying to connect to the remote host.
1 0.9 0.8 0.7 0.6 0.5 0.4 0.3 0.2 0.1
2.9 5 170
40 30 20 10 0 300
500 600 700 800
1,000
1,500
Number of available ports
Fig. 2: Proportion of failed connections (τ = 2.9, 5, and 170 seconds). We see that the three curves have a very similar shape. In all cases, the proportion of failed connections start to increase sharply as soon as the number of available ports goes under 1000 ports for 3 clients. It means that as soon as the pressure for the attribution of ports is strong enough to cause the router to drop even a few SYN segments, any small increase in the demand of ports will have a strong impact on the user experience and on the failure rate. C. Number of retries for establishing a TCP connection As seen above, Linux uses deterministic, discrete timeouts when waiting for a SYN+ACK answer to its first SYN. This enables us to easily determine the number of attempts the client had to made to open a TCP connection, by matching the time needed against discrete stages.
1247
Proportion of elements (in %)
100
connected (some students have more than one computer). The connectivity is limited: IPv6 and IPv4 are allowed, users cannot send any DNS request outside (they have to use the internal resolver, that uses the global Internet link; we show the traffic on our statistics); download is limited to 20GB per day per user. All users share the same NATed IP address. All TCP ports are allowed and there is no applicative filter.
90 80 70 300 ports 500 ports 700 ports 800 ports 1000 ports
60 50 40
1
2
3
4
5
6
Number of attempts
Fig. 3: Distribution of the number of attempts per connection (3 clients).
B. Individual user port consumption We performed individual port consumption studies for campus students. The data highlighted a strong heterogeneity in the usages, that translates in very different needs in terms of ports. With in mind a static port range allocation, we plot in Figure 4 the repartition of the maximum (over a 24-hour period) number of ports simultaneously used, among the population.
When a connection is established in less than 3 seconds, then it means the first SYN segment went through the router and reached the remote server; between 3 seconds and 9 seconds means the first SYN segment was dropped, but the second try was successful; and so forth. As before, the client gives up after 180 seconds, i.e., at most 6 SYN segments are sent before considering the remote server unreachable. Figure 3 shows the proportion of TCP connections which needed a certain number of attempts to be established. For instance, we can see that when more than 1000 ports are available, 95% of TCP connections can be established on the first try, and about 2% could not be established at all.
Proportion of users (%)
60
40
20
0 0 − 199 200 − 399 400 − 599 ≥ 600 Maximum number of ports used
Fig. 4: Repartition of maximum port (TCP and UDP) usage among Brest campus students.
D. Impact of the simulation on the dimensioning Our simulation helps to understand what happens if an user has not enough ports for web browsing, the most popular internet application. We can change some parameters like the number of clients and the pause between two pages to simulate different user profiles (heavy user, low traffic user, etc), in order to estimate the pa parameter of Section II for those users. To consider a larger granularity of the port dimensioning problem, the next section describes a study on the flow of an Internet gateway, that aggregates the traffic of several hundreds of users. V. Global port consumption of Internet users A. Context of the study The behavior of a group of users in our student residences has been studied. We expect that population (engineering graduate students in information technologies) to make a heavy use of telecommunication resources, and to possibly provide a fairly good estimate of the traffic we might observe in the upcoming years. We observed the student traffic of the Brest campus of Telecom Bretagne, representing around 600 computers
Those results suggest that port ranges of less than 600 ports would be sufficient for most users, while very few would need (temporarily) more than 600 ports. Our analysis shows that the port consumption is very sporadic: periods with very large port usage are rare. To have a better idea of the consumption users, we plot in Figure 5 the time during which users need more than 100, 200, 400, 600 and 1000 ports over a week. Remark that if 10% of users need more than 600 ports at least once in the week, only 4% need them more than a cumulated 15 minutes over the week. As a result, allocating 600 ports to those users would be enough for a seamless A+P mechanism with a very good user experience. With 1000 ports, it will be completely transparent for most users. The burstiness of port usage suggests that a lot could be won by benefiting from statistical multiplexing, i.e., from the fact that not all users need a large number of ports at the same time. To exploit that aspect, we would need to implement dynamical port range allocation, adapting the port range of each user to her needs over time.
1248
Proportion of users over N ports
0.9 0.8 0.7 0.6 0.5 0.4 0.3 0.2 0.1
N = 100 N = 200 N = 400 N = 600 N = 1000
20
40
60
80
100
120
Cumulated time (minutes)
Fig. 5: Accumulated time over which users need more than N ports (for one week, TCP and UDP traffic).
C. Global port consumption on Telecom Bretagne student residences (500 students) Statistics on the IPv4 Internet gateway of the Brest campus are given in Figure 6. Remark that the 500 students never use more than 15000 TCP ports at a time, thus a perfect dynamical Address+Port scheme should allow them all to share the same IPv4 address.
Port consumption
·104 Total TCP HTTP(S)
1
migrate freely to an IPv6 network core. Then two address plans could be developed, so that IPv4 could get along with IPv6. As soon as the end user supports IPv6 on every equipment, the Internet provider would be free to stop the IPv4 tunneling and could guarantee a full IPv6 connectivity. A+P solutions therefore seem well-suited for an IPv6 smooth transition. An interesting direction for future work could be to characterize some typical behavior of users (in terms of frequency and duration of application usage) in order to optimally dimension the port range for each user, through a more fine-grained use of the Erlang B law or its extensions (stochastic knapsack). Notice however that typical ISP clients often use a gateway, the gateway being the device with the shared IPv4 public address. As a result, the port range size has to be adapted depending on the number of users connected to the gateway. Again, the dimensioning laws can be applied, by aggregating the traffic characteristics of the users involved. We moreover remarked that port consumption is very sporadic and depends highly on users behavior. Therefore future works for A+P systems should study dynamical port allocation in order to benefit from statistical multiplexing. We should in particular focus on finding solutions for: • transport port range allocation/change demands, • secure port range allocation exchange to prevent Denial of Services attacks (i.e., a malicious node occupying all ports). Acknowledgments
Total UDP DNS (UDP)
This work has been funded by a Cisco research grant. We also want to thank Rémi Després for his expertise and advice regarding the A+P mechanisms.
0.5
References 0
0
2
4 Time (seconds)
6
8 ·104
Fig. 6: 24 hours of observed port consumption on the Telecom Bretagne student network.
VI. Conclusion This paper investigates the feasibility of A+P translation in terms of quality of service, with significant multiplexing gains. Our results suggest that a port-range of 1000 ports would be transparent for end-users, while permitting to assign the same public IPv4 address to 64 customers. In the context of the IPv4-to-IPv6 transition, keeping an IPv4 address plan on the end user’s network guarantees that the system will work with non-IPv6compliant operating systems. The whole system remains transparent for the users, and the Internet provider can
[1] M. Boucadair, IPv4 connectivity access in the context of IPv4 address exhaustion: Port range based IP architecture, draftboucadair-port-range-02.txt, June 2009. [2] R. Droms, J. Bound, B. Volz, T. Lemon, C. Perkins, and M. Carney, Dynamic Host Configuration Protocol for IPv6 (DHCPv6), RFC 3315 (Proposed Standard), July 2003, Updated by RFCs 4361, 5494. [3] A. Durand, Dual-stack lite broadband deployments following ipv4 exhaustion, draft-ietf-softwire-dual-stack-lite-04.txt, March 2010. [4] I. Kraemer and F. Perrin, surf.pl and resurf-socket.pl, 2011, http://svn.fperrin.net/v6fication/crawler. [5] D. Lukowski et al., net/tcp timer.c: retransmits timed out(), August 2009, Linux kernel. http://kernel.org. [6] J. Nielsen, Response time limits, 1993, http://www.useit.com/ papers/responsetime.html. [7] Despr´ es R., Matsushima S., Murakami T., and Troan O., IPv4 residual deployment across IPv6-service networks (4rd) - ISPNAT’s made optional, draft-despres-intarea-4rd-01.txt, March 2011. [8] K.W. Ross, Multiservice loss models for broadband telecommunication networks, Springer, February 1997.
1249