Aftersight decouples analysis from normal execution by log- ... program being debugged by the developer (developers are expected to have access to the ...
ESD: A System Software Debugger Based On Execution Synthesis Cristian Zamfir and George Candea School of Computer and Communication Sciences École Polytechnique Fédérale de Lausanne (EPFL), Switzerland
Abstract Debugging is one of the hardest and most time-consuming activities in developing system software. Bug reports rarely provide much more than a coredump of the failed program, and the developer is required to turn into a detective to determine how the program arrived to the failure point. ESD is a tool for automating most of this detective work. Without requiring any program modifications or execution tracing, ESD finds a feasible execution of the program that exhibits the reported bug. It then replays this execution deterministically in a regular debugger, like gdb, in a way that is transparent to the developers: they just run the program and see the bug manifest every time. This is particularly useful in debugging concurrency bugs, which are often quite elusive. ESD is a practical tool: it requires zero execution tracing, zero program modifications, and is fast: it finds the desired path on the order of seconds or minutes in real programs. It employs a combination of static analysis and symbolic execution to “synthesize” a valid bug-bound execution. We rely on the observation that, for debugging, it is sufficient to find some path leading to the reported bug; the exact path that manifested in production is rarely relevant. ESD’s path is usually shorter than the one experienced at the user site, making debugging even easier. ESD relies on a set of heuristics that provide crucial hints for how to explore the space of execution paths and thread schedules efficiently. We show ESD is effective and practical for real systems: in software like the SQLite database, HawkNL network library, and UNIX utilities, ESD reproduces entirely automatically seven concurrency and memory-error bugs within less than three minutes, starting from just a bug report.
1. Introduction Developing software is a challenging endeavor and debugging it is even harder. With the increasing pressure to build parallel software, the classic problem of sequentialexecution bugs is now compounded with concurrency errors, like deadlocks and other hard-to-reproduce behavior. To fix a bug, we traditionally aim to reproduce the bug and observe it in a debugger. Alas, this approach is difficult for most bugs, especially concurrency bugs; in a recent survey, almost 75% of respondents considered reproducibil-
ity to be hard or very hard [11]. First, complex sequences of low-probability events are often required for a concurrency bug to manifest (e.g., a specific thread schedule) and programmers do not have the means of directly controlling such events. Second, the probe effect—unintended alteration of program behavior through the introduction of instrumentation and breakpoints [10]—can make concurrency bugs “vanish” when hunted with a debugger. Third, variations in the environment can make it impossible for developers to replay a bug without explicit access to the original program inputs and the environment where the bug occurred. With increasing size, concurrent systems are becoming increasingly more difficult to debug. Currently, more than 70% of concurrency bugs take from several days to several months to analyze and diagnose [11]. This increases the cost of maintaining and evolving concurrent software, and consumers must wait a long time before fixes become available. Moreover, the large amount of guesswork involved in debugging leads to patches being error-prone, with many concurrency bug fixes either introducing new bugs or, instead of fixing the underlying bug, merely decreasing its probability of occurrence [18]. Increasingly parallel hardware leads to increasingly concurrent executions, unearthing latent bugs that are now more likely to manifest, yet no easier to fix. In this paper we present ESD, a tool that speeds up debugging of hard-to-reproduce bugs. ESD starts from the information in a bug report and automatically synthesizes a feasible program execution that reproduces the bug. To identify this execution path, ESD performs a set of static analyses followed by a highly focused form of symbolic execution. The obtained path is then played back deterministically in a way that is transparent to common debuggers, like gdb. This makes developers substantially more productive: instead of a vague bug report, they are given an execution that consistently exhibits the target bug. This now-deterministic behavior can be inspected with all the classic techniques: step-bystep execution, breakpoints, data structure dumps, etc. ESD does not require tracing of the program’s execution— it relies solely on the program code itself and information commonly found in a coredump, namely the program counters of the program’s threads at the moment of bug manifestation. It is easy for bug reporters to provide this information.
ESD is practical and can scale to real systems. For example, we show how it takes less than three minutes to synthesize an execution for a bug reported in SQLite [25], an embedded database engine with over 100 thousand lines of C/C++ code [21]. The key observation that enables ESD to scale is that, in order to diagnose a bug, a developer rarely needs to replay the exact same execution that manifested the bug at the end-user site, but rather it is sufficient to play back any feasible execution that exhibits that same bug. This paper makes two main contributions: Sequential path synthesis is a technique that combines symbolic execution with context-sensitive inter- and intra-procedural static analysis to efficiently produce a guaranteed-feasible sequential execution path between any two basic blocks in a program. Thread schedule synthesis is a search technique for finding arbitrarily complex thread schedules (i.e., serial interleavings of thread executions) that allow a program to reach a target concurrency bug. ESD also enables programmers to deterministically and transparently play back arbitrary synthesized program executions inside commonly-used debuggers. In the rest of this paper, we survey related work (§2), after which we give an overview of ESD (§3) and describe in depth sequential path synthesis (§4), thread schedule synthesis (§5), and execution replay (§6). We then present the ESD implementation (§7), an experimental evaluation (§8), discussion (§9), and then conclude (§10).
2. Related Work One way to reproduce bugs is by using whole-system replay [7, 8], where virtualization is used to capture details of an execution. Using this approach enables exact replay. Concurrency bugs that manifest in production, however, are rare occurrences; in this case, the performance and space overhead of tracing the entire execution may offer less payback. ESD requires no tracing at all, which makes it advantageous for rare events. Higher-level replay systems, like R2 [12], can record library-based interactions and replay them. ESD’s replay environment uses similar techniques, extending them with the ability to replay asynchronous events (such as thread preemptions) that are crucial to reproducing concurrency bugs. The main difference is that ESD does not incur the overhead of recording at runtime. The goal of R2 is to observe the interactions that lead to an execution; ESD, on the other hand, can synthesize the execution, thus obviating the need for observation. In combining static analysis with symbolic execution we were inspired by a series of systems [3, 5, 6] which compute inputs that can take a program to a given undesired state. These systems were targeted at program states that can be deterministically reached if given the right inputs. However, recording program inputs is not always possible, especially for long running executions that do not tolerate the time and
space overhead of recording. Moreover, concurrency bugs can rarely be reproduced by merely providing the right inputs; ESD can discover scheduling conditions and program inputs that can make both sequential and concurrency bugs re-occur deterministically. We also drew inspiration from bug-finding tools like Chess [19] and DeadlockFuzzer [13], which can find deadlocks in programs that are run within the respective bugfinding environments. and then replay these deadlocks to enable their debugging. Chess can only find and replay concurrency bugs for which a short and precise test case, that replays most of the input non-determinism, exists. ESD, however, aims to reproduce bugs discovered and reported by end-users in production, not found by developers while testing in thev Chess environment. Also, ESD achieves scalability without having to bound the number of thread switches, as was done in Chess. Moreover, for reproducing deadlocks, ESD uses a more informed heuristic than the random approach used by DeadlockFuzzer. Our work complements the rich set of tools used to detect bugs [9, 24]. ESD also enhances dynamic avoidance tools, such as Rx [23] and Dimmunix [14]. E.g., Dimmunix uses deadlock signatures to dynamically avoid the schedules that lead to deadlocks; ESD can use these signatures to “reverseengineer” those deadlock-bound schedules and replay them for debugging purposes. Aftersight [4] is an efficient way to observe and analyze the behavior of running programs on production workloads. Aftersight decouples analysis from normal execution by logging non-deterministic VM inputs and replaying them on a separate analysis platform. ESD, on the other hand does not observe the running program, and ships the bug report to the analysis platform, located at the developer’s site. Reverse debugging [15] uses virtual machines to go back and forth in time. This is especially helpful in finding bugs that are fragile due to non-determinism, bugs in device drivers, etc. However, this approach can incur too much overhead to be used in production software for bugs that occur rarely. Recent work deals with replaying concurrency bugs while decreasing the amount of user-side recording [1, 22]. While similar in spirit with ESD, these tools record all program inputs and the order of synchronization operations, adding up to more than 50% overhead while the program is running in production.
3. Overview ESD employs a multi-phase approach to reproducing a bug, combining static and dynamic analyses as follows: in the first phase, it constructs a control-flow graph (CFG) of the program being debugged by the developer (developers are expected to have access to the source code) and then locates the basic blocks that threads reached in the bug report. It then uses static analysis and symbolic execution to
identify a set of constraints on inputs, thread schedule and program state that will synthesize an execution that leads to the bug. In the final phase, this execution can then be played back deterministically in a way that is transparent to debuggers, which essentially turns the non-deterministic bug into a 100%-reproducible bug that can be debugged in the traditional way. We use several new techniques to cope with the large search space for real programs (e.g., the number of program states is exponential in the size of the program and is compounded by the exponential number of possible thread schedules). ESD uses the CFG and several heuristics to estimate, for a given basic block, the “distance” to the goal in terms of basic blocks. Using this heuristic distance, ESD guides the symbolic execution toward the execution paths that are likely to lead the soonest to the bug. Additionally, ESD uses another set of heuristics to efficiently find a thread schedule that manifests the bug. We demonstrate that these techniques enable ESD to scale to real programs and find within a few minutes, paths to bugs lying deep into the program’s execution. ESD requires zero execution recording at the user’s side. We specifically target applications that run in production, for which tracing the execution would be too expensive, such as server software (databases, web servers, application servers) and libraries that use POSIX threads for synchronization. ESD only requires the backtraces (i.e., the stack trace of function calls that are currently active in a thread) of each thread, which can be obtained from the bug report. ESD does not require access to source code at the consumer side (only the developers need access to source code), annotation or debug symbols, and can be used even on optimized binaries as long as the backtrace information is available in the bug report. For gcc this can be achieved if the program is compiled using the -rdynamic flag. Backtraces are generally the only information required for some bugs such as deadlocks and assert failures, but for other bugs, such as buffer overflows, ESD uses the coredump to automatically extract the condition that the bug manifests (e.g., the buffer size is less than the index used to access an array element). This is necessary because an instruction can be executed many times without causing a bug, but if a certain condition is met, the bug is triggered. In designing ESD we made a very important tradeoff to offload the entire overhead of reproducing the bug to the developer/vendor side, which means ESD is missing some important clues about the execution path. For instance, ESD is missing the program inputs and the thread schedule. Another example of missing clues are the backtraces of the outer looks involved in a deadlock bug. The outer lock is the lock acquired and held by a thread before blocking on another lock (line 17 in Figure 1). The location of the outer lock is a very important clue about the deadlock bug, but is missing from the bug reports since the bug report only contains the
1: int x = read(); 2: switch(x){ 3: case 1: 4: mode = C; 5: break; .... 9: case 5: 10: mode = Z; 11: break; 12: default: 13: mode = W; 14:} 15: EnterCriticalSection(){ 16: pthread_mutex_lock(&mutex1); 17: pthread_mutex_lock(&mutex2); ... 19: if (mode == Z) 20: pthread_mutex_unlock(&mutex1); 21: pthread_mutex_lock(&mutex1); ...
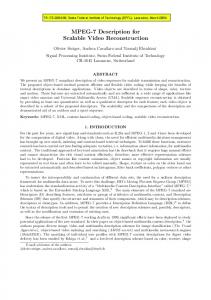
Figure 1: Input-dependent deadlock. current backtrace of each thread (the inner locks). Without knowledge about the outer locks, the developers can only assume which locks are involved in the deadlock bug and where in the program they were acquired. In practice, this can lead to incorrect fixes [18]. ESD reconstructs these clues using execution synthesis. For instance, we took a deadlock bug report filed against SQLite and used ESD to search for the deadlocking execution described in the bug report. ESD was able to find a deadlocking execution, matching the bug report, within minutes, and generated the required replay data to allow this execution to be replayed deterministically and transparently in gdb. To understand how ESD works, we will walk through an example using a deadlock bug. Figure 1 is a simplified version of an input dependent deadlock similar to one of the deadlocks we found in SQLite. The value x is read from a file which sets the mode of operation. A deadlock occurs only when mode has value Z which implies that the symbolic variable x has the value 5. Since ESD does not record the values provided by the environment, the approach taken is to mark these values as symbolic and synthesize values that reproduce the bug. The only input required by ESD are the backtraces of the deadlocked threads which can be obtained from the bug report. In this case, the deadlock occurs when two threads concurrently execute EnterCriticalSection() and mode is equal to Z. The first thread (T1 ) locks mutex1 and mutex2 in statements 16 and 17. Since mode equals Z, T1 will also unlock mutex1 at statement 20. If T1 is preempted before executing statement 21, the second thread, (T2 ), will lock mutex1 in statement 16 and request mutex2 (line 17) which is locked by T1 . Subse-
quently, T1 will try to acquire mutex1 in statement 21 which is held by T2 , thus causing the deadlock. The input to ESD will consist of the backtraces of both threads. We compensate for the variations in the environment and input non-determinism by symbolically providing the values that would otherwise be generated by the environment. In this example, assuming for simplicity that variable mode is not modified somewhere else (though our approach works in the general case too), ESD symbolically executes forward the program until it reaches the switch statement in line 2 where it forks execution and creates a separate execution for each branch. It uses various search strategies and static analysis to determine which state is closer to the deadlock and will ultimately execute a state where mode equals Z. The second component of ESD explores, in an efficient way, various thread interleavings which are likely to cause the deadlock to occur. Having knowledge of the bug report, ESD automatically extracts from the backtraces of the threads involved in the deadlock, a strategy to cause the deadlock to occur with high probability. Previous approaches cannot attempt to replay similar bugs without performing intrusive tracing and recording of program non-determinism at the customer site. Without knowing these inputs, the program could, for instance, follow the default branch of the switch statement which does not produce any deadlock. However, ESD can reproduce bugs by finding matching program inputs and the required thread schedule. ESD’s search is automated and does not require any assistance from the developer. Once the path that triggers the bug is synthesized, ESD allows the bug to be replayed 100% deterministically and debugged transparently using traditional debugging tools.
4. Sequential Path Synthesis ESD is automating what the developer would be doing in trying to fix the bug, which is determining how could the program actually reach an execution path that caused the bug. ESD searches for an execution that exhibits the target bug even though it may not necessarily be the one that led to the bug in the original execution in production. In fact, there is an advantage in synthesizing a shorter execution than the execution from the bug report, especially if the bug manifested after running correctly for a long period of time. However, ESD is not limited to discovering shallow bugs, and can reproduce bugs with deep execution paths. 4.1 Overview ESD’s uses symbolic execution to explore multiple possible execution paths, and steers these executions towards a certain instruction, which we call goal. ESD keeps track of several execution states at a time. A new state is created when a branch instruction, that depends on symbolic inputs, is executed. The process is similar to a fork(). At each instruc-
tion, ESD calls the Searcher component, which selects the best state to run among the existing states. ESD adds the new states obtained after forking execution to the GoalSearcher which keeps these states ordered based on their proximity to the goal instruction. The execution state is defined by the current instruction pointer and the stack. Based on this information, the GoalSearcher decides which execution state to symbolically run next. The GoalSearcher enables a directed type of search for the symbolic execution engine, and avoids executing states that are unlikely to execute the goal instruction. The main challenge is to identify a search heuristic to prioritize states which are more likely to execute the goal instruction. Moreover, the GoalSearcher has to estimate how much time can the program execute inside functions that have already returned and are no longer on the backtrace from the bug report. Other orthogonal techniques can be employed to further improve the search strategy. For instance, if the initialization phase of the program can be reproduced by other means, such as from an existing test case (ESD does not require existing testcases though) ESD could run concretely the initialization phase and automatically switch from concrete to symbolic execution later in the execution of the program, thus greatly reducing the time used to synthesize an execution that reproduces the deadlock bug. 4.2 Linear Goal Search In this section we address the single-threaded case and assume the goal instruction can be any instruction in the code. We define a critical edge to be a branch statement that can transfer control to two possible addresses, but only one of the branches can still reach the goal. ESD automatically identifies such edges and drops states that do not execute a critical edge and instead follow the other branch. ESD first performs a static analysis pass on the entire program’s interprocedural control flow graph, which is represented using the LLVM [17] bitcode. It first performs an optimization pass to obtain a more accurate CFG and resolve function pointers. Our approach works if not all indirect calls can be resolved, though it may loose precision. We then perform data-flow sensitive inter-procedural and intra-procedural static analysis to identify the data dependencies of the critical branches and identify a set of possible intermediate goal instructions that have to be executed in order to execute the goal. Algorithm 1 describes this static analysis phase. This algorithm computes a set of intermediate goal instructions that can be statically determined as being on the execution path that reproduces the bug. These intermediate goals are then used by the GoalSearcher to speed up the search. The GoalSearcher, described in Algorithm 2, tries to reach, one by one, each of the intermediate goals computed by the static analysis phase. We maintain a measure of how close each state is to the goal. Intuitively, a state is closer
Algorithm 1: Data Flow Goal Searcher Static Analysis Algorithm
1 2 3 4 5 6 7 8 9 10 11
Input: Program P, Goal G Output: A set of intermediate goals to be used in the Goal Searcher Algorithm Let IS be the set of intermediate goals IS ← φ foreach instruction I in P do if G is reachable from i then I.distance = minimum distance to G instruction else mark goal as unreachable from I while critical branch found do B ← next predecessor branch instruction of G.pc if one outcome of B cannot reach the goal then B ←critical branch
18
forall critical branches do BC ← branch condition forall operands op in BC do R ← reaching definitions of op foreach r in R do if r must be executed in order to execute the critical branch then IS = IS ∪ r
19
return IS
12 13 14 15 16 17
Algorithm 2: Goal Searcher Algorithm 1 2 3 4 5 6 7 8 9 10 11 12 13
Input: Program P, initial state S0 , goal G Let Q a priority queue sorted by the distance to G Q ← S0 foreach function f in P do compute minimum distance to a return instruction while Q not empty do S = Q → popFront() if S.pc equals G.pc then exit(“reached goal“) execute next instruction from S d1 = minimum number of instructions until the goal instruction d2 = minimum number of instructions until return S.distance = min(d1, d2) Q.insert(S)
to the goal if the number of statements that have to be executed before the goal is reached is smaller. We estimate this number by computing static lower-bounds using an interprocedural control flow analysis technique. We explain succinctly how these bounds are computed. The distance to goal for a given instruction can be defined as the minimum number of instructions to be executed
to the goal without returning from the current function. For the simple case when the program counter is in the same function as the goal instruction, the distance is the number of instructions on the shortest path to the goal. In computing the shortest path we assign a weight of one to all instructions, except for function calls, which have weights proportional to the number of instructions executed on the shortest path from the entry point to a return point of the called function. For the rest of the inter-procedural CFG, the algorithm propagates the distances backwards to the callers of the function that contains the goal instruction. To compute the distance to goal for a given state, we take into account its call stack, to obtain a context aware lowerbound. For each call stack entry (corresponding to a call) we compute a possible way to reach the goal by taking into account two components: • the instructions that have to be executed to return from
the calls • distance to goal for the instruction that executes right
after the call returns The distance to goal for a state is the minimum among the distances for each call stack entry. There are several challenges to the above approach: recursion, system calls, and indirect jumps. The first two are inherent problems that cannot be avoided in any way and we chose to penalize the path that encounters them with fixed penalties (e.g. if a path makes a recursive call we assign a weight of 1000 instructions to that call). Indirect jumps are handled with an alias analysis and if there are more possibilities we average the number of instructions to get the weight of the call instruction. ESD can decrease the number of states that have to be kept in memory at the same time. One of the problems of using symbolic execution on large code is that the memory consumption is high [2]. This means that typically, many states reside in memory at the same time. When the memory limit is reached, states that could otherwise produce additional coverage will be dropped. ESD does not aim at maximizing coverage, instead it tries to estimate if the states residing in memory are likely to reach the goal instruction. Therefore, the memory is occupied with states that are more likely to execute the goal instruction. We found that the GoalSearcher can significantly speed up the time the symbolic execution engine reaches the goal by several orders of magnitude (§8).
5. Thread Schedule Synthesis ESD uses a dynamic analysis phase based on a single threaded scheduler, and on exploration heuristics that prioritize the thread schedules that are likely to matter in reproducing the bug. This section describes two such heuristics. ESD can reproduce concurrency bugs such as deadlocks and data races. The high-level technique to synthesize thread
void *thr( void * ... ) { p1: pthread_mutex_lock( &A ); p2: pthread_mutex_lock( &B ); ... p3: pthread_mutex_unlock( &A ); ... p4: pthread_mutex_lock( &A ); ... p5: pthread_mutex_unlock( &A ); p6: pthread_mutex_unlock( &B ); ... p7: pthread_exit( NULL ); } void main( void ) { ... p8: pthread_create( &T1, NULL, thr, ... ); p9: pthread_create( &T2, NULL, thr, ... ); ... p10: pthread_join( T2, ... ); p11: pthread_join( T1, ... ); ... }
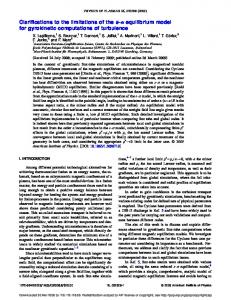
Figure 2: Simplified version of the SQLite deadlock bug. schedules that reproduce a concurrency bug, is to use the sequential goal searcher for each thread in the program. Initially, ESD uses a combination of round-robin and random schedulers, and can insert preemptions at machine level instruction granularity. During the dynamic analysis phase ESD also runs a data race detection algorithm, and inserts thread preemption points where potentially harmful data races [20] occur. In order to efficiently explore the possible outcomes of a data race, ESD stores checkpoints of the execution before the data races occur. These checkpoints can be executed later with a slightly modified thread interleaving that produces a different output of the data race. If ESD determines that a certain branch instruction or a function call cannot be executed in order to reproduce the bug, it uses heuristics to determine which previous checkpointed execution state is likely to enable the synthesis of an execution path that reproduces the bug. It then prioritizes the analysis starting from that checkpoint. Note that ESD uses copy-onwrite (§7.1) to exploit memory sharing between execution states and checkpoints, which means storing checkpoints is inexpensive. In §5.1 we exemplify by presenting a thread schedule synthesis technique for deadlock bugs. 5.1 Deadlock Thread Schedule Synthesis We use the example in Figure 2, which shows a non-inputdependent deadlock: after one thread (say T1 ) releases A at position p3 , the other thread (say T2 ) may acquire A, at which point the two threads are deadlocked. We assume a bug report of the deadlock of the form below that contains the callstacks for the acquisition of the inner locks for threads T1 and T2 : [p4 ], [p2 ]. The bug report does not specify the location of the outer locks. However the deadlock occurs
Algorithm 3: Deadlock Search Algorithm
1 2 3 4 5 6 7 8 9 10 11 12 13
Input: currently executing instruction inst, state S, bug report B, set of checkpoint states Checkpoints if instisLock then Checkpoints.add(S) if inst is inner lock from B then S.preempt(currentT hread) schedule the next enabled thread in state S if inst.lock is locked then if inst.lock is locked by thread T and T reached the inner lock from B then foreach C in Checkpoints made by T do start exploring from the checkpointed state C schedule the next enabled thread in state S if instisUnlock then DeleteCheckpoint(inst.lock) schedule the next enabled thread in state S
when the outer locks are acquired at positions p2 and p1 respectively, like this: � � outer : [p2 ] [p1 ] inner : [p4 ] [p2 ] ESD aims to start from a bug report B and a goal-searcher G and interleave the threads so that ESD reaches, as quickly as possible, an execution in which B’s deadlock manifests. For a sequential goal-searcher (§4) G, given two program positions px and py and a symbolic context Cx at position px , G(px , py ,Cx ) will find the fastest way to guide ESD from px to py , or soundly indicate the non-existence of such a path. ESD performs a serial execution of a parallel program, as if it was running on a single one-core CPU. The problem therefore reduces to deciding when to call G and with what parameters in the context of each thread ESD is symbolically executing. ESD’s search strategy is described in Algorithm 3; we illustrate the strategy with the example in Figure 2. We use hexagons labeled with the statement number to describe potential schedule switchpoints, and squares to describe the goal statements. In the discussion we ignore the symbolic context argument to G as it is not relevant to understanding this algorithm. The strategy is based on keeping a small set of checkpoints of the execution at each lock acquisition. The set is small because the states are deleted after a successful unlock operation. First, in thread T1 , we do GT1 (ENTRY, p4 ), to guide ESD to p4 . This corresponds to the point at which T1 has acquired both A and B: ENTRY
p1
p2
ENTRY
p1
... p2: ...
p3 p2
... p4: ...
p4
p5
p6
EXIT
p3
p4
p5
p6
EXIT
A checkpoint state is saved at both p1 and p2 , but the checkpoint at p1 is deleted by the corresponding unlock operation at p3. The intuition of saving checkpoints at lock operations is that the checkpoint marks a point where a preemption can be inserted with high probability of reproducing the deadlock because the lock could be the outer lock that is involved in the deadlock but is not in the bug report. In the current example, this is exactly the acquisition of B at p2 . Since locks that have been unlocked cannot participate in the deadlock, we can safely delete checkpoints for lock operations that have been unlocked. When reaching p4 thread T1 reached the goal (the inner lock operation from the bug report) and ESD decides to schedule T2 . However, T2 cannot proceed to lock A at p1 because A is locked by T1 . ESD detects this condition and the fact that it stores a checkpoint of the current execution state in which T1 is the running thread and reverts to that checkpoint. ENTRY
p1
p2
ENTRY
p1
... p2: ...
p3
... p4: ...
p4
p5
p6
EXIT
p3
p4
p5
p6
EXIT
p2
Now we do GT2 (ENTRY, p2 ) in T2 , but since A is locked, ESD switches execution to T1 which unlocks A at p3 and schedules back T2 . In other words, we execute GT1 (p2 , p3 ) and then switch to T2 at the p3 switchpoint: ENTRY ENTRY
p1
p2
p1
... p2: ...
p3
... p4: ...
p4
p5
p6
EXIT
p3
p4
p5
p6
EXIT
p2
Now we attempt once again to do GT2 (ENTRY, p1 ) and now T2 will be able to get past p1 . At the immediatelyfollowing switchpoint, p1 , we switch from T2 to T1 . T1 will attempt to lock A by executing GT1 (p3 , p4 ) However, A is locked by T2 and we have to produce a context switch and schedule T2 : ENTRY
p1
p2
ENTRY
p1
... p2: ...
p3
... p4: ...
p4
p5
p6
EXIT
p3
p4
p5
p6
EXIT
p2
After switching to T2 , we execute GT2 (p1 , p2 ) and thus reach the deadlock condition. The search has yielded the following path (plus all the constraints collected along the way by ESD): ENTRY
p1
... p2: ... ENTRY
p2
p3
... p1: ...
... p4: ... p1
... p2: ...
This algorithm is generalized to more than two threads. In practice we found that this search strategy performs better
than the iterative context bounding algorithm because it is a more directed form of search. Moreover, it was able to quickly discover all deadlock bugs we experimented with. Note that in this example we did not worry about any data dependencies or environment aspects that may make certain executions infeasible. In such cases, ESD can detect that the deadlock cannot be reproduced from the current state and resume the execution with the regular scheduling policy until one of the threads reaches the goal instruction again, in which case, ESD retries to reproduce the deadlock using the same strategy. 5.2 Other Strategies A simple approach to exploring thread schedule interleavings likely to cause concurrency bugs is to identify the common prefix of the backtraces involved in the bug. We denote the function f to be the last frame of the common prefix and set this as a goal for each of the threads. ESD will start exploring executions using a round-robin scheduler until the goals are reached in each thread. If one thread T reaches the goal, it is preempted until all other threads reach the goal f . In the example in Figure 2 the goal is the entry in function thr. After all threads reached their goals, the ESD scheduler will fork execution on schedule decisions and explore executions where each thread can be preempted a given number of times. The advantage of this heuristic is that it avoids exploring unnecessary thread schedules early in the execution of the program. 5.3 Multi-Threaded Symbolic Execution ESD enables multi-thread symbolic execution: it can explore both outcomes of a branch instruction and all possible scheduling decisions at a given point in the execution of a program. To enable this, ESD characterizes the currently explored execution by an address space, the program counter and stack of the currently executing state. A state is in fact the abstraction of a process. ESD extends Klee [2] with support for multithreaded executions compatible with POSIX threads, by augmenting each process with a list of threads. To schedule a thread, ESD simply replaces the stack and instruction pointer of the current state with the one of the next thread to execute. Thus, ESD behaves similar to an operating system and can perform context switches at instruction level granularity. ESD’s scheduler enforces single thread execution by scheduling one thread at a time. The decision which thread to schedule next is made before and after each call to any of the synchronization functions or after a possible data race is detected. By default it supports a round-robin scheduling policy and other policies can be added easily. In order to explore multiple thread scheduling decisions, ESD can fork execution and create executions in which each of the enabled threads is the running thread. Forking the execution when deciding which thread to run next will theoretically also duplicate the address space of the execution state. However, we leverage the copy-on-write mechanism
of the symbolic execution engine. Copy-on-write is done at the level of a memory object within an address space, instead of page level. This means that the address space is not duplicated when forking on a schedule decision since the address space is common to both states. Moreover, only the objects modified in the future execution of the resulting states need to be duplicated. This keeps ESD’s memory consumption low. Since ESD offers a compliant pthreads implementation, it could be used to perform fault injection on applications that use the pthreads library incorrectly (i.e. do not initialize mutexes or do not check the return codes from pthreads functions).
6. Execution Replay The next phase of the debugging, after the bug is found, is to make subsequent replays 100% deterministic. Moreover, in order to offer meaningful debugging information to the developer, this phase has to work with the native binaries. ESD achieves this by enforcing the program inputs and thread schedule on the native binary. Moreover, it allows developers to run or attach with the debugger at any time during the execution of the program. This approach allows them to repeat the process over and over again. The deterministic replay engine is not single threaded, but schedules only one thread at a time, even though multiple CPUs are available. We believe that this approach makes it easier for the bug to be understood and allows the developer to reason about the bug and quickly produce a fix. Once the fix has been applied, the developer can re-run ESD and see if the fix is correct. 6.1 Saving Synthesized Executions The most important challenge is saving the synthesized execution in a way that can be replayed on unmodified binaries. This includes saving the interactions with the external environment (for instance replaying the outcomes of system calls and providing the concrete values of the symbolic values) as well as efficiently saving the thread scheduling information. The symbolic execution engine keeps track of all synchronization operations. It keeps shadow data structures to describe threads, mutexes and condition variables associated with the real address of these variables. These data structures hold meta-data such as which thread holds which lock at a particular point of the execution. This information is saved in the trace after each synchronization operation. Note that since ESD executes these operations in a single thread, the order in which they appear in the trace is a valid single processor schedule. We use Lamport’s happens-before relation [16] to store the relative order of the synchronization operations. ESD also saves this information in a file in order to allow the playback of this trace with a higher degree of parallelism (§6.2). Thus, independent thread synchronization operations are not ordered during the replay.
ESD can save the order of calls to both pthread mutex and condition variables primitives, which allows it to synthesize deadlocks involving both these primitives. ESD also runs a deadlock detection algorithm and automatically detect a deadlock involving mutexes. Deadlocks involving condition variables are harder to detect automatically. However, the scheduler can check if the threads cannot make any progress. In this case, ESD creates a deadlock test case which contains the synchronization trace that is used to deterministically replay that execution in the debugger. 6.2 Debugger-Transparent Playback Once a trace of the synthesized execution of the bug is available, a replay driver runs it using the unmodified native binaries. The driver takes from the trace the concrete values of the program inputs found by symbolic execution and constructs the command line arguments and the concrete file objects from the synthesized execution ([2]). The replay test driver can then either automatically attach the debugger (i.e. gdb) at any point during the execution or replay the execution outside the debugger. The thread schedule replay is done by intercepting the pthreads synchronization primitives from a shim library and using a cooperative scheduler underneath. The replay driver allows native threads to be created and only enforces the order of the synchronization operations to be the one in the trace. Therefore all the functionality of the traditional debugging environment can be used, such as breakpoints, backtraces, etc. ESD’s replay driver can be configured to perform a serial or parallel execution playback. In the serial execution all operations need to execute in the same order as they were recorded when generating the synthesized execution. In the parallel execution playback, more then one thread can run in the same time and the replay driver simply ensures that the synchronization operations respect the happens-before relation recorded in the synthesized execution trace.
7. Implementation In this section we give an overview of the main challenges we faced when implementing the three main components of ESD: the multi-threaded symbolic execution environment (§7.1), synthesizing an execution path techniques (§7.2) and the replay environment and the integration with the debugging environment (§7.3). 7.1 Multithreaded Symbolic Execution ESD uses Klee as the symbolic execution environment, to which we added POSIX threads support. Klee is also augmented with a single threaded cooperative thread scheduler. The scheduler can explore any legal scheduling decision but can be configured with various search heuristics to explore schedules that are likely to cause deadlocks. ESD has support for most common pthreads functions such as
thread, mutex and condition variables management, including Thread Local Storage functions. The thread functions are implemented as special function handlers that replace the actual calls to the real pthreads library and transfer execution to the ESD environment. One challenge was to implement thread support in ESD and still use Klee’s copy-on-write mechanism for memory objects, which is a key reason for ESD’s scalability. To achieve this, ESD maintains the abstraction of a process with an associated address space in Klee and allows each process to have several associated threads that share the address space. For instance, to create a thread, ESD’s thread library resolves at runtime the associated start routine function pointer and sets the thread’s PC to the start routine, creates internal thread data structures and a new thread stack and enqueues this thread for execution.
vironment. ESD achieves this by allowing the real call to pthread_mutex_unlock to execute. However, it does not return from the instrumentation wrapper until the other relevant operations in the trace have finished executing which effectively causes the preemption to occur. The replay driver is very lightweight and does not insert any visible delays to the debugger. Replaying the thread schedules follows similar concepts a cooperative thread scheduler and underneath uses condition variables. It can be easily extended to accommodate new functionality and can replay deadlocks involving both mutexes and condition variables. Our current implementation has less than 500 LOC.
7.2 Execution Synthesis
In this section we evaluate ESD’s effectiveness by reproducing bugs in real systems (§8.1), after which we analyze in depth the efficiency of ESD’s execution synthesis and compare it to other approaches (§8.2). All experiments are run on a 2 GHz quad-core Dell Precision T7400 with 4GB of physical memory running 32-bit Linux; ESD had a total of 2GB of memory available.
The executing state in ESDcan be changed after executing each instruction from the tested program, therefore selecting the next state has to be efficient. We optimized the evaluation of the distance to the goal instruction by using caching of computed distances and custom sorted data structures for maintaining the search state information. We implemented a partial networking support that allows ESD to use socket calls such as socket creation and ioctl by calling their native version (for instance to set a non-blocking flag for a socket, etc.). The main unsupported features are send/receive, for which a network model is required. We are working on extending it with full network support, similarly to the symbolic file system. Additionally, in order to replay a large range of code we had to write special function handlers for functions that are typically implemented as inline assembly which is not yet supported by ESD. We are currently implementing the dynamic data race detection discussed in §5. ESD currently uses a static data race detection tool. Moreover, the thread schedule heuristic used to reproduce data races is similar to the state of the art, also used by Chess. We intend to explore more efficient heuristics in the future. 7.3 Replay Environment To allow transparent debugging, ESD does not execute within a single thread, but instead allows the program to create real threads and calls the actual synchronization operations with the same arguments as passed from the replayed program. However, it delays the operations until they can execute in the order specified by the trace. It achieves this from a shim library implemented using LD_PRELOAD. One of the challenges encountered by the replay environment was to insert a preemption right after a call to pthread_mutex_unlock and allow another thread to resume execution instead. The ESD searcher can easily insert such preemptions because it runs in a single threaded en-
8. Evaluation
8.1 ESD Effectiveness for Real Systems We first wanted to see if ESD can automate debugging of real systems code. Table 1 shows representative examples of the programs we ran, ranging in size across three orders of magnitude, from >100 KLOC (SQLite) down to 107 LOC (mkfifo). One class of bugs results in hangs. For example users report occasional deadlocks when calling the custom recursive lock implementation in SQLite 3.3.0, an embedded database engine used in many products, such as Firefox and Apple Mail. SQLite is a particularly interesting target, since it has a reputation for being highly reliable and their test suites achieve 99% statement coverage [25], which makes us think that the remaining bugs are there because they are particularly hard to reproduce. Another such bug is in HawkNL 1.6b3, a network library specific for distributed games— when two threads happen to call nlClose() and nlShutdown() at the same time on the same socket, HawkNL deadlocks. Other bugs result in crashes. A bug in the paste UNIX utility causes an invalid free for some inputs. The four bugs in the tac, mkdir, mknod, and mkfifo utilities are all segmentation faults, with the last three occurring only on hard-to-exercise error handling paths. We verified that the bugs are indeed hard to reproduce manually. To maintain objectivity, we ran a variety of stress tests as well as scripted random input testing over the course of several hours, and neither of these tests caused the bugs to manifest. We also tried other approaches based on execution path exploration (such as the ones in Klee [2] and Chess [19]) to try and find a path leading to the bug; after
Bug manifestation hang hang crash crash crash crash crash
Execution synthesis time 150 seconds 122 seconds 25 seconds 20 seconds 15 seconds 15 seconds 11 seconds
Table 1: ESD applied to real bugs. ESD synthesizes a reproduction path in tens of seconds, while other tools could not find a path at all in our experiments capped at 1 hour.
100 10 1
te Li SQ NL k aw H e st pa d o kn m ifo kf m r i kd
m
c ta
ls 3
ls 4
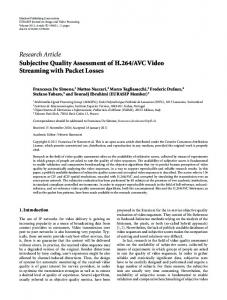
Having found ESD to be efficient in finding a path that reproduces elusive bugs, we now analyze in more depth ESD’s efficiency and compare it to alternate approaches. Besides core debugging tools like ESD, bug search tools (like Klee [2] and Chess [19]) can also be used to find paths to bugs—these tools produce test cases meant to reproduce the found bugs, and these test cases determine a path (or family of paths). Comparing the path-search efficiency of ESD to these tools may not seem fair, since they find a bug in the first place, while ESD only finds a path to an already-
ESD DFS RandPath
ls 2
8.2 Efficiency of Execution Synthesis
1000
ls 1
running for at least 1 hour for each bug, neither alternate approach found a path; more details are provided in §8.2. ESD synthesized the bug-bound execution paths entirely automatically. It compiled the program and linked libraries using the standard LLVM tool chain. We then provided ESD each bug report in the form of the program’s call stack at the time of the bug manifestation—this can be easily extracted from the coredump. ESD then synthesized an execution path that reproduces the bug under consideration, verified it, and produced the program inputs and replay thread schedule trace, amounting to less than a couple of MB in each case. Using ESD’s output, we were able to replay inside gdb each bug 100% deterministically, even the multi-threaded ones. While we suspect there may exist a negligible performance overhead during the replay, we did not measure it, since it is irrelevant given that the replay is entirely deterministic. What matters is that this overhead was not perceptible to a human being, which means that it does not impact the developer’s debugging experience. This preliminary validation indicates that ESD can be used effectively not only for programs, but also for shared libraries. This is important, because bugs inside libraries (such as SQLite and HawkNL) can affect potentially many applications. In order to reproduce library bugs, one needs to write a program that exercises the library through the entry points know to lead to the bug (e.g., a program that uses SQLite’s recursive lock, or two threads calling both nlClose() and nlShutdown()). These “driver programs” are then provided with symbolic inputs by ESD and a symbolic thread schedule, in order to explore the paths in the library.
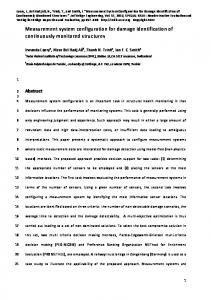
known bug. However, ESD can synthesize execution paths for bugs that occur in production, away from ESD, while these other tools can only reproduce bugs that occur under their own close watch. In order to compare ESD to Klee and Chess, we extended Klee to support multithreaded programs, and we implemented Chess’s preemption-bounding approach to exploring multithreaded executions [19]. The result is KleeChess, a hybrid tool that embodies the best of both Klee and Chess. We compare ESD to two different KleeChess search strategies, inherited directly from Klee: DFS, which can be thought of as equivalent to an exhaustive search, and RandomPath, a quasi-random strategy meant to maximize global path coverage. We augmented the corresponding strategy modules to encompass all active threads and limit preemptions to two, as done in [19], where the authors argued that two preemptions can find most real bugs. As mentioned earlier, none of the existing tools were able to find a reproduction path for the real-world bugs in §8.11 . In order to have a baseline for comparison, we introduced four artificial bugs in the ls UNIX utility, for which these tools do find a path; ls has 3 KLOC. Figure 3 shows that ESD is one to several orders of magnitude faster at finding the path to the target bug, when compared to the two variants of KleeChess. As mentioned previously, we do not know if KleeChess would find the path to the §8.1 bugs and, if it did, how long that would take, but we do know it would take longer than 1 hour. Path synth time [seconds] ( log scale )
System SQLite HawkNL paste mknod mkdir mkfifo tac
Figure 3: Comparison of time to find path to bug: ESD vs. the two variants of KleeChess. Bars broken at the top indicate KleeChess did not find a path within 1 hour. We developed a microbenchmark for analyzing the contributions of this paper (zero-tracing execution path synthesis and the corresponding heuristics) without the measurements being influenced by environment interactions, such as library calls, system calls, etc. We think of this BPF benchmark as a way to compare the performance of “bug path finding” tools. 1 Readers
will note that the UNIX utilities bugs were found and reported by Klee’s authors. Since [2] does not state how long it took to find the inputs that trigger the bugs, and our 1-hour experiments with Klee did not find them, we are working with the Klee team to reproduce those results.
Path synth time [seconds] ( log scale )
ESD KleeChess
100
10
1 2
4
5
6
7
8
9
10
2 2 2 2 2 2 Number of branches in program
2
11
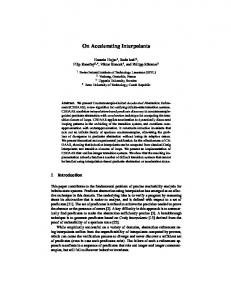
Figure 4: Synthesizing a bug-bound path for programs of varying complexity.
An alternate perspective on these results is to view them in terms of program size. Figure 5 shows the same data, but in terms of KLOC in the generated programs. Path synth time [seconds] ( log scale )
BPF produces “synthetic” programs that hang and/or crash. These programs have if branch instructions that depend on the program inputs, thus enabling a symbolic execution tool to explore the various paths through the program. When using more than one thread, the crash/hang scenarios depend on both the thread schedule and program inputs. BPF allows direct control of five parameters for program generation: number of program inputs, number of total branches, number of branches depending (directly or indirectly) on inputs, number of threads, and number of locks. We performed experiments with seven configurations of BPF. All data points correspond to programs with two threads and two locks, in which every branch instruction depends (directly or indirectly) on the program inputs. There is one deadlock bug in each generated program. We vary the number of branch instructions from 23 to 210 , which means that the number of possible branches varies from 24 to 211 . We explored several other benchmark configurations, but the results were in line with what one would expect, based on the results shown here. In an attempt to quantify the deadlock probability for each program, we ran stress tests on each one. Alas, neither of them deadlocked, implying that each program has a low probability of deadlocking “in practice,” making these settings sufficiently interesting for our measurements. We then allowed ESD to synthesize an execution path exhibiting the deadlock bug and we confirmed its validity by replaying it in gdb. Figure 4 shows how the time to synthesize a bug-bound execution varies with the complexity of the program in terms of branches. We find that ESD’s performance varies roughly as expected; one exception is the jump from 28 to 29 branches—we suspect there were some structural features of the larger program that presented an extra challenge to ESD’s heuristics. Nevertheless, ESD performs well, keeping the time to synthesize a path to under 2 minutes, which is a reasonable amount of time for a developer to wait for a tool. We also included, for reference, the time taken by KleeChess with the RandomPath strategy; it found a path within one hour only for the two simplest benchmark-generated programs.
1000 ESD 100
10
1 0
5
10 15 20 25 30 Program size (in KLOC)
35
40
Figure 5: Synthesis time as a function of program size.
9. Discussion Ease of Use ESD can be used with minimal setup. It uses the same approach as Klee which means that developers simply have to compile their programs with the LLVM compiler infrastructure tools ([2]). ESD requires the additional step of passing the backtraces of the bug report in a file which is parsed to construct the goal instructions used to guide the search towards the bug. Once the bug is reproduced, developers can use their traditional debugging infrastructure to replay the bug using the unmodified binaries and the command: ./replay
[--with-gdb]
Limitations There are several approaches for which ESD might not be able to reproduce a bug. First of all, there is the inherent limitation of symbolic execution in solving complex constraints that accumulate on the path to the bug in any of the threads. For instance, symbolic execution will not be able to create a path that depends on the branch “if (x==hash(y))” to be taken when x is concrete and y is symbolic, therefore, this would be equivalent to breaking the hash function. Our approach is based on heuristics and static analysis to substantially trim down the search space that would otherwise be explored by a naive approach. These techniques can be imprecise and can cause ESD to explore too many states. More, ESD keeps the execution states in memory, therefore the number of states it can explore at one time is limited by the maximum amount of memory available. ESD’s usefulness would decrease if the bug is found after a long period of time. We did not experience this situation in any of the bugs we tried to replay with ESD. However, we advocate the use of ESD in the bug triage phase, where it can be used to confirm bug reports over night. Another limitation comes from the fact ESD does not yet fully model the interactions with the network, therefore it
cannot be used with programs where the bug occurs depending on the input from a network packet. We believe this limitation will disappear after adding a symbolic network model similar to the symbolic file system model in Klee. We have recently ported Klee to 64-bit architectures, but have not ported ESD to it yet; once we do so, ESD will be able to exploit configurations with more than 4GB of memory. Complementing Other Tools An interesting use of ESD could be to confirm true positives of static analysis. Static analysis commonly produces many false positives and selecting the true positives is a demanding task that requires human intervention. Such tools already produce outputs akin to a bug report, so ESD could be readily used to check if there indeed exists a feasible execution leading to the suspected bug. ESD can also be used as a bug finding tool. While searching for a bug, another bug may occur simply because ESD has complete control over the scheduler and can explore thread schedules that are less likely to occur in practice. In fact, while trying to reproduce the deadlock in SQLite, ESD uncovered a previously unknown deadlock, showing that the program can deadlock in more then one way. The two deadlocks were coincidentally fixed by the same patch.
10. Conclusion In this paper we present ESD, a tool for execution synthesis based debugging, meant to alleviate the burden of fixing hard to reproduce bugs. ESD starts from a bug report and automatically synthesizes an execution that manifests the bug. ESD can be easily adopted because it does not require any program modifications, and does not require any runtime tracing which means it has no overhead in production. We conclude that ESD is a practical solution to reproduce bugs. In total, we used ESD to reproduce concurrency bugs and crashes in real applications with over 100K lines of code, without human intervention. Moreover, ESD allows 100% deterministic debugging of the reproduced bug using traditional debuggers which, can significantly shorten the time to fix a bug. To our knowledge this is the first tool that can synthesize executions that exhibit a bug without incurring the overhead of recording the execution of the program at runtime.
References [1] G. Altekar and I. Stoica. ODR: Output-deterministic replay for multicore programs. In SOSP, 2009. [2] C. Cadar, D. Dunbar, and D. R. Engler. KLEE: Unassisted and automatic generation of high-coverage tests for complex systems programs. In OSDI, 2008. [3] M. Castro, M. Costa, and J.-P. Martin. Better bug reporting with better privacy. In ASPLOS, 2008. [4] J. Chow, T. Garfinkel, and P. M. Chen. Decoupling dynamic program analysis from execution in virtual environments. In USENIX, 2008.
[5] M. Costa, M. Castro, L. Zhou, L. Zhang, and M. Peinado. Bouncer: Securing software by blocking bad input. In SOSP, 2007. [6] M. Costa, J. Crowcroft, M. Castro, A. Rowstron, L. Zhou, L. Zhang, and P. Barham. Vigilante: End-to-end containment of internet worms. In SOSP, 2005. [7] G. W. Dunlap, S. T. King, S. Cinar, M. Basrai, and P. M. Chen. ReVirt: Enabling intrusion analysis through virtual-machine logging and replay. In OSDI, 2002. [8] G. W. Dunlap, D. Lucchetti, P. M. Chen, and M. Fetterman. Execution replay on multiprocessor virtual machines. In VEE, 2008. [9] D. Engler and K. Ashcraft. RacerX: Effective, static detection of race conditions and deadlocks. In SOSP, 2003. [10] J. Gait. A probe effect in concurrent programs. Software: Practice and Experience, 16(3), 1986. [11] P. Godefroid and N. Nagappan. Concurrency at microsoft - an exploratory survey. In CAV Workshop on Exploiting Concurrency Efficiently and Correctly, 2008. [12] Z. Guo, X. Wang, J. Tang, X. Liu, Z. Xu, M. Wu, M. F. Kaashoek, and Z. Zhang. R2: An application-level kernel for record and replay. In OSDI, 2008. [13] P. Joshi, C.-S. Park, K. Sen, and M. Naik. A randomized dynamic program analysis technique for detecting real deadlocks. In PLDI, 2009. [14] H. Jula, D. Tralamazza, C. Zamfir, and G. Candea. Deadlock immunity: Enabling systems to defend against deadlocks. In OSDI, 2008. [15] S. T. King, G. W. Dunlap, and P. M. Chen. Debugging operating systems with time-traveling virtual machines. In USENIX, 2005. [16] L. Lamport. Time, clocks, and the ordering of events in a distributed system. 1978. [17] C. Lattner and V. Adve. LLVM: A compilation framework for lifelong program analysis and transformation. In CGO, 2004. [18] S. Lu, S. Park, E. Seo, and Y. Zhou. Learning from mistakes – a comprehensive study on real world concurrency bug characteristics. In ASPLOS, 2008. [19] M. Musuvathi, S. Qadeer, T. Ball, G. Basler, P. A. Nainar, and I. Neamtiu. Finding and reproducing Heisenbugs in concurrent programs. In OSDI, 2008. [20] S. Narayanasamy, Z. Wang, J. Tigani, A. Edwards, and B. Calder. Automatically classifying benign and harmful data races using replay analysis. SIGPLAN Not. [21] Ohloh SQLite code analysis. https://www.ohloh.net/p/sqlite/analyses/467152, 2009. [22] S. Park, W. Xiong, Z. Yin, R. Kaushik, K. H. Lee, S. Lu, and Y. Zhou. Do you have to reproduce the bug at the first replay attempt? – PRES: Probabilistic replay with execution sketching on multiprocessors. In SOSP, 2009. [23] F. Qin, J. Tucek, Y. Zhou, and J. Sundaresan. Rx: Treating bugs as allergies – a safe method to survive software failures. ACM TOCS, 25(3), 2007. [24] S. Savage, M. Burrows, G. Nelson, P. Sobalvarro, and T. Anderson. Eraser: a dynamic data race detector for multithreaded programs. ACM TOCS, 15(4), 1997. [25] SQLite. http://www.sqlite.org/.