Article
Establishing a Framework for Evaluating Environmental and Socio-Economic Impacts by Power Generation Technology Using an Input–output Table—A Case Study of Japanese Future Electricity Grid Mix Shunichi Hienuki 1, *, Yuki Kudoh 2,† and Hiroki Hondo 1,† Received: 30 September 2015; Accepted: 20 November 2015; Published: 27 November 2015 Academic Editor: Yasuhiro Fukushima 1 2
* †
Graduate School of Environment and Information Sciences, Yokohama National University, 79-7 Tokiwadai, Hodogaya-ku, Yokohama 240-8501, Japan;
[email protected] Research Institute of Science for Safety and Sustainability, National Institute of Advanced Industrial Science and Technology, 16-1 Onogawa, Tsukuba 305-8569, Japan;
[email protected] Correspondence:
[email protected]; Tel./Fax: +81-45-339-4372 (ext. 4372) These authors contributed equally to this work.
Abstract: Input–output (IO) analysis is a useful economic method to evaluate the potential socio-economic and environmental impacts associated both directly and indirectly with energy technologies. Using an IO table, this study establishes a scenario analysis framework to evaluate the socio-economic and environmental impacts arising from future power generation technology mixes. The impact indices selected are employment generation and greenhouse gas emissions. The study adopts a hybrid method for the framework it establishes: a combined bottom-up and IO life cycle inventory analysis approach to reflect the technological differences by power generation technology. Using an IO table for future analysis is limited because the industrial structure is fixed to the IO table benchmark year and it is thus not possible to reflect any potential inter-sector transaction changes that may arise from technological progress. However, the framework is valuable in estimating the future potential impacts that might arise from the current industrial structure and technology level. A case study is conducted using the established framework on the potential impacts of Japan’s future grid mix scenarios. The case study considers the differences in lead-times and durable years per power generation technology to ascertain the continuous and temporary jobs and greenhouse gas (GHG) emissions. Keywords: scenario analysis; future grid mix; socio-economic and environmental impacts; input–output table; life cycle inventory analysis
1. Introduction In the aftermath of the Great East Japan Earthquake of March 2011, the entire Japanese energy demand and supply system faces a turning point. Nuclear power plants were regarded as the core power supplies prior to the earthquake and the previous Basic Energy Plan [1] assumed an increase in the ratio of electricity supply from nuclear and renewable sources from 34% in 2007 to over 50% in 2020 and 70% in 2030. To achieve its targets, the Plan called for the construction of nine new nuclear power plants and an 85% improvement in nuclear power plant capacity factors by 2020, with a further fourteen or more new plants and an improved capacity of 90% by 2030. The current administration reviewed the Basic Energy Plan subsequent to the Fukushima nuclear accident that
Sustainability 2015, 7, 15794–15811; doi:10.3390/su71215786
www.mdpi.com/journal/sustainability
Sustainability 2015, 7, 15794–15811
was a direct result of the March 2011 earthquake. The current Plan [2] stipulates that nuclear energy remains an important source of electricity and that a mix of nuclear, renewables and fossil fuels will be the most reliable and stable electricity source to meet Japan’s energy needs. However, the current Plan does not specify the exact future power mix and some factors remain uncertain such as the number and timing of nuclear power plant recommencements. In terms of renewable energy deployment, the Japanese government implemented a feed-in-tariff (FIT) scheme in July 2012 for renewable energy sources such as geothermal, wind, photovoltaic (PV), small hydro and biomass power generation [3]. This FIT scheme is expected to stimulate growth and generate employment in the industries related to environmental technologies, in addition to improving energy self-sufficiency and reducing carbon dioxide (CO2 ) emissions in Japan. JREF [4] estimates that the ratio of renewable sources (with the exception of hydro) has risen from 1.4% of the national electricity supply in 2011 to 2.4% in the first half of 2013 as a result of the FIT scheme. Moreover, approximately 90% of the PV contractors and installers have experienced a sales increase and employee numbers have increased in approximately 80% of PV power producer companies [5]. However, the current FIT scheme does not include exact mid- and long-term targets for renewable energy installations [6], and 94% of the renewable energy facilities approved under the FIT scheme are for PVs [7]; thus, renewable energy deployment faces similar uncertainties to nuclear power plants. Various studies have focused on nuclear and renewable energy policies toward achieving the Japanese greenhouse gas (GHG) reduction target under the Kyoto Protocol [8]. Nakata [9] analyzed the relationship between carbon tax and nuclear power plants in the future using an energy partial equilibrium model. Takase and Suzuki [10] assessed the impact of nuclear power plants on gross domestic product (GDP) and on CO2 emissions using the LEAP (Long-range Energy Alternatives Planning) software system that can simulate the energy use in line with the relevant future scenario. In terms of scenario analysis for nuclear power plants after the Great East Japan Earthquake, Zhang et al. [11] evaluated the impact of future nuclear power supply scenarios in consideration of technological, economic and environmental restrictions using an hour-by-hour energy demand-supply model. Pereira et al. [12] studied cumulative non-renewable energy consumption, global warming potential, terrestrial acidification potential, particulate matter formation and the power generation cost in 2030 by combining the life cycle intensity of each power technology and the future grid mix scenarios. These scenario analyses mainly focus on the environmental and economic impacts of nuclear and renewable energies: few studies have investigated the industry impacts or the employment generation effects associated with the selection of future power generation technologies. Employment generation is particularly identified as one of the essential dimensions for measuring the well-being of societies [13]. Japan’s MHLW [14] aims to increase and improve the quality of employment generated in new growing fields to foster a sustainable and vital economic employment system. On the other hand, the econometric input–output (IO) tables are useful in evaluating the direct and indirect socio-economic and environment impacts of energy technologies simultaneously within the same system boundary. IO tables offer sectoral structures in terms of costs, employment generation and GHG emissions; however, IO analyses are restricted by (1) the economy of the country or region being expressed in a matrix form comprising a limited number of sectors; and (2) the IO structures being sector-level averaged. Therefore, it is necessary to make certain adjustments to assess energy technologies through IO tables by reflecting the technological properties of the target system or product. The methodologies that have been applied in previous studies can be classified into three categories. The first category evaluates the socio-economic impact associated with renewable energy technology introduction by allocating the cost of the technologies to the sectors of the IO table based on detailed technical data [15–18]. The second category creates an extended IO table from the original IO table using detailed cost and employment data obtained by interviews and statistics. Ciorba et al. [19] and Lehr et al. [20] used this method to evaluate the impact on the Moroccan and German labor markets,
15795
Sustainability 2015, 7, 15794–15811
respectively, of the introduction of renewable energy technologies. The current authors [21,22] have previously calculated the life cycle employment intensity of renewable energy technologies using an extended IO table by disaggregating the sectors related to renewable energy from the original Japanese 2005 IO table. The third category applies a so-called hybrid method of bottom-up and IO approaches to life cycle inventory analysis, to which the characteristics of the target technology can be reflected. From an employment analysis perspective, this category estimates the specific technology’s direct employment from interviews and statistics, while the indirect impacts are calculated using an IO table. Silalertruksa et al. [23] used this hybrid method to calculate the impact of introducing energy technologies on employment in Thailand. Tsurugai et al. [24] and Hondo and Kikuchi [25] also applied this method to establish the employment impact on the Japanese economy of introducing biomass energy. A further restriction imposed on IO table assessments is that the IO structure and the technological level of the sectors are fixed to the IO table base year so that projections cannot reflect all the possible future changes that may occur in industrial structures. Acknowledging this restriction, however, IO tables are valuable in grasping the future socio-economic and environmental impacts that may ensue from the current technological information available and in determining a future direction for technology selection and policy implication from a macroscopic perspective. Therefore, this study established a scenario analysis framework to evaluate the environmental and socio-economic impacts of selecting a power generation technology. Using the framework established, a case study was conducted as to the potential socio-economic and environmental impacts on the Japanese economy from the future grid mix scenarios. 2. Socio-Economic and Environmental Impact Estimations Sustainability 2015, 7
4
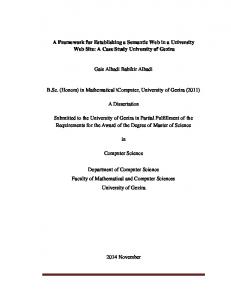
Figure 1 shows the overview of the framework established in this study. From the amount of 2. Socio-Economic and Environmental Impact Estimations electricity generated and grid mix in 2012 and 2030, the breakdown of electricity per year during this Figure 1 shows the overview of the framework established in this study. From the amount of period are estimatedelectricity by each source considering the resume operation (in nuclear power plant), new generated and grid mix in 2012 and 2030, the breakdown of electricity per year during this are estimated by replacement, each source considering the resume operation (in nuclear power plant), new manufacturing, newperiod construction, operation, maintenance and decommissioning. manufacturing, new construction, replacement, operation, maintenance and decommissioning. Future grid mix scenarios (2012-2030) Electricity generated and grid mix in 2012
Assumed electricity generated and grid mix in 2030
Breakdown of grid mix by each year • • • •
• • • • • • •
Nuclear Renewable energy Large-scale hydro Fossil fuel
Resume operation New manufacturing New construction Replacement Operation Maintenance Decommissioning
Manufacturing and construction (M&C), operation and maintenance (O&M) and decommissioning Tentative annual data of future grid mix (2012-2030) Hybrid approach Employment and energy consumption
Cost data of goods and services
Bottom-up approach (Direct effects)
IO approach (Indirect effects)
Environmental and socio-economic impacts
Figure 1. Framework overview.
Figure 1. Framework overview. This study applies a hybrid of bottom-up and IO approaches for life cycle inventory analysis to reflect the socio-economic and environmental impact characteristics of each power generation technology. The socio-economic and environmental indices selected are employment generation and GHG emissions.
15796
Sustainability 2015, 7, 15794–15811
This study applies a hybrid of bottom-up and IO approaches for life cycle inventory analysis to reflect the socio-economic and environmental impact characteristics of each power generation technology. The socio-economic and environmental indices selected are employment generation and GHG emissions. In the Japanese IO table, the power generation technology construction stage belongs to the electric power facilities construction sector and the power generation stage is classified under the electricity sector. This classification is common to all power generation technology types; hence, the conventional IO approaches cannot reflect the characteristics of each power generation technology in the estimation. To address this shortcoming, a bottom-up approach is used to estimate the direct impact of the target power generation technology by gathering detailed data regarding, the employment generated and the energy consumption for each technology. For the indirect impact, the IO approach is adopted to estimate the required goods and services by providing detailed final demand cost data for each power generation technology. The employment and GHG emissions that are directly and indirectly induced by each power generation technology can be estimated using Equations (1) and (2). ˆ pI ´ Aq´1 ¨ f t,i Lt,i “ Ld,t,i ` l¨
(1)
ˆ pI ´ Aq´1 ¨ f t,i Gt,i “ Gd,t,i ` g¨
(2)
where Lt,i is the direct and indirect employment created by power generation technology i in year t, Gt,i is the direct and indirect GHG emissions, Ld,t,i is the direct employment, Gd,t,i is the direct GHG emissions, lˆ is the diagonal matrix of employment coefficient, gˆ is the diagonal matrix of GHG emissions, I is the unit matrix, A is the input coefficient matrix and f t,i is the final demand. This study uses the latest 2005 competitive import type Japanese IO table [26] that comprises 520 rows and 407 columns in a rectangular matrix form for the basic sector classification: some sectors are aggregated to a 401-dimensional square matrix for the analysis. The employment coefficient lˆ represents the number of employees per unit of production and is estimated using the 2005 employment table that is published as a supplement to the IO table. The GHG emissions gˆ uses the embodied GHG emissions estimated from the Japanese IO table [27]. 3. Case Study Assumptions and Scenarios 3.1. System Boundary As shown in Figure 2, the case study power generation technology life cycle stages are manufacturing and construction (M&C), operation and maintenance (O&M), safe storage (for nuclear only) and decommissioning. Granted that currently large amount of money is invested in research and development (R&D) of renewables, in particular power generation by wind and solar PV, the R&D stage is out of the system boundary of this study due to the difficulty to obtain reliable cost data for this stage. Notably among the target life cycle stages, the generated employment and the GHG emission impacts associated with the O&M stage are ongoing while the power plant is in operation, whereas their M&C and decommissioning stage impacts are only apparent during the respective life cycle stages. Hence, it is important to consider the lead-time and the durable years of each technology in the long-term scenario analysis.
15797
Sustainability 2015, 7, 15794–15811
Sustainability 2015, 7
6
M&C
Construction starts Manufacturing and construction [M&C]
O&M (Durable years)
Life cycle
Commercial operation starts
Life cycle stages common all technologies Life cycle stages specific to nuclear
Operation and maintenance [O&M] Suspended [nuclear]
Decommissioning
Commercial operation ends Safe storage [nuclear]
Decommissioning Decommissioning ends
Figure2.2.Assumed Assumedsystem system boundary Figure boundarytotoall alltechnologies. technologies.
3.2. Power Power Generation Specifications 3.2. GenerationTechnology Technology Specifications The power generation technologies selected for the case study are nuclear, fossil fuels (coal,
The power generation technologies selected for the case study are nuclear, fossil fuels (coal, oil and oil and liquefied natural gas (LNG)), large-scale hydro power plants and three renewable sources liquefied natural gas and (LNG)), power and threeassumed renewable (geothermal, wind (geothermal, wind solarlarge-scale PV). Tablehydro 1 shows theplants specifications forsources each power generation and solar PV).[28–43]. Table 1 shows the specifications assumed for eachinpower [28–43]. The technology The assumed decommissioning costs Tablegeneration 1 are 15%technology and 5% of the O&M cost of nuclear and othercosts power plants respectively [31]. Importantly, thenuclear O&Mand stage cost for assumed decommissioning in Table 1 are 15% and 5% of the O&M cost of other power each power plant shown in Table 1 excludes any additional costs that may be incurred because of plants respectively [31]. Importantly, the O&M stage cost for each power plant shown in Table 1 excludes unexpected accidents. any additional costs that may be incurred because of unexpected accidents. To reflect the technical characteristics of each power generation plant, items such as direct value To reflect the technical characteristics of each power generation plant, items such as direct value added V , direct employment L , direct GHG emissions Ed,i and final demand f i , are estimated final demand , are estimated from added ,d,i, direct employment , ,d,idirect GHG emissions , and from data obtained by interviews, previous studies and statistics [21,22,26,43,44]. The Japanese 2005 data obtained by for interviews, previoushence studiesit and statisticsthat [21,22,26,43,44]. The Japanese IO table IO table is used the calculations, is assumed the future industry structure2005 remains the issame usedasfor the calculations, hence it is assumed that the future industry structure remains the same as that of 2005 and all costs are adjusted to 2005 prices using the GDP deflator [45]. that ofThe 2005 andand all costs are adjusted tostage 2005embodied prices using the GDPare deflator [45]. by dividing Lt,i and M&C decommissioning intensities calculated Gt,i inM&C Equations (1) and (2) by the generation each power by plant shown ,inand Table, 1. The and decommissioning stage embodied capacity intensitiesofare calculated dividing in The O&M(1) stage intensity iscapacity estimated by dividing, Lt,ishown and Gint,i Table by the amount Equations and embodied (2) by the generation of each power plant 1. annual The O&M stage of power generated (E (kWh)) that can be calculated from Equation (3). The annual employment i embodied intensity is estimated by dividing, , and , by the annual amount of power generated generated and GHG emissions can be calculated by multiplying the generation capacity (in kW unit) (E (kWh)) that can be calculated from Equation (3). The annual employment generated and GHG and power generation amount (in kWh unit) of each year by the calculated embodied intensities. emissions can be calculated by multiplying the generation capacity (in kW unit) and power generation amount (in kWh unit) of each year byEthe intensities. (3) Ci ¨ 365¨ 24¨embodied ui ¨ p1 ´ au i “calculated iq E = C ∙ 365 ∙ 24 ∙ u ∙ (1 − au )
(3)i where Ci is the generation capacity, ui is the capacity factor of power generation technology i and au is the auxiliary power ratio.
15798
Sustainability 2015, 7, 15794–15811
Table 1. Power plant specifications. 2005 Prices: Million JPY * Generation capacity Load factor Internal consumption rate Manufacturing and construction cost Operation and maintenance cost Decommissioning cost Manufacturing and construction Operation and maintenance Safe storage Decommissioning
Large-Scale Hydro
Coal
1,150,000
650,000
(%)
80
-
-
-
-
(%)
4.3
-
-
-
-
123
130
-
92
-
5.4
5.4
9.7
6.4
18.4
6.5
4.6
(years)
7
4
(years)
40
(years) (years)
15 3
(kW)
(million yen/MW) (million yen/GWh) (million yen/MW)
Oil
Liquefied Natural Gas (LNG)
Nuclear
530,000
530,000
-
Geothermal Wind 50,000
PV
2000
3.5
80
20
12
5.0
5.0
0
583
150
486
4.2
12.8
7.1
25.9
4.6
-
29.2
7.5
24.3
-
2
-
1
1
1
40
30
30
-
40
25
25
1
1
1
-
1
1
1
* USD equivalent can be calculated using the currency rate of 110.22 JPY per USD in 2005 [46].
To reflect the specific year difference for the M&C, safe storage and decommissioning stages of each power generation technology, the estimated employment generated and GHG emission amounts from these stages are divided by the required years and allocated to each year. It is clear that some of the parameter settings for conducting case studies using the framework established may affect the final results. The parameters that may significantly influence the final results but were necessarily assumed because of data restrictions are discussed next. In the wake of the Great Eastern Japan earthquake, it is difficult to obtain detailed data for Japanese nuclear power plants. Nuclear power plants that are presently suspended but are under review—or are ready for safety reviews—to resume operations are required to allocate additional costs for safety measures against tsunami and earthquake damage [47]. However, the securities reports of the ten Japanese electric power companies show that the total nuclear power generation cost has dropped from 1.7 trillion Japanese yen (JPY) before the earthquake to 1.3 trillion JPY after the earthquake [48]; however, the cost breakdown is not provided. Therefore, the case study presumes that the same O&M stage goods and services inputs are required for the maintenance of the suspended nuclear power plants. Fifteen years of safe storage to reduce the radiation level of the plant components are required prior to the decommissioning stage [49,50]. As there is a lack of cost data for the safe storage stage, the study assumes that the stage requires the same goods and services inputs as the O&M stage. In terms of electricity from renewable energy sources, a residential solar PV system with a 3.5 kW capacity is assumed for the solar PV estimation. Although the number of mega solar power plant installations are currently increasing under the FIT scheme and it is anticipated that large-scale industrial use solar PVs will play an important role in increasing the amount of electricity generated from renewables in the future, the reason behind this assumption is that in 2005 (the IO table benchmark year used in the case study) approximately 90% of domestic shipments of solar PV cells were for residential use [51]. Biomass and waste are also candidate renewable energy sources for power generation. However, Japan [52] estimates that the proportion of electricity generated from these sources will only be 3% of the total electricity generated in 2030 and they are therefore included in electricity generated from fossil fuel-powered plants in this case study. 3.3. Scenario Settings The case study period is 2012–2030. The total electricity supply in 2012 is set at 1093 TWh [53] and the amount of electricity generated in 2012 is estimated for each power generation technology by
15799
from fossil fuel-powered plants in this case study. 3.3. Scenario Settings Sustainability 2015, 7, 15794–15811 The case study period is 2012–2030. The total electricity supply in 2012 is set at 1093 TWh [53] and the amount of electricity generated in 2012 is estimated for each power generation technology by utility and by non-utility powerAlthough [53,54]. Although are various estimations of future electricity and utility by non-utility power [53,54]. there arethere various estimations of future electricity demand and demand and supply, the case study assumes that the total supply will decrease by approximately 10% supply, the case study assumes that the total supply will decrease by approximately 10% to 1000 TWh in to 1000 TWh in 2030 [52]. This case study configures three power generation scenarios based on the 2030grid [52]. case study configures powerand generation scenarios basedsource on theare grid mix scenarios mixThis scenarios for 2030 [52]: theirthree transitions breakdowns by electricity shown in Figure 3. for 2030 [52]: their transitions and breakdowns by electricity source are shown in Figure 3.
power generation amount [TWh]
1,200
Scenario 1
1,000
Wind Geothermal
PV
Large-scale hydro
Geothermal LNG
Large-scale hydro LNG
400
Oil
200 Nuclear
PV 6%
Wind
800 600
Nuclear 0%
Wind 12%
PV
Oil
Geothermal 4%
Large-scale Scenario 1 hydro in 2030 11%
Coal
Coal
Oil 6%
LNG 36%
Nuclear
0
Coal 25%
2012 2013 2014 2015 2016 2017 2018 2019 2020 2021 2022 2023 2024 2025 2026 2027 2028 2029 2030
power generation amount [TWh]
1,200
PV Wind Geothermal
Scenario 2
1,000
Large-scale hydro
800
Wind
LNG
600
PV
Geothermal Large-scale hydro
Oil
LNG
400
Coal
Wind 7%
PV 6%
Geothermal 4%
Nuclear 15%
Large-scale hydro Scenario 11%
2
Coal 24%
in 2030
Oil
200
Nuclear
0
Oil 4%
LNG 29%
Coal Nuclear 2012 2013 2014 2015 2016 2017 2018 2019 2020 2021 2022 2023 2024 2025 2026 2027 2028 2029 2030
power generation amount [TWh]
1,200
PV Wind Geothermal
Scenario 3
1,000
Large-scale hydro
800
Wind
LNG
600
PV
Geothermal Large-scale hydro
Oil
Geothermal 3%
Wind 3% PV 6%
Scenario 3 in 2030
LNG
400
Coal
Oil
200
Coal Nuclear
Nuclear
0
Nuclear 25%
Large-scale hydro 11%
LNG 26%
Oil 4%
Coal 22%
2012 2013 2014 2015 2016 2017 2018 2019 2020 2021 2022 2023 2024 2025 2026 2027 2028 2029 2030
Figure 3. Future grid mix scenario settings.
Figure 3. Future grid mix scenario settings. 3.3.1. Nuclear
3.3.1. Nuclear
Table 2 shows the assumptions made for nuclear power plants in each scenario [50]. Every assumes that the ten reactors in Fukushima Daiichiinand Daini that were Table 2scenario shows the assumptions made for nuclear power plants each scenario [50].damaged Every scenario as a result of the 2011 tsunami are in a safe storage stage until 2030 and will eventually be assumes that the ten reactors in Fukushima Daiichi and Daini that were damaged as a result of the 2011 decommissioned. In Scenario 1, there will be no resumption of operation, replacement of facilities tsunami areconstruction; in a safe storage until 2030are and will eventually be decommissioned. Scenario or new all thestage existing plants suspended until 2014, will enter a 15-yearIn safe storage1, there stage after 2015 and will then be decommissioned. Scenario 2 considers the recommencement of operations at existing power plants but not facility replacement or new construction. Scenario 3 assumes the recommencement of operations at existing power plants and also permits replacements and new construction with certain restrictions as shown in Table 2. The nuclear power plants that resume operations in Scenarios 2 and 3 will enter a safe storage stage at the end of their commercial life-span. The existing power plants that are currently under review—or are ready for safety reviews—are assumed to resume operations in 2015, 2018 or 2021, depending on the current safety review situation [55]. Although some nuclear power plants operated in 2012 and 2013, all are currently suspended and hence the amount of electricity generated from nuclear energy in 2014 is zero for each scenario. As the plants resume operations, the electricity generated from nuclear sources in 2020 will be 226 TWh in Scenario 2 and 237 TWh in Scenario 3. The 9 TWh difference between the two scenarios is attributable 15800
Sustainability 2015, 7, 15794–15811
to the assumed commencement of commercial operation at one nuclear power plant in Scenario 3. In Scenario 2, the capacity of existing nuclear power plants that reach their 40-years commercial life-span is approximately 16,000 MW in the period 2021–2030 and the power generated from nuclear sources gradually decreases. In Scenario 3, the nuclear electricity generated increases in the late 2020s because of facility replacement and new plant construction. Table 2. Settings for nuclear power plants. Scenario 1
Existing power plants
Resumed operation is aborted and all existing power plants are decommissioned after a safe storage period.
Scenario 2
Scenario 3
‚ Power plants resume operation by permission. ‚ Ten power plants in Fukushima Daiichi and Daini are decommissioned. ‚ 40 power plants are operated for 40 years (durable years) of commercial operations. ‚ The durable years of two power plants are extended by 8 and 10 years by permission.
‚ Construction of 12 power plants that were planned before the Great East Japan Earthquake are delayed by 10 years. New construction of power plants
All new construction and replacement are aborted.
All new construction and replacement are aborted.
‚ 9 power plants are constructed between 2021–2030.
‚ 42 power plants are replaced.
‚ New construction and replacement costs are increased by 20% due to safety measures against tsunami and earthquake.
Replacement of power plants
3.3.2. Three Renewables (Geothermal, Wind and PV) METI [52] assumes an overall target for power generation from renewable energy in 2030, however the breakdown per year is not provided. Some scenario analysis studies use diffusion curves to estimate the timeline trend by the future deployment of the technologies [56–58]. The case study uses a logistic function expressed by Equation (4) to evaluate the geothermal, wind and solar PV power generation amounts. ai Et,i “ (4) 1 ` bi e´ci pt´2000q where, t is the target year, i is the target renewable energy, Et,i is the amount of generation capacity in year t, ai , bi , ci are the coefficients (Table 3) and e is Napier’s constant. Coefficient ai shows the upper limit of the power generation capacity for each technology that can be estimated from MoE [42]. Considering the maximum capacity that is envisaged by the assumed significant equipment cost reduction through the FIT implementation and technological innovations [42] and the model plant’s power generation amounts shown in Table 1 that can be calculated by Equation (4), the estimates are 6.45 GW for geothermal, 415 GW for wind and 72 GW for solar PV. Coefficients bi and ci are estimated, using the time-series electricity generation amounts for the three renewables from 2000 to 2012 [53] and the expected amount of generation capacity in 2030.
15801
Sustainability 2015, 7, 15794–15811
Table 3. Estimated parameters and R2 for each scenario.
Geothermal
Wind
PV
Scenario 1 Scenario 2 Scenario 3 Scenario 1 Scenario 2 Scenario 3 Scenario 1 Scenario 2 Scenario 3
a
b
c
R2
6.5 6.5 6.5 414.8 414.8 414.8 72.2 72.2 72.2
546.5 257.9 168.0 1362.4 946.8 490.4 69681.3 69681.3 69681.3
0.3 0.2 0.2 0.2 0.2 0.1 0.4 0.4 0.4
0.80 0.84 0.87 0.87 0.88 0.90 0.68 0.68 0.68
Although the power generated from the three renewables in 2012 is only 8 TWh, this increases in line with the assumed logistic function to 43 TWh, 34 TWh and 26 TWh in 2020 and 220 TWh, 170 TWh and 120 TWh in 2030 for Scenarios 1, 2 and 3, respectively. Scenario 1 reflects the largest renewable electricity generation capacity of all the assumed scenarios: here solar PV electricity records the largest growth of 375 times from 0.16 TWh in 2012 to 60 TWh in 2030, whereas geothermal increases by 15 times (from 3 TWh in 2012 to 40 TWh in 2030) and wind increases by 24 times (from 5 TWh in 2012 to 120 TWh in 2030). 3.3.3. Large-Scale Hydro The Japanese candidate cites for new large-scale hydro schemes are located in remote and mountainous areas, and estimates show them to be economically inefficient [59]. Therefore, the case study does not include the replacement of large-scale hydro power plants and only assumes the impact associated with the O&M stage. The large-scale hydropower generation capacity is assumed to remain the same from 2012 to 2030. 3.3.4. Fossil Fuel (Coal, Oil and LNG) Each of the three scenarios assume a preferential electricity supply from nuclear and the three identified renewable sources; hence, the case study assumes that fossil fuel-powered (coal, oil and LNG) plants generate the additional electricity required to meet the demand. Wind and solar PV are particularly considered unstable as their outputs fluctuate with the weather condition; thus, it is necessary to introduce supply-demand balancing capabilities such as storage batteries and strengthen the grid infrastructures to ensure a stable power supply as the electricity supplied from unstable sources increases [60]. Therefore, the case study assumes the operation of fossil fuel-powered plants—particularly LNG plants—are to back up and stabilize the electricity grid. The total amount of electricity generated from fossil fuel-powered plant in 2012 is 987 TWh: this decreases by 7%, 17% and 16% in 2020 and 32%, 42% and 47% in 2030 for Scenarios 1, 2 and 3, respectively. 3.4. Replacement of Power Plants The case study considers the entire power generation capacity of all power plants operated in 2012 by general electrical utilities, wholesales electric utilities, and wholesale supplier utilities [61]. If a power plant except for nuclear reaches the end of its durable lifecycle, the case study assumes that it will be replaced in a timely fashion by a new plant so that the same uninterrupted power generation capacity is assured for the particular technology. In accordance with the 1979 “Principles for IEA action on coal” that precluded the new construction or replacement of base load oil-fired power plants [62], there are no current plans for new oil-fired plant construction. Further, most aging oil-fired plants in Japan are to be substituted by coal- and LNG-fired power plants [63,64]. Hence, this case study considers only the O&M and
15802
Sustainability 2015, 7, 15794–15811
Sustainability 2015, 7
12
decommissioning stages of oil-fired power plants and, if needed, that old oil-fired plants are replaced
The employment generated in the 18 year period shown in Figure 3b is 14 million person years withtotal LNG-fired capacities. for Scenario 1, and 12 million person years for Scenarios 2 and 3. The difference arises because there is 4. Results and Discussion a greater proportion of both fossil fuel and renewable plants in Scenario 1 than in the other scenarios. Figure and Table 4Impact indicate that the O&M employment decrease seen for nuclear and fossil fuel-powered 4.1. 3Employment plants isFigure balanced out in 2020 and 2030 by an increase in employment in the renewable M&C stage. 4a shows the transition of employment generated during 2012–2030 for Scenario 2 and However, theshows employment during the O&M stage takes in place continuously during the durable Figure 4b the totalgenerated employment generated for all scenarios the same period. Table 3 provides years of the specific power generation that from the M&C only1 and occurs for a a snapshot of employment generatedtechnology, in 2012, 2020whereas and 2030. The transitions for stages Scenarios 3 are shown in Figures A1 and A2 as reference, whose trends are almost the same as Figure 4. short period. 1.0
Decommissioning [Except for nuclear]
Scenario 2
Nuclear [Decommissioning]
Employment generation [million person years]
Nuclear [Decommissioning]
0.8
PV [M&C] Wind [M&C] Geothermal [M&C]
Decommissioning [Except for nuclear]
LNG [M&C]
Coal [M&C] Geothermal [M&C]
PV [M&C]
0.6
Coal [M&C] Nuclear [M&C]
LNG [M&C]
0.4
Wind [M&C] Nuclear [Safe storage]
Suspended nuclear [Maintenance] PV [O&M]
LNG [O&M] Oil [O&M]
Wind [O&M] Geothermal [O&M]
Wind [O&M] Geothermal [O&M] Hydro [O&M]
Coal [O&M]
LNG [O&M]
Nuclear in operation [O&M]
0.0
Suspended nuclear [Maintenance] PV [O&M]
Hydro [O&M]
0.2
Nuclear [Safe storage]
Oil [O&M] Coal [O&M] Nuclear in operation [O&M]
(a) 16
Decommissioning [Except for nuclear]
Decommissioning [Except for nuclear]
Employment generation [million person years]
14 12
PV [M&C, O&M] PV [M&C, O&M] Wind [M&C, O&M] Wind [M&C, O&M]
10
Geothermal[M&C, O&M] Large-scale hydro [O&M]
8
PV [M&C, O&M]
PV [M&C, O&M]
Wind [M&C, O&M] Geothermal[M&C, O&M] Large-scale hydro [O&M]
Wind [M&C, O&M] Geothermal[M&C, O&M] Large-scale hydro [O&M]
Geothermal[M&C, O&M]
LNG [M&C, O&M] LNG [M&C, O&M]
6
Large-scale hydro [O&M] LNG [M&C, O&M] LNG [M&C, O&M]
Oil [O&M]
4
Oil [O&M]
Oil [O&M]
2
Coal [M&C, O&M]
Coal [M&C, O&M]
Nuclear [M&C, O&M, suspended, safe storage]
Nuclear [M&C, O&M, suspended, safe storage]
Nuclear [M&C, O&M, suspended, safe storage]
Scenario 1
Scenario 2
Scenario 3
0
Oil [O&M]
Coal [M&C, O&M] Coal [M&C, O&M]
Nuclear [M&C, O&M, suspended, safe storage]
(b) Figure4. 4. Employment Employment generated by by electricity source in Japan, 2012–2030: (a) Employment generated Figure generated electricity source in Japan, 2012–2030: (a) Employment transitions of scenario 2; and (b) Total employment generated per scenario, 2012–2030. generated transitions of scenario 2; and (b) Total employment generated per scenario, 2012–2030.
Figure 4a and Table 4 show that the employment in 2020 will be +10%, ˘0% and ˘0% for each respective scenario compared with 0.58 million person years in 2012. Employment increases as the electricity supplied by the three renewables expands, and the final M&C stage demand increases after 2020, peaking in 2027 (+58%, +39% and +35% compared with 2012 for each respective scenario) due to the shape of logistic function. After 2027, its growth will gradually balance out because of a decrease 15803
Sustainability 2015, 7, 15794–15811
in electricity demand that leads to an employment reduction in the O&M stage and it will be +46%, +27% and +18% in 2030 compared with 2012 for each respective scenario. The total O&M stage employment reduces continuously because of a decrease in electricity demand. From 0.46 million person years in 2012, it will decrease by ´12%, ´19% and ´23% in 2030 for each respective scenario. Table 4 shows that the decrease in this stage is attributed to the employment impact of the three renewables being less than the impacts of nuclear and fossil fuel-powered plants. In terms of employment in the M&C stage, Table 4 demonstrates that an increase of the three renewables has a greater impact than those associated with nuclear, coal and LNG power plant replacements. The total employment generated in the 18 year period shown in Figure 3b is 14 million person years for Scenario 1, and 12 million person years for Scenarios 2 and 3. The difference arises because there is a greater proportion of both fossil fuel and renewable plants in Scenario 1 than in the other scenarios. Figure 3 and Table 4 indicate that the O&M employment decrease seen for nuclear and fossil fuel-powered plants is balanced out in 2020 and 2030 by an increase in employment in the renewable M&C stage. However, the employment generated during the O&M stage takes place continuously during the durable years of the specific power generation technology, whereas that from the M&C stages only occurs for a short period. Table 4. Employment impact by electricity source in Japan: 2012, 2020 and 2030.
2012 Total (million person years) Nuclear
Coal Oil LNG Large-scale hydro Geothermal Wind PV
Scenario 1
Scenario 2
Scenario 3
2020
2030
2020
2030
2020
2030
0.58
0.64
0.85
0.58
0.74
0.58
0.69
M&C
0%
0%
0%
0%
0%
2%
2%
O&M
1%
0%
0%
3%
4%
3%
7%
Suspended
9%
0%
0%
4%
0%
4%
0%
Safe storage
2%
11%
8%
5%
5%
5%
6%
Decommissioning
0%
0%
0%
0%
0%
0%
0%
M&C
1%
2%
2%
2%
2%
2%
2%
O&M
19%
16%
11%
17%
12%
17%
12%
M&C
-
-
-
-
-
-
-
O&M
20%
13%
4%
13%
3%
13%
3%
M&C
7%
3%
0%
3%
0%
3%
0%
O&M
35%
33%
18%
31%
17%
32%
16%
M&C
-
-
-
-
-
-
-
O&M
3%
3%
3%
3%
3%
3%
3%
M&C
0%
3%
1%
3%
2%
2%
2%
O&M
0%
2%
3%
1%
3%
1%
3%
M&C
0%
4%
15%
3%
10%
1%
3%
O&M
0%
1%
4%
1%
3%
1%
1%
M&C
1%
8%
25%
9%
29%
9%
31%
O&M
0%
0%
5%
0%
5%
0%
6%
Decommissioning (Except for nuclear)
0%
1%
1%
1%
1%
1%
1%
100%
100%
100%
100%
100%
100%
100%
4.2. Impacts on GHG Emissions Figure 5a shows the transition of GHG emissions during 2012–2030 for Scenario 2 (the same estimates for Scenarios 1 and 2 are shown in Figures A3 and A4) and Figure 5b shows a snapshot of GHG emissions in 2012, 2020 and 2030 for each scenario. Reductions are observed for all the scenarios;
15804
Sustainability 2015, 7, 15794–15811
the 624 million t-CO2 eq. emissions in 2012 will be reduced by 8%, 16% and 16% in 2020 and 29%, 38% and 44% in 2030 for each respective scenario. This indicates that GHG emissions are expected to reduce because of an increase in electricity supplied by the three renewables and a decrease in electricity demand, regardless of nuclear power operations. The 6% GHG reduction effect difference between Scenarios 2 and 3 is attributed to the proportion of electricity from nuclear and the three Sustainability 2015, 7 14 renewables as they have small GHG emission intensities. 800
Decommissioning [Except for nuclear]
Scenario 2
700
Nuclear [Decommissioning] PV [M&C] Wind [M&C]
GHG emissions [million t-CO2 eq.]
600
Geothermal [M&C] LNG [M&C]
500
Coal [M&C] Nuclear [M&C]
400
Nuclear [Safe storage]
LNG [O&M]
Suspended nuclear [Maintenance]
300
PV [O&M]
Oil [O&M]
Wind [O&M]
200
Geothermal [O&M] Hydro [O&M]
Coal [O&M]
100
LNG [O&M] Oil [O&M]
0
Coal [O&M] Nuclear in operation [O&M]
(a) 700
Decommissioning [Except for nuclear]
GHG emissions [million t-CO2 eq.]
600 500
PV [M&C, O&M] LNG [M&C, O&M]
Wind [M&C, O&M] LNG [M&C, O&M]
400 300
LNG [M&C, O&M]
LNG [M&C, O&M]
Geothermal[M&C, O&M] LNG [M&C, O&M]
Oil [O&M] Oil [O&M]
Oil [O&M]
Oil [O&M] Oil [O&M]
200 100
Coal [M&C, O&M]
Coal [M&C, O&M]
Coal [M&C, O&M]
Coal [M&C, O&M]
Coal [M&C, O&M]
LNG [M&C, O&M] Oil [O&M]
Coal [M&C, O&M]
LNG [M&C, O&M] Oil [O&M]
Coal [M&C, O&M]
Large-scale hydro [O&M]
LNG [M&C, O&M]
Oil [O&M]
Coal [M&C, O&M]
0 2012
Scenario 1 Scenario 2 Scenario 3 Scenario 1 Scenario 2 Scenario 3 2020
2030
Nuclear [M&C, O&M, suspended, safe storage]
(b) Figure 5. 5. GHG by electricity sourcesource in Japan, (a) GHG emissions transitions of Figure GHGemissions emissions by electricity in2012–2030: Japan, 2012–2030: (a) GHG emissions Scenario 2 and (b) Japanese GHG emissions in 2012, 2020 and 2030. transitions of Scenario 2 and (b) Japanese GHG emissions in 2012, 2020 and 2030.
5. Conclusions
5. Conclusions
The study established an IO table scenario analysis framework to evaluate the environmental and socio-economic impacts the future power generation technologies in Japan.the Using IO tables forand The study established an IOof table scenario analysis framework to evaluate environmental future analyses cannot reflect the possible changes in inter-sector transactions or that arise because of socio-economic impacts of the future power generation technologies in Japan. Using IO tables for future technological progress; however, the framework established is useful to estimate the future potential analyses cannot reflect the possible changes in inter-sector transactions or that arise because of expected from a macroscopic view arising from the current industrial structure and technology technological progress; however, established useful toanalysis estimateinthe potential level. A hybrid bottom-up andthe IOframework approach for life cycleisinventory thefuture established expected from enables a macroscopic viewofarising from the current industrial structure and technology level. framework a reflection the technological difference per power generation technology in the estimates. alsolife effective evaluating the potential environmental and A hybrid bottom-up The and framework IO approachis for cycle in inventory analysis in the established framework enables a reflection of the technological difference per power generation technology in the estimates. The framework is also effective in evaluating the15805 potential environmental and socio-economic impacts in terms of employment generation and GHG emissions at the same time using the IO approach. Using the framework, a case study is undertaken to investigate the potential impacts of future grid
Sustainability 2015, 7, 15794–15811
socio-economic impacts in terms of employment generation and GHG emissions at the same time using the IO approach. Using the framework, a case study is undertaken to investigate the potential impacts of future grid mix scenarios in Japan. The results suggest that the reduction in employment generation in the O&M stage that is associated with both an electricity demand decrease and the suspension of nuclear power plant operations might be balanced with the expansion of employment through an increase in the electricity generated from three renewables (geothermal, wind and solar PV) in their M&C stage. However, there is a difference in O&M and M&C stage employment: the former occurs continuously while the power generation plants are in operation, whereas the latter is for relatively short periods while the plants are built. This indicates that the growth of employment arising from the expansion of electricity generated from the three renewables in the late 2020s is a temporary impact. It might contribute to assuring the employment of the future Japanese society towards 2030. The magnitude of the FIT scheme towards the environmental and socio-economic impacts will be of a great interest; however, it is not considered in this study. This effect can be evaluated using our framework by formulating different scenario if the relationship between future deployment target of the renewables and the tariff becomes available. This paper introduced the framework established and conducted a case study as an application of the framework. However, the following issues should be addressed to improve the framework and to produce case study results that reflect detailed and precise technological aspects relating to the power generation technologies. ‚ The authors are currently establishing an extended IO table where the different IO structures per power generation technology are reflected by disaggregating the original IO sectors or by creating new IO sectors related to renewable energies based on detailed technological data. Although the hybrid bottom-up and IO approach for life cycle inventory analysis used in the framework established here reflects the power generation technology differences, the authors’ plan to use the extended IO table in the framework so that a wide range of potential impacts can be estimated using input coefficient matrices that are adjustable to different power generation mixes. ‚ The various assumptions made in the case study are based on current data, and the case study results strongly depend on these assumptions. In particular, data relating to the maintenance stage of suspended nuclear power plants and the safe storage and decommissioning stages of nuclear power plants may influence the results. A further important activity related to nuclear power not included in the case study is the back-end stages of its fuel cycle. ‚ Power generation by PV and wind power generation is fluctuated by the weather so that increasing supply-demand balancing capacities shall become important to assure stable power supply when such unstable power sources are connected to the grid in full-scale. Since it requires additional capital investments to production, transmission and distribution of electricity, it is necessary to include the parameters and scenarios to evaluate the environmental and socio-economic impacts associated with this capacity enhancement in our framework developed. ‚ Quantitative environmental and socio-economic impact information may help decision makers choose future energy systems; hence, as detailed and precise data becomes available, there is a clear need to conduct a new case study using the framework and to produce updated results. It is also important to conduct a sensitivity analysis to identify hotspots and to understand the uncertainties related to the potential environment and socio-economic impacts. Author Contributions: Shunichi Hienuki conducted the research and wrote the paper under the supervision of Hiroki Hondo and Yuki Kudoh. All authors checked and approved the final draft. Conflicts of Interest: The authors declare no conflict of interest.
15806
Shunichi Hienuki Hienuki conducted conducted the the research research and and wrote wrote the the paper paper under under the the supervision supervision of of Hiroki Hiroki Hondo Hondo and and Shunichi Yuki Kudoh. All authors checked and approved the final draft. Yuki Kudoh. All authors checked and approved the final draft. Conflicts2015, of Interest Interest Sustainability 7, 15794–15811 Conflicts of The authors authors declare declare no no conflict conflict of of interest. interest. The Appendix Appendix Appendix
Employment Employmentgeneration generation [million [millionperson personyears] years]
1.0 1.0 0.8 0.8
Scenario 11 Scenario
Nuclear [Decommissioning] Nuclear [Decommissioning]
Geothermal [M&C] Geothermal [M&C]
Decommissioning [Except for nuclear] Decommissioning [Except for nuclear]
PV [M&C] PV [M&C]
Coal [M&C] Coal [M&C]
0.6 0.6
Wind [M&C] Wind [M&C]
LNG [M&C] LNG [M&C] Nuclear [Safe storage] Nuclear [Safe storage]
0.4 0.4
Suspended nuclear [Maintenance] Suspended nuclear [Maintenance]
Hydro [O&M] Hydro [O&M]
PV [O&M] PV [O&M]
LNG [O&M] LNG [O&M]
0.2 0.2
Wind [O&M] Wind [O&M] Geothermal [O&M] Geothermal [O&M]
Oil [O&M] Oil [O&M] Nuclear in operation [O&M] Nuclear in operation [O&M]
Coal [O&M] Coal [O&M]
0.0 0.0
Decommissioning [Except for nuclear] Decommissioning [Except for nuclear] Nuclear [Decommissioning] Nuclear [Decommissioning] PV [M&C] PV [M&C] Wind [M&C] Wind [M&C] Geothermal [M&C] Geothermal [M&C] LNG [M&C] LNG [M&C] Coal [M&C] Coal [M&C] Nuclear [M&C] Nuclear [M&C] Nuclear [Safe storage] Nuclear [Safe storage] Suspended nuclear [Maintenance] Suspended nuclear [Maintenance] PV [O&M] PV [O&M] Wind [O&M] Wind [O&M] Geothermal [O&M] Geothermal [O&M] Hydro [O&M] Hydro [O&M] LNG [O&M] LNG [O&M] Oil [O&M] Oil [O&M] Coal [O&M] Coal [O&M] Nuclear in operation [O&M] Nuclear in operation [O&M]
FigureA1. A1. Employment Employment generated generated transitions Figure A1. Employment generated transitions transitions of ofScenario Scenario1.1. 1. Figure of Scenario
Employment Employmentgeneration generation [million [millionperson personyears] years]
1.0 1.0
Scenario 33 Scenario Nuclear [Decommissioning] Nuclear [Decommissioning]
0.8 0.8 0.6 0.6
Wind [M&C] Wind [M&C] Coal [M&C] Coal [M&C] Decommissioning [Except for nuclear] Decommissioning [Except for nuclear]
Geothermal [M&C] Geothermal [M&C]
PV [M&C] PV [M&C]
LNG [M&C] LNG [M&C]
0.4 0.4
Suspended nuclear [Maintenance] Suspended nuclear [Maintenance]
0.2 0.2
Nuclear [Safe storage] Nuclear [Safe storage] Hydro [O&M] Hydro [O&M]
LNG [O&M] LNG [O&M] Oil [O&M] Oil [O&M]
PV [O&M] PV [O&M]
Wind [O&M] Wind [O&M] Geothermal [O&M] Geothermal [O&M]
Coal [O&M] Coal [O&M] Nuclear in operation [O&M] Nuclear in operation [O&M]
0.0 0.0
Decommissioning [Except for nuclear] Decommissioning [Except for nuclear] Nuclear [Decommissioning] Nuclear [Decommissioning] PV [M&C] PV [M&C] Wind [M&C] Wind [M&C] Geothermal [M&C] Geothermal [M&C] LNG [M&C] LNG [M&C] Coal [M&C] Coal [M&C] Nuclear [M&C] Nuclear [M&C] Nuclear [Safe storage] Nuclear [Safe storage] Suspended nuclear [Maintenance] Suspended nuclear [Maintenance] PV [O&M] PV [O&M] Wind [O&M] Wind [O&M] Geothermal [O&M] Geothermal [O&M] Hydro [O&M] Hydro [O&M] LNG [O&M] LNG [O&M] Oil [O&M] Oil [O&M] Coal [O&M] Coal [O&M] Nuclear in operation [O&M] Nuclear in operation [O&M]
Figure A2. Employment generated transitions transitions of ofScenario Scenario3.3. 3. FigureA2. A2. Employment Employment generated generated Sustainability 2015, 7Figure Scenario 800 700
17 Decommissioning [Except for nuclear]
Scenario 1
Nuclear [Decommissioning] PV [M&C] Wind [M&C]
GHG emissions [million t-CO2 eq.]
600
Geothermal [M&C] LNG [M&C]
500
Coal [M&C] LNG [O&M]
400
Nuclear [M&C] Nuclear [Safe storage] Suspended nuclear [Maintenance]
300
Oil [O&M]
PV [O&M] Wind [O&M]
200
Geothermal [O&M] Coal [O&M]
100
Hydro [O&M] LNG [O&M] Oil [O&M]
0
Coal [O&M] Nuclear in operation [O&M]
FigureA3. A3. GHG GHG emissions emissions transitions of Figure of Scenario Scenario1.1. 800 700
sions 2 eq.]
600
Decommissioning [Except for nuclear]
Scenario 3
Nuclear [Decommissioning]
15807
PV [M&C] Wind [M&C] Geothermal [M&C] LNG [M&C]
500
Coal [M&C]
Geothermal [O&M] Coal [O&M]
100
Hydro [O&M] LNG [O&M] Oil [O&M]
0
Coal [O&M] Nuclear in operation [O&M]
Sustainability 2015, 7, 15794–15811
Figure A3. GHG emissions transitions of Scenario 1. 800 700
Decommissioning [Except for nuclear]
Scenario 3
Nuclear [Decommissioning] PV [M&C] Wind [M&C]
GHG emissions [million t-CO2 eq.]
600
Geothermal [M&C] LNG [M&C]
500 400
Coal [M&C] Nuclear [M&C] LNG [O&M]
Suspended nuclear [Maintenance]
300 Oil [O&M]
PV [O&M] Wind [O&M]
200 100
Nuclear [Safe storage]
Geothermal [O&M] Coal [O&M]
Hydro [O&M] LNG [O&M] Oil [O&M]
0
Coal [O&M] Nuclear in operation [O&M]
FigureA4. A4. GHG GHG emissions emissions transitions Figure transitions of ofScenario Scenario3.3.
References References 1. 1. Ministry of of Economy, Trade andand Industry (METI). BasicBasic Energy Plan; METI: Ministry Economy, Trade Industry (METI). Energy Plan; Tokyo, METI: Japan, Tokyo,2010. Japan, 2010. 2. Ministry of Economy, Trade and Industry (METI). Basic Energy Plan; METI: Tokyo, Japan, 2014. 2. Ministry of Economy, Trade and Industry (METI). Basic Energy Plan; METI: Tokyo, Japan, 2014. 3. Ministry of Economy, Trade and Industry (METI). Act on Special Measures Concerning the Procurement of 3. Ministry of Economy, Trade and Industry (METI). Act on Special Measures Concerning the Renewable Electric Energy by Operators of Electric Utilities; METI: Tokyo, Japan, 2012. Available online: Procurement of Renewable Electric Energy by Operators of Electric Utilities; METI: Tokyo, Japan,on http://www.enecho.meti.go.jp/category/saving_and_new/saiene/kaitori/2011kaitori.pdf (accessed Available online: http://www.enecho.meti.go.jp/category/saving_and_new/saiene/kaitori/ 282012. May 2015). 2011kaitori.pdf on 28 May 2015). 4. Japan Renewable(accessed Energy Foundation (JREF). Current Status and Cost of Solar Power Generation JREF: Tokyo, 2014;(JREF). Available online: 4. Business; Japan Renewable EnergyJapan, Foundation Current Status http://jref.or.jp/images/pdf/20130628/ and Cost of Solar Power Generation FIT_press%20release_FIT1year_REV.pdf (accessed on 28 May 2015). Business; JREF: Tokyo, Japan, 2014. Available online: http://jref.or.jp/images/pdf/20130628/ 5. Kimura, K.; Mano, S. Current Status and (accessed Cost of Solar Power Business; Japan renewable FIT_press%20release_FIT1year_REV.pdf on 28 May Generation 2015). energy foundation (JREF): Tokyo, Japan, 2013; Available online: http://jref.or.jp/images/pdf/20131220/ reports_20131220.pdf (accessed on 28 May 2015). 6. Japan Renewable Energy Foundation (JREF). Feed-in Tariff, Proposals for Suggestion System Design for System Design and Evaluation of First Year; JREF: Tokyo, Japan, 2013; Available online: http://jref.or.jp/images/pdf/20140110/JREF_FITProposal_10JAN2014.pdf (accessed on 28 May 2015). 7. Japan Renewable Energy Foundation (JREF). Proposals for Renewable Energy Policy/feed-in Tariff ; JREF: Tokyo, Japan, 2014; Available online: http://www.isep.or.jp/wp/wp-content/ uploads/2014/01/ISEPpress-FIT201401221.pdf (accessed on 28 May 2015). 8. United Nations (UN). Kyoto Protocol to the United Nations Framework Convention on Climate Change; UN: New York, NY, USA, 1998; Available online: http://unfccc.int/resource/docs/convkp/kpeng.pdf (accessed on 1 June 2015). 9. Nakata, T. Analysis of the impacts of nuclear phase-out on energy system in Japan. Energy 2002, 27, 363–377. [CrossRef] 10. Takase, K.; Suzuki, T. The Japanese energy sector: Current situation, and future paths. Energy Policy 2011, 39, 6731–6744. [CrossRef] 11. Zhang, Q.; Ishihara, K.N.; Mclellan, B.C.; Tezuka, T. Scenario analysis on future electricity supply and demand in Japan. Energy 2012, 38, 376–385. [CrossRef] 12. Pereira, J.P.; Parady, G.T.; Dominguez, B.C. Japan’s energy conundrum: Post-Fukushima scenarios from a life cycle perspective. Energy Policy 2014, 67, 104–115. [CrossRef] 13. Organization for Economic Co-operation and Development (OECD). How’s Life: Executive Summary; OECD: Paris, France, 2013; Available online: http://www.oecdbetterlifeindex.org/(accessed on 15 March 2015).
15808
Sustainability 2015, 7, 15794–15811
14.
15. 16. 17.
18. 19. 20. 21. 22. 23. 24. 25. 26. 27.
28. 29.
30.
31. 32. 33. 34. 35. 36. 37.
Ministry of Health, Labour and Welfare (MHLW). Economic and Social System to Realize a Sustainable Society with Vitality; MHLW: Tokyo, Japan, 2010. Available online: http://www.mhlw.go.jp/ stf/houdou/2r9852000000cguk-img/2r9852000000ch2y.pdf (accessed on 24 August 2015). Caldés, N.; Varela, M.; Santamaría, M.; Sáez, R. Economic impact of solar thermal electricity deployment in Spain. Energy Policy 2009, 37, 1628–1636. [CrossRef] Tourkolias, C.; Mirasgedis, S. Quantification and monetization of employment benefits associated with renewable energy technologies in Greece. Renew. Sustain. Energy Rev. 2011, 15, 2876–2886. [CrossRef] Markaki, M.; Belegri-Roboli, A.; Michaelides, P.; Mirasgedis, S.; Lalas, D.P. The impact of clean energy investments on the Greek economy: An input–output analysis (2010–2020). Energy Policy 2013, 57, 263–275. [CrossRef] Arce, R.; Mahia, R.; Medina, E.; Escribano, G. A simulation of the economic impact of renewable energy development in Morocco. Energy Policy 2012, 46, 335–345. [CrossRef] Ciorba, U.; Pauli, F.; Menna, P. Technical and economical analysis of an induced demand in the photovoltaic sector. Energy Policy 2004, 32, 949–960. [CrossRef] Lehr, U.; Nitsch, J.; Kratzat, M.; Lutz, C.; Edler, D. Renewable energy and employment in Germany. Energy Policy 2008, 36, 108–117. [CrossRef] Matumoto, N.; Hondo, H. Analysis on employment effects of the introduction of renewable energy technologies using an extended input-output table. J. Jpn. Inst. Energy 2011, 90, 258–267. [CrossRef] Hienuki, S.; Kudoh, Y.; Hondo, H. Life cycle employment effect of geothermal power generation using an extended input-output model: The Case of Japan. J. Clean. Prod. 2015, 93, 203–212. [CrossRef] Silalertruksa, T.; Gheewala, S.H.; Hunecke, K.; Fritsche, U.R. Biofuels and employment effects: Implications for socio-economic development in Thailand. Biomass Bioenerg. 2012, 46, 409–418. [CrossRef] Tsurugai, M.; Heiho, A.; Kudoh, Y.; Hondo, H. Environmental effects associated with the use of waste biomass: A Case Study of the Miura Biomass Center. J. Jpn. Inst. Energy 2013, 92, 258–267. [CrossRef] Hondo, H.; Kikuchi, K. Effect of local biomass project on energy balance and GHG emission: A life cycle approach. Int. J. Green Energy 2015, 12, 160–167. [CrossRef] Ministry of International Affairs and Communications (MIC). 2005 Input-Output Tables for Japan; MIC: Tokyo, Japan, 2011. Nansai, K.; Moriguchi, Y. Embodied Energy and Emission Intensity Data for Japan Using Input–Output Tables (3EID): For 2005 IO Table; Center for Global Environmental Research (CGER), National Institute for Environmental Studies: Tsukuba, Japan, 2012. Available online: http://www.cger.nies.go.jp/ publications/report/d031/index.html (accessed on 6 May 2014). Cabinet Secretariat (CAS). Cost, etc. Verification Committee Report; CAS: Tokyo, Japan, 2011. Available online: http://www.cas.go.jp/jp/seisaku/npu/policy09/pdf/20111221/hokoku.pdf (accessed on 6 May 2014). Cabinet Secretariat (CAS). Estimates Sheet of Power Generation Cost; CAS: Tokyo, Japan, 2014. Available online: http://www.cas.go.jp/jp/seisaku/npu/policy09/archive02_shisan_sheet.html (accessed on 10 January 2015). Hondo, H.; Uchiyama, Y.; Moriizumi, Y. Evaluation of Power Generation Technologies based on Life Cycle CO2 Emissions—Re-Estimation Using the Latest Data and Effects of the Difference of Conditions; Socio-economic Research Centre Report No. Y99009; Central Research Institute of Electric Power Industry: Tokyo, Japan, 2000. International Energy Agency (IEA). Project Cost of Generating Electricity 2010 Edition; IEA: Paris, France, 2010. Hokkaido Electric Power Co., Inc. Securities Report FY 2005; Hokkaido Electric Power Co., Inc.: Hokkaido, Japan, 2006. Tohoku Electric Power Co., Inc. Securities Report FY 2005; Tohoku Electric Power Co., Inc.: Sendai, Japan, 2006. Tokyo Electric Power Co., Inc. Securities Report FY 2005; Tokyo Electric Power Co., Inc.: Tokyo, Japan, 2006. Hokuriku Electric Power Co., Inc. Securities Report FY 2005; Hokuriku Electric Power Co., Inc.: Toyama, Japan, 2006. Chubu Electric Power Co., Inc. Securities Report FY 2005; Chubu Electric Power Co., Inc.: Nagoya, Japan, 2006. Kansai Electric Power Co., Inc. Securities Report FY 2005; Kansai Electric Power Co., Inc.: Osaka, Japan, 2006.
15809
Sustainability 2015, 7, 15794–15811
38. 39. 40. 41. 42. 43.
44. 45.
46. 47.
48. 49.
50.
51.
52.
53. 54.
55.
56. 57. 58.
Chugoku Electric Power Co., Inc. Securities Report FY 2005; Chugoku Electric Power Co., Inc.: Hiroshima, Japan, 2006. Shikoku Electric Power Co., Inc. Securities Report FY 2005; Shikoku Electric Power Co., Inc.: Takamatsu, Japan, 2006. Kyushu Electric Power Co., Inc. Securities Report FY 2005; Kyushu Electric Power Co., Inc.: Fukuoka, Japan, 2006. Okinawa Electric Power Co., Inc. Securities Report FY 2005; Okinawa Electric Power Co., Inc.: Naha, Japan, 2006. Ministry of the Environment (MoE). Study of Potential for the Introduction of Renewable Energy (FY2010); MoE: Tokyo, Japan, 2011. Yoshioka, K.; Uchiyama, Y.; Hondo, H.; Suga, M. An application of the input-output approach in environmental analysis: Estimating the CO2 emission of fossil-fired and nuclear power generation. Application of Input-output tables for environmental analysis (5). Input-Output Anal. Innov. Tech. 1994, 5, 5–15. [CrossRef] Ministry of the Environment (MoE). Greenhouse Gas Emissions Calculation and Reporting Manual ver.3.4; MoE: Tokyo, Japan, 2013. Cabinet Office, Government of Japan (CAO). Deflators (Calendar Year: Changes from the Previous Year); CAO: Tokyo, Japan, 2012. Available online: http://www.esri.cao.go.jp/en/sna/data/sokuhou/files/2012/ qe122/gdemenuea.html (accessed on 6 May 2014). World Bank. Official Exchange Rate (LCU per US$, Period Average). Available online: http://data.worldbank.org/indicator/PA.NUS.FCRF?page=1 (accessed on 29 September 2015). Chubu Electric Power Co. Inc. Construction Cost of Tsunami Countermeasures in Hamaoka Nuclear Power Station; Chubu Electric Power Co. Inc.: Nagoya, Japan, 2012; Available online: http://www.chuden.co.jp/corporate/publicity/pub_release/press/3180836_6926.html (accessed on 4 December 2014). Federation of Electric Power Companies of Japan (FEPC). Data of Power Generation; FEPC: Tokyo, Japan, 2014; Available online: http://www.fepc.or.jp/library/data/index.html (accessed on 4 December 2014). Chubu Electric Power Co. Inc. Schedule of Decommissioning Plan of Hamaoka Units 1 and 2. Available online: http://www.chuden.co.jp/resource/energy/haishi_haishi-schedule_2.pdf (accessed on 4 December 2014). Takahashi, M.; Nagata, Y. Any Stagnation of Nuclear Power is the Extent to Affect the Electricity Prices?; Socio-economic Research Centre Discussion Paper 11022; Central Research Institute of Electric Power Industry: Tokyo, Japan, 2011. Japan Photovoltaic Energy Association (JPEA). Changes in Solar Cell Shipments in Japan; JPEA: Tokyo, Japan, 2014; Available online: http://www.jpea.gr.jp/pdf/statistics/cellmodule_year.pdf(accessed on 8 July 2015). Ministry of Economy, Trade and Industry (METI). Fundamental Documents for Energy Mix Alternatives; METI: Tokyo, Japan, 2012. Available online: http://www.enecho.meti.go.jp/ committee/council/basic_problem_committee/pdf/sentakushi.pdf (accessed on 29 August 2014). Federation of Electric Power Companies of Japan (FEPC). Hand Book of Electric Power Industry FY2013; FEPC: Tokyo, Japan, 2013. Federation of Electric Power Companies of Japan (FEPC). Graphical Flip-Chart of Nuclear & Energy Related Topics FY2013; FEPC: Tokyo, Japan, 2013; Available online: http://www.fepc.or.jp/library/pamphlet/zumenshu/pdf/all.pdf (accessed on 29 September 2015). Nikkei Inc. Nuclear Power Plant Re-operation, 10 group Five Nuclear Power Plants Apply at the New Regulatory Standards Enforcement. Available online: http://www.nikkei.com/article/ DGXNASGG08003_Y3A700C1MM0000/ (accessed on 29 August 2014). (In Japanese). Mabel, M.C.; Fernandez, E. Growth and future trends of wind energy in India. Renew. Sustain. Energy Rev. 2008, 12, 1745–1757. [CrossRef] Pillai, I.R.; Banerjee, R. Renewable energy in India: Status and potential. Energy 2009, 34, 970–980. [CrossRef] Rao, K.U.; Kishore, V.V.N. A review of technology diffusion models with special reference to renewable energy technologies. Renew. Sustain. Energy Rev. 2010, 14, 1070–1078. [CrossRef]
15810
Sustainability 2015, 7, 15794–15811
59.
60.
61. 62.
63. 64.
New Energy Foundation (NEF). Report on the Role of Hydroelectric Power towards a Low-Carbon Society; NEF: Tokyo, Japan, 2010; Available online: http://www.nef.or.jp/introduction/teigen/pdf/ te_h21_06.pdf(accessed on 9 July 2015). Ministry of Economy, Trade and Industry (METI). Additional Costs Associated with the Expanded Introduction of Renewable Energy; METI: Tokyo, Japan, 2012. Available online: http://www.enecho.meti.go.jp/committee/ council/basic_problem_committee/theme2/pdf/01/19-1-2.pdf (accessed on 29 September 2015). Ministry of Economy, Trade and Industry (METI). Overview of Power Development FY 2010; METI: Tokyo, Japan, 2010. Ministry of Economy, Trade and Industry (METI). About Thermal Power Generation; METI: Tokyo, Japan, 2012. Available online: http://www.enecho.meti.go.jp/committee/council/basic_problem_ committee/013/pdf/13-7.pdf (accessed on 29 December 2014). Japan Electric Association (JEA). Handbook of Electric Power Industry 2009 Edition; JEA: Tokyo, Japan, 2009. Ministry of Economy, Trade and Industry (METI). Business Activities of the Industrial Safety and Regulation; METI: Tokyo, Japan, 2014. Available online: http://www.meti.go.jp/policy/safety_security/ industrial_safety/sangyo/electric/detail/thermal.html (accessed on 29 December 2014). (In Japanese). © 2015 by the authors; licensee MDPI, Basel, Switzerland. This article is an open access article distributed under the terms and conditions of the Creative Commons by Attribution (CC-BY) license (http://creativecommons.org/licenses/by/4.0/).
15811