Estimating “Teaching Effectiveness” using Classification 1
Seifeddine Besbes, 2Riadh Besbes, 3Twala Bekhisipho 1
Department of Computer Engineering University of Sousse, Tunisia 2 Ministry of Education, Tunisia 3 Department of Electrical & Electronic Engineering Science University of Johannesburg, South Africa 1
[email protected] 2
[email protected] 3
[email protected]
Abstract— In this paper we present the application of three classification methods on an educational database. Measures are collected in educational context, especially from classroom visits. Those data mining techniques process quantified acts and behaviours to estimate a global characteristic of teaching effectiveness, the teacher’s “ability to change the course of events”. A database collected by the second author (inspectorresearcher) among his professional classrooms visits to more than 200 teachers is exploited. An interactive grid gathering 63 educational acts and behaviours was conceived as an observation instrument for those visits. Within WEKA environment, and with progressive enhancement of our database, the three classification methods provide rates of correct classified instances that exceed 94%. Keywords— Teaching effectiveness, AIRS1, Random tree, Lazy Kstar, Data mining.
I. INTRODUCTION Darling-Hammond and al [1] recognised that there was a growing interest in moving beyond traditional measures of teacher qualifications and a need to develop a classroom observation instrument that would measure some agreed teacher effectiveness constructs. Milanowsky and al [2], mentioned that “great progress has been made over the last two decades in developing standards-based evaluations of teaching practice, and research has found that the use of such evaluations has not only provided more useful evidence about teaching practice, but has also been associated with student achievement gains and has helped teachers improve their practice and effectiveness”. These new investments in research and development initiative to design multiple ways of measuring teaching effectiveness can be leveraged to make major shifts in how evidence is assembled on prospective teachers and to forge the development of an accessible teaching performance assessment. We address key issues and findings about the use of three educational data mining classification algorithms in educational context. These methods of extracting knowledge on effective teaching practices are used to estimate one global characteristic: teachers’ ability to change the course of events. We believe that assessment is essential to predict improve and maintain an acceptable level of teacher effectiveness. It ensures accountability and creates ways to improvements and future investments. However, this is happen when the system generates authentic, participatory and grounded information. This information, captured then interpreted, will reflect with
an acceptable level of the reality. In a cognitive ergonomics way we processed as described by Braverman [3], to ensure work conditions improvement, evaluators should not focus on legitimate stakeholders policies. They have to be enough responsible in feed the system by meaningful and rational data that reflect realities on educational fields. It will not be easy, since teaching is a high cognitively complex behaviour. Teachers are actors who should have in hand a set of alternative forms of representation, which can derive from research or have their origin in the wisdom of practice. II. RELATED WORK A. Systematic observation Based on the findings cited by Sammons and Ko [4], it is assumed that teaching is a multi-dimensional process and its multidimensionality can be explored and confirmed by using observation schedules and factor analysis. Medley [5] defines the term “systematic observation” as “observations of classroom behaviour made by a trained observer who records the behaviours according to an observation system. An “observation system,” in turn, is a scheme that specifies both the events that the observer is to record and the procedure to be used in recording them ... a quantitative method of measuring classroom behaviours from direct observations that specifies both the events or behaviours that are to be observed and how they are to be recorded”. Starting from medical view, diagnosis is an activity that aims at identifying causes of dysfunction of a human or physical system. It is based on the observation of its present symptoms. Frequently, the dysfunctions are diagnosed from a set of symptoms called characteristic syndrome. The relevance of the diagnosis is highly dependent on the complete observation of the operative. As Shapiro and Heick [14] mentioned it, naturalistic direct observations are regarded as highly objective ways to evaluate children’s behaviour in schools and are one of the most common assessment procedures used by school-based professionals. This is also true for the analysis of teachers’ practices in classrooms by proceeding to open observations within work situations. The use of observational methodologies for better understanding the social ecology of the school classroom is another important understudied area of research. B. Classifications’ methods
Data mining, or knowledge discovery, attempts to obtain valuable knowledge from data stored in large repositories. Data mining has been considered as an appropriate method of knowledge discovery to excavate the implicit information. Thus, this study presents a data mining approach that integrates three computational intelligence schemes. Artificial immune recognition systems (AIRS) are defines by previous research as a class of computationally intelligent systems inspired by the principles and processes of the vertebrate immune system. The algorithms typically exploit the immune system's characteristics of learning and memory to solve a problem [6]. Random Tree is also identified as a class for constructing a tree that considers K randomly chosen attributes at each node, and performs no pruning. Also, has an option to allow estimation of class probabilities based on a hold-out set (back fitting) [13]. Lazy K Star “K*” is an instance-based classifier, that is the class of a test instance is based upon the class of those training instances similar to it, as determined by some similarity function. It differs from other instance-based learners in that it uses an entropy-based distance function. The K* algorithm can be defined as a method of cluster analysis which mainly aims at the partition of “n” observations into “k” clusters in which each observation belongs to the cluster with the nearest mean. We can describe K* algorithm as an instance based learner which uses entropy as a distance measure. The benefits are that it provides a consistent approach to handling of real valued attributes, symbolic attributes and missing values [8]. The three algorithms are used within a global environment: WEKA [15] (Waikato Environment for Knowledge Analysis). In our study, we used WEKA to apply each one of the above described classification methods, to explore and to visualize results. WEKA is a popular suite of machine learning software. WEKA is developed at the University of Waikato, New Zealand. C. Goals of the current article Relative to what is known in the empirical literature about the value of observational systems for assessing teaching effectiveness, much less is known about the viability and efficacy of these methods for assessing teaching effectiveness. Moreover, few observation assessment tools have been designed by combining empirically based strategies with key stakeholder feedback to ensure the developmental and cultural appropriateness of the resultant assessment tool. Hence, the authors use systematic observation protocols in classroom with well-developed, research-based rubrics, gathered in an interactive grid, to quantify teaching behaviours, acts and attitudes along a number of dimensions. They tried to prove the Darling-Hammond and Charles’s [7] assumption that “the more teachers are enabled to enact professional standards of practice in their classrooms, the more effective they are in supporting student learning”. As such, it was hypothesized that teaching effectiveness ratio would be positively correlated with educational concepts such as “Ability to Change the Course of Events”. Experimental results show that the proposed teaching effectiveness assessment scheme can correctly measure teaching performance according to their gathered data with the interactive observational grid. Significantly, the teaching effectiveness evaluation results were applied to extract knowledge about teaching and learning
progress and identifying major educational concepts that constitute the fulcrum of teaching effectiveness. Thus, we focus in this paper, within many experimental trials on identifying the most precise classification of the main teaching effectiveness concept mentioned above. We used three recognised algorithms that processed more than 200 class visits with more than 400 single data for each one. III. METHODOLOGY A. Data description We obtained a collection of many teaching practices and students’ interaction acts from many classrooms visits. We used an interactive grid conceived in thesis work of Besbes [10], as an observational instrument for our measures. The knowledge content of the visited courses is about physics, chemistry, and mathematics. In about 30 visits we record teaching practices of Arabic, French, English, History, and geographic courses sessions. The interactive grid contains 63 pedagogical acts, which are generally manifested in most teaching practices. Those acts are subdivided in three sets. One first set of 27 practices which are measured by their time durations, and then quantified by their rates according to the total session course duration. Another second set of 27 teachers and students’ behaviors and attitudes are evaluated on -3 to +3 Likert [11] scales. The final sets of 9 measures are the durations of channels that teachers choose to convey knowledge: when they speak, they draw, they write, they show pictures or curves … Our first version of interactive grid did not contain the 27 behaviors and attitudes criteria of the second set. As consequence, missing data appear within more or less than 100 visits and when we apply our classifications models, a bias appear, as Tabachnik and al [12] confirm. Missing data are extremely common through social science research as mentioned by Puma and al [13]; we tried to gap this missingness by substitutions that will be described. B. Experiments Raw data set: Without any further treatments on our initial database, we apply some classifications methods and we select three better results’ algorithms. All tests are done in convenient parameterized WEKA environment. Missing data handling technique: In order to fill the void in our database we proceed to calculate mean values for each missing data. This is done by following rational way. In previous treatment we substituted the global grades by one of three qualifications: Low, if grade < (Average_of_grades standard_deviation /2) it gives Grade < 11.41, Medium, if (Average_of_grades - standard_deviation /2) < grade < (Average_of_grades + standard_deviation /2), it gives 11.41 < Grade < 13.98, High, if grade > (Average_of_grades + standard_deviation /2), it gives Grade > 13.98. TABLE I DATA SET DESCRIPTION Grade (Numerical)
Grade (Nominal)
63 recorded quantified acts, practices and behaviours
7
Low
---
Teacher_B
12
Medium
---
Teacher_C
16
High
---
Teacher_A
-------------------------------------------
We select similar grade qualifications that imply similar teaching effectiveness assessment and we calculate the mean value of each missing attribute. Thus, missing values are filled with average ones. The same three algorithms are also applied on the complete filled database. Table I above shows data organization in collected database. All grades are qualified according their membership to previous described ranges of values. Using attribute selection: In order to enhance classification precision we qualified the 27 behaviors and attitudes criteria from Likert scale estimation to nominal values as follows: Low: if scaled value = -3 or -2, Medium: if scaled value is between -1 and 1, High: if scaled value = 2 or 3. Then we used the attribute evaluator “InfoGainAttributeEval” and the search method “Ranker” on our last version of database. As consequence, we obtained only 13 input attributes, instead of the initial 63, that have the most effects on the predictor (the educational concept: “Teachers’ ability to change the course of events”). Let’s present and discuss the three experiments results in the following section. IV. RESULTS AND DISCUSSIONS
However, random tree algorithm has the most accurate results: it classified instances with the most rate of correctness and it had the high average value of precision in each class. However, there is a need to improve those results and to obtain more accurate classified instances. This will be done by a convenient treatment of our database; this will be detailed in next sections. B. Missing data handling technique TABLE III MISSING DATA HANDLING TECHNIQUE TEST
Method
TABLE II RAW DATA SET TEST
Method
Class
TP Precision Rate
ROC Area
High
0.755
0.573
0.651
Low
0.283
0.619
0.617
Medium
0.366
0.394
0.54
Average
0.521
0.523
0.606
High
0.777
0.533
0.676
Low
0.326
0.682
0.801
Medium
0.296
0.404
0.544
Average
0.517
0.522
0.659
High
0.681
0.66
0.711
Low
0.413
0.528
0.732
Medium
0.465
0.423
0.598
Average
0.55
0.551
0.677
AIRS1
Lazy KStar
Random Tree
C. Classified Instances
52.13%
51.65%
54.97%
Within WEKA environment, we began to execute the three classification algorithms using our first database version. Main results are gathered in table II. The correct classified instances rate for AIRS1 is 52.13%. Lazy KStar algorithm classified correctly 51.65% instances. Random Tree give the more precise result with 54.97% of correct classified instances. Those rates for the three classification algorithms are not enough efficient to be exploited in a conceived model. We noted also that average precisions for the three algorithms in identifying High, Low, and medium classes are around 0.5. It confirms that classification results are not enough accurate.
TP Rate
Precision
ROC Area
High
0.84
0.878
0.873
Low
0.935
0.86
0.946
Medium
0.746
0.746
0.809
Average
0.829
0.83
0.867
High
0.83
0.772
0.914
Low
0.804
0.925
0.991
Medium
0.69
0.7
0.876
Average
0.777
0.781
0.918
High
0.798
0.824
0.831
Low
0.891
0.854
0.924
Medium
0.746
0.736
0.805
Average
0.801
0.801
0.843
AIRS1
Lazy KStar
A. Raw data set
Class
Random Tree
C. Classified Instances
82.93 %
77.72 %
80.09%
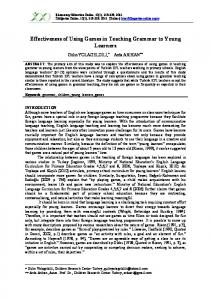
WEKA is usually our work environment; we execute the three classification algorithms using our second completed database. Main results are gathered in table III. In general, the correct classified instances rates evolve considerably. For AIRS1 the rate increased from 52.13% to 82.93%. AIRS1 becomes the most classification algorithm. Lazy KStar algorithm classified correctly 77.72% instances instead of 51.65%. Random Tree gave a rate of 80.09% instead of 54.97% correct classified instances. Efficiency within this second database had increased significantly. Lazy KStar is still the last precise classification method. However, we still have a need to improve more those results for a higher accurate result. C. Using attribute selection We used the attribute evaluator “InfoGainAttributeEval” and the search method “Ranker” on our last version of database. Correct classified instances rates reach values beyond the limit of 90%, which is more than expected. Indeed, AIRS1gave 94.3% correctness rate. Random tree algorithm reach better rate with 94.8%. Finally, Lazy KStar algorithm had the best results with high classification accuracy that have the value of 95.7%. A notable evolvement is clearly shown on Fig.1 within all used algorithms. Test 3 gave accurate results for three algorithms, lazy KStar came first with a slit difference.
course and in majority low for less effective course. This proves the attributes selection’s accuracy of these classifications’ methods and their efficiency regarding educational interpretation of their results. V. CONCLUSIONS
Fig.1 Correct classified instances for three algorithms obtained by three tests.
When using attribute selection we obtained 13 input attributes that have the most effects on the predictor. Six of them are quantitative values (time duration). The remaining seven are teachers and learners’ behaviours and attitudes. In order to interpret the significance of quantitative attributes that are presented on Fig.2, we choose randomly to instances. One belongs to a high effective course session: an effective teaching and learning record, the other for a very less effective course session.
Educational data mining is an emerging discipline, concerned with developing intelligent methods to extract knowledge from different types of data within academia context. The use of these methods aims to identify and better understand the learner profiles, teaching practices characteristics and context details in which both teachers and learners interact. Within this research work, we were able to quantify in real-time relevant criteria for the recognition of actors’ profiles in the process of teaching and learning. Criteria for equity confer more justice and rigor with associated indicators to assess. These quantified indicators constituted a generated raw data source from which three classification algorithms extract relevant and vital knowledge. They classified, with high rates accuracy, the most effective teaching and learning course sessions and the least effective ones. They classified teachers who are highly “able to change the course of events” and those who have low aptitude to make the change. More processes can be done with findings of research in data mining using recognition and extraction features algorithms. REFERENCES [1]
[2]
[3] [4]
[5]
[6] Fig.2 High and low estimated course session for the six selected attributes.
The six selected attributes belong to three educational functions. “Students’ Initiative” is an act member of “interaction” function which indicates the amount of students’ participation and collaboration to the knowledge construction. It has a positive impact on teaching effectiveness. The following four practices are members of “imposition” function. All acts of this function are linked to authoritarian teacher’s behaviors. It has a negative influence on teaching effectiveness. The last one, “Teacher summarizes what students said” belongs to “Development” function which summarizes teaching acts that enhance and encourage students to be involved in rational discussions and peers interactions in order to contribute effectively to their lesson. On Fig.2 we can observe that for the first and last acts, “high” effective course has greater values than “low” effective course. However, the durations of the “imposition” acts are higher for “low” effective course. For the seven remaining behaviors and attitudes, they are, overwhelmingly high for most effective
[7]
[8]
[9] [10]
[11] [12] [13]
[14]
L. Darling-Hammond, and C.E. Ducommun, “Recognizing and developing effective teaching: what policy makers should know and do”, National Education Association (NEA) and American Association of Colleges for Teacher Education (AACTE), May 2010. A.T. Milanowsky, S.M. Kimball, and B. White, “The relationship between standards-based teacher evaluation scores and student achievement.” University of Wisconsin-Madison, Consortium for Policy Research in Education, 2004. M.T. Braverman, “Foundations and Evaluation context and practices for effective philanthropy”, 2004. P. Sammons, J. Ko, Using systematic classroom observation schedules to investigate effective teaching: overview of quantitative findings. An Effective Classroom Practice project report. Swindon: ESRC, 2008. D.M. Medley, Teacher effectiveness. In H. Mitzel, Encyclopedia of educational research, 5th edition, 1982, pp. 1841-51, New York: Free Press. Artificial Immune system. [Online]. Available: http://.en.wikipedia.org/wiki/Artificial_immune_system. C. Sugandhi, P. Yasadha, and M. Kannan, “Analysis of a Population of Cataract Patients Databases in WEKA Tool”, International Journal of Scientific and Engineering Research Volume 2, Issue 10, Oct-2011. S. Vijayarani, and M. Muthulakshmi, “Comparative Analysis of Bayes and Lazy classification Algorithms”, International Journal of Advanced Research in Computer and communication Engineering”, Vol2, Issue 8, August 2013. Waikato Environment for knowledge Analysis (WEKA) version 3.7.11, Available: http://www.cs.waikato.ac.nz/ml/weka/. R. Besbes, “Hierarchical fuzzy system for teaching effectiveness assessment,” PhD thesis, National institute of engineering, Sfax, Tunisia, May, 2012. A.A. Huczynski, and D.A. Buchanan, Organizational Behaviour. 6th Edition, Pearson Education, 2007. G. G. Tabachnick, , and L. S. Fidell, Experimental Designs Using ANOVA. Belmont, CA: Duxbury, 2007. M. J. Puma, R. B. Olsen, S. H. Bell, and C. Price, “What to Do When Data Are Missing in Group Randomized Controlled Trials”, NCEE 2009-0049 U.S. DEPARTMENT OF EDUCATION, 2009. E. S. Shapiro, P. Heick, School psychologist assessment practices in the evaluation of students referred for social/behavioral/emotional problems. Psychology in the Schools, 41, 551–561, 2004.