Estimating Development Effort in Free/Open Source Software Projects by Mining Software Repositories Gregorio Robles, Jesus M. González-Barahona, Carlos Cervigón GSyC/LibreSoft Universidad Rey Juan Carlos Madrid, Spain
Andrea Capiluppi Information Systems and Computing Brunel University London, UK
Daniel Izquierdo-Cortázar Bitergia S.L. Madrid, Spain
[email protected] [email protected] {grex,jgb,ccervigon}@gsyc.urjc.es ABSTRACT Because of the distributed and collaborative nature of free / open source software (FOSS) projects, the development effort invested in a project is usually unknown, even after the software has been released. However, this information is becoming of major interest, especially —but not only— because of the growth in the number of companies for which FOSS has become relevant for their business strategy. In this paper we present a novel approach to estimate effort by considering data from source code management repositories. We apply our model to the OpenStack project, a FOSS project with more than 1,000 authors, in which several tens of companies cooperate. Based on data from its repositories and together with the input from a survey answered by more than 100 developers, we show that the model offers a simple, but sound way of obtaining software development estimations with bounded margins of error.
Categories and Subject Descriptors D.2.9 [Software Engineering]: Management—Cost estimation
Keywords Effort estimation, open source, free software, mining software repositories
1.
INTRODUCTION
Traditional, effort estimation is generally used by companies in the early stages of a project to estimate the number of developers and the amount of time that it will require to develop a software. Once the project is over, the estimations are no longer needed, because companies usually know the actual effort devoted. In free / open source software (FOSS) projects, volunteer developers may co-operate with others paid by companies
Permission to make digital or hard copies of all or part of this work for personal or classroom use is granted without fee provided that copies are not made or distributed for profit or commercial advantage and that copies bear this notice and the full citation on the first page. To copy otherwise, to republish, to post on servers or to redistribute to lists, requires prior specific permission and/or a fee. MSR ’14 Copyright 20XX ACM X-XXXXX-XX-X/XX/XX ...$15.00.
to work on the project [9]. In these cases the total amount of effort invested in the project is usually not known even afterwards. FOSS projects gained relevance in the late 1990s. Since then, the amount of companies involved in FOSS projects has been growing, and new collaborations have emerged. While during its beginnings FOSS was mostly developed by volunteers, nowadays the collaboration between developers is more varied, and projects range from those still developed only by volunteers, to those which are based on the collaboration of companies with volunteers (e.g., GNOME, Linux), to the clear industrial ones, in which the main driving force are companies (e.g., WebKit or OpenStack) [11, 7]. In the case of a company participation, obtaining overall the development effort for a certain period of time, which is usually an important measure for a company, is not straightforward. Individual companies are usually aware of the effort they put into projects, but they do not have a clear picture of the effort by the rest of the community, including other companies collaborating in the same project. Not only the companies involved in FOSS development are interested in estimating effort in FOSS projects: foundations that act as umbrellas for many FOSS projects have also interest in this data, as it may offer insights into the project and attract industrial interest [22]. In this paper we present a quantitative approach to effort estimation, based on the observation of real development work. For estimating effort in a project, we calibrate a general model, based on measurements, with the aim of limiting the margin of error and obtaining a good estimation. The estimated effort takes into consideration (i) the individuals who do not dedicate their whole work-day to FLOSS development, and (ii) developers -hired by companies or notthat work full-time in the project. The challenge consists in selecting the appropriate measurements for estimating the work performed, and in mapping such work to developers in a unique way, considering the extremely different working patterns observable in FOSS projects [24, 23, 15, 5]. Our model examines and estimates the effort from the activity tracked in a project’s source code repository. In particular, a simple method is sought, so that a reasonable estimation should be obtained from mining of the source code repository. Apart from specific tasks that require human interaction, the proposed method is completely automatable. Two main measurements of activity will be used: (1) the number of changes to source code (commits) per developer
(as a proxy of the amount of activity per person), and (2) the number of days with commits per person (as a proxy of the time periods when a person is actively developing software). A part of the study was a survey sent to developers of OpenStack, asking for the effort they devoted to the project. These results were used both to calibrate our estimation model, and to validate the results of its application. The rest of this paper comprises the following: in the next section, the model for effort estimation is presented. Then, we introduce OpenStack, the software project used as a case study. Being our approach of empirical nature, we offer in section 4 some details about the experimental design, which includes details on the survey that was sent to OpenStack developers. The next section is devoted to the analysis of the parameters of the model that provide estimations with minor margin of error. The parameters obtained will be used to obtain some estimations (section 6). Our approach is then validated. Section 8 presents the related research; threats to validity follow. Conclusions are finally given and avenues for future work discussed.
2.
MODEL
In this section, a model for estimating the effort based on tracing the developers’ activity is presented. This model translates the activity of a developer, as recorded in the source code management system, into effort measured in person-months. Although there are other development repositories where developer activities can be tracked, we have found that the results obtained from SCM systems are good enough to produce a reasonably accurate estimation of effort, as will be shown below. When mapping the activity traces to effort, the main issue to be solved is that the activity can be traced only in certain points in time (e.g., when a commit is introduced into the code base). The information about how long a developer has devoted to produce the contribution is completely missing. It is well known that contributions to FOSS projects are not uniform: a few developers are responsible for a major amount of the work, while a large number of developers contribute with a comparatively small one [18, 20]. So, one of the problems when measuring effort of the overall FLOSS development process consists in translating the uneven nature of contributions [12] into a consistent estimation model. Inferring the effort devoted by regular and occasional contributors is not easy, and in addition is a source of high inaccuracies. However, it is known that there are developers working full-time on the project, usually but not necessarily hired by companies. Based on the normal work hours in a paid job, we can assume that these developers devote to the project around 40h/week. We could also estimate for them one person-month of effort with a low margin of error. Thus, the model we propose is based at first on identifying those developers that collaborate full-time in the project. We base our approach on two assumptions: • With good precision, we can identify those developers working full-time on the project. If that is the case, those developers can be considered to devote one person-month (i.e., 40h/week) of effort during the months they work full-time in the project. • The number of contributions by full-time developers is sufficiently large: conversely, the other developers
contribute a relatively small amount of effort to the project. Since the contributions by the rest of developers are small, even gross estimations of it, which could have a relatively large error, will have a little influence in the total estimation error. As an example, let’s imagine a project P with 1,000 developers of which 100 can be identified as full-time. As each month we assign one person-month to each full-time developer, we would have a total effort of 100 person-months from these developers every month. If the 100 full-time developers author 90% of the contributions to the project in that month, we could estimate the contribution of the rest of the developers in the range of 10 person-months. The total estimation for the project in a month would then be 110 person-months, which is composed of a larger part (around 100 person-months) in which the margin of error is small; and a smaller part (around 10 person-months) where the margin of error can be large. At the current state of our research we are not able to provide a value to the margin of error of our estimation. Given the proportion between the efforts involved, we can state that the large error introduced by occasional contributors is mitigated by the fact that its weight on the total effort is low. Hence, in our previous example, the effect of a 20% margin of error for the effort estimated by full-time contributors is equivalent to a 100% margin of error by the rest. In order to identify the full-time developers, we have used two possible measures for each developer: • Number of commits merged in the code base during a given period. • Number of active days during a given period, considered as days in which the developer performs at least one commit to the code base. In both cases, the model is based on finding a threshold value t for the number of commits (or active days) for which we identify full-time developers with a minimum error, while the number of non-full-time developers identified by mistaken is very low. Ideally, activity of all full-time developers would be above t while non full-time developers would stay below it. In the real cases, the error for mistakenly identified full-time and non full-time developers should be estimated, with the aim of keeping it as low as possible. In order to calculate values for the threshold t, we sent a survey to OpenStack developers. In this survey, we asked them how many hours per week in the mean they spent in the project in the last six months, as well as how they see their commitment (full-time, part-time, occasional). This information is contrasted with the activity of the developer in the versioning system during the last six months. We calculate the best fits for several values of t and obtain effort estimations in person-months. We would like to point out that we have anecdotal evidence from some FOSS managers at companies that use what we could call a naive version of the model for their estimations. What is done is to assign 1 person-month of effort to any developer with at least one commit in a month. In our model, this would be equivalent to have a threshold value of t=1.
3.
CASE STUDY
can be obtained from its metadata), and does not include information on how much time or effort the developer has spent on it [1]. In OpenStack commits require usually to be approved, as a review process is in practice. This makes contributing a commit a very elaborated process, slow and with a big granularity (i.e., with many files), closer to the traditional Modification Requests in industry [21] than to commit patterns found in other FOSS projects.
OpenStack is a software project to build a SaaS (software as a service) platform. Even being a young project, with its first official release in 2010, over 200 companies have become involved in the project in such a short period of time. AMD, Brocade Communications Systems, Canonical, Cisco, Dell, Ericsson, Groupe Bull, HP, IBM, InkTank, Intel, NEC, Rackspace Hosting, Red Hat, SUSE Linux, VMware Yahoo! and many others have been participating in OpenStack since. First release # Authors (distinct) # Commits # Commits (without bots) SLoC (approx.)
• Active day: day in which the developer performs at least one commit to the code base. We have used it as an alternative measure of activity to commits.
October 2010 1410 89,871 68,587 1,650,000
• Committer: developer who performs the commit to the repository. May not have to be the author of the changes. In our model, we do not consider committers.
Table 1: Main parameters of the OpenStack project, January 2014.
• Author (or developer, or contributor): individual who contributes the changes, but may not be the one who performs the commit (which is done by the committer). Depending on the amount of contributions (in number of commits or number of active days), we identified their status as a “full-time” or “non-fulltime” contributor. Depending on their status, the empirical approach assigns a person-month (PM) for fulltime developers or a fraction of a person-month for the rest.
Table 1 provides a summary of the project. There are 1,840 distinct author identifiers in the source code management system. After applying a merging algorithm [19], manual inspection and feedback from the community, 1,410 distinct real authors have been identified, once duplicate ids were merged. The total number of commits is almost 90,000, although many of these have been done automatically by bots. Bot name Jenkins OpenStack Jenkins Jenkins
• Person-Month (PM): measure of effort. We suppose that a person-month is observed when a developer devotes the relative amount of time of a 40 hour-week to the project. Full-time developers hence account for one PM for each month worked on the project.
Bot mail address
[email protected] [email protected] [email protected]
• Period of study: timespan during which developers with more activity than a threshold t will be considered as full-time developers. Although the natural measure of the period could be thought to be one month, our experience has shown that using larger timespans has many benefits as it smooths the effect of vacations, travels, and non-constant work, among others. Being the release cycle of OpenStack of six months, we have selected periods of study of that length in order to avoid influences of the process in our measures. A developer who surpasses the threshold in the six month period will be thus considered to have devoted 6 PMs. A developer with activity a, less than the requited threshold t, will be assigned an effort of 6 * a / t PMs.
Table 2: Main bots found as authors in the OpenStack source code management. Table 2 contains the bots that merge commits in the versioning system. They are responsible for 21,284 commits, almost 25% of all commits in the project. OpenStack, as many other FOSS projects, has an uneven contribution pattern where a small group of developers have authored a major part of the project. In summary, 80% of the commits have been authored by slightly less than 8% of the authors, while 90% of the commits correspond to about 17% of all the authors. We have thus a situation where the assumptions of our model above are true. In addition, as the corporate involvement in OpenStack is significant, this should allow us to identify full-time developers from companies. The OpenStack Foundation estimates that around 250 developers work professionally in the project.
4.
EXPERIMENTAL DESIGN
4.1
Activity data
This paper presents an empirical approach to measure the effort within FLOSS projects, based on the number of commits logged onto the versioning system by the developers of that project. We base our research on following concepts: • Commit: action by which a developer synchronizes a set of changes to the versioning system repository. A commit is given by a point in time (the timestamp
For this study, we have used the data gathered by Bitergia for the OpenStack Foundation, which has been carefully curated and validated [13]. The original data is available, as MySQL database dumps, from the OpenStack Development Dashboard1 . The data has been discussed and commented with several experts from the OpenStack community to find issues in it, which have been addressed to improve its quality. The information from the source code management repository is obtained by means of the CVSAnalY tool, which is part of the MetricsGrimoire toolset2 . CVSAnalY retrieved 1 2
http://activity.openstack.org http://metricsgrimoire.github.io
information from repositories (in the case of OpenStack, git repositories) of the project, and stores it in a MySQL database, ready for analysis. Real authors of commits, corresponding to persons, are identified by using several algorithms to merge the different author identities they may use (usually, different email address used as git author identifiers) [19]. This process has been manually checked and completed. All this work has been done on the dataset by Bitergia, the company maintaining the OpenStack Foundation Development Dashboard. Methods and tools used in the production of the curated dataset have been discussed and checked by the authors.
4.2
Survey data
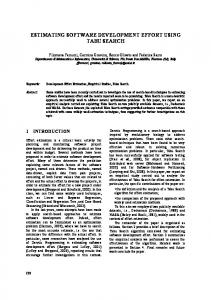
To obtain data of the time commitment of the OpenStack developers, we designed an on-line survey. We obtained the e-mail addresses of the developers from their authorship information in the versioning system, and sent them an e-mail with an invitation to participate. The questionnaire was composed of two web pages and contained following questions (information of the page in which the question appeared and the type of question is offered in brackets before the question; possible answers are given in brackets after the question): • (1, Selection): On average, how many hours in a week have you spent in the project in the last six months? (>40h, 40h, 30h, 20h, 10h, 95%, approx. 75%, approx. 50%, approx. 25%, 20. Figure 3 offers a detailed view of the values of t where the F-measure and accuracy obtain their maximum values. The F-measure, which is the harmonic mean of recall and precision, peaks at t=9 with a value of 0.75. Accuracy is calculated as: Accuracy =
tp +tn tp +tn +fp +fn
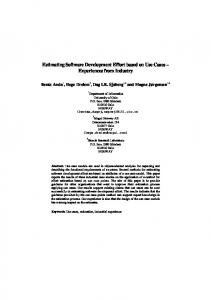
and provides another measure used in classification to determine the quality of the classification criteria. The maximum value of accuracy (0.78) is obtained for t=9 and t=10. Figure 4 provides visual detail on how the classification is performed and how this affects these measures. On the left, we can see how the identification of full-time developers becomes less accurate while the threshold t grows. However, as can be seen from the figure on the right, for non-full-time developers the effect is the contrary: the classifier gets better
Figure 2: Relevant measures (precision, recall, F-measure, accuracy and goodness) for several values of threshold t. Figure 3 provides a detail of this graph for values of t between 7 and 15.
Figure 3: Zoom of relevant measures (precision, recall, F-measure, accuracy and goodness) for values of t between 7 and 15.
with higher values of t. It can be observed that the curve for non-full-time developers saturates quickly, while the one for full-time developers decreases more slowly. This means that there are many non-occasional contributors with a low number of contributions, while contributions by full-time developers are almost uniformly spread among all amounts of contributions. There is an effect in our effort estimation model that should be taken into consideration as it is usually not to be found in information retrieval and pattern recognition: false
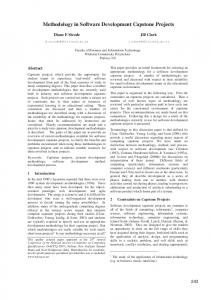
positives and false negatives may compensate each other. This happens because a wrongly classified (false positive) non-full-time developer is assigned the effort of a full-time developer; if a full-time developer exists that has been classified as non-full-time developer (false negative), then this error is compensated by the former. Figure 5 presents this situation graphically by subtracting the number of wrong classified non-full-time developers from the number of incorrectly classified full-time developers. As it can be seen, for t=1 no full-time developer has been incorrectly classified, but all non-full-time developers have. No compensation occurs then. However, as t increases the error of classifying full-time developers incorrectly is compensated by the error of classifying non-full-time developers. The value for which the number of non-compensated errors is minimum corresponds to t=12, where the difference is 1 (i.e., there is one false negative more than false positives). Because of this compensation phenomenon, we have conceived a new measure that takes this effect into consideration. We have called it goodness; it depends on the number of non compensated classifications (the numerator, an absolute value, since compensation works both ways) and is normalized by dividing it with the total number of positives and false negatives. To obtain a value of goodness which becomes better as it gets closer to 1, we subtract the result of the fraction from 1. Thus, goodness can be calculated as follows: Goodness = 1 −
|(tp +fp )−(tp+f n)| tp+f n+f p
where tp stands for true positive, fp for false positive and fn for false negative. The reader should note that we do not need to consider true negatives in this measure; true negatives are given by those non-full-time contributors that have been correctly categorized. Given that their effect in our model is assumed to be small, this omission is in line
Figure 4: (l) True positives (tp) and false negatives (fn) for full-time developer identification for several values of threshold t. (r) False positives (fp) and true negatives (tn) for non-full-time developer identification for several values of threshold t.
tion can be obtained with threshold values in the range from t=9 to t=12. A side result of our analysis is that in OpenStack the difference between using commits or active days as an activity measure is not significant. Talking with OpenStack developers about this fact, they recognized that the development process in OpenStack puts a very high priority on stability. Thus, code is not formally committed to the repository until it has been through extensive review, usually including several revisions. This has as a consequence that commits are larger and more costly (in time and effort) than in other FOSS projects. This is also the reason why we have obtained in our analysis threshold values of 9 to 12 commits every semester to be considered a full-time OpenStack developer, a number of commits that in other projects is easier to achieve. Although this does not affect the validity of our case study, further research should address this issue to offer a general model. Figure 5: Compensation between false positives and false negatives for values of t. Negatives values of the y axis indicate false positives that do not get compensated by false negatives, while positive values of the y axis indicate false negatives not compensated by false positives.
with the model. If all classification errors get compensated, the numerator of the goodness formula will be 0 and the value of goodness will be 1. If there are many errors which are not compensated, the numerator will grow and the resulting goodness would be low. Figure 3 shows that the value of goodness peaks at t=12 (0.979). So, even if the F-measure and accuracy have slightly lower values than their maximum for that threshold, the error for our effort estimation should be smaller for t=12 due to the effect of compensation that the goodness factor recognizes. All in all, our analysis shows that the best effort estima-
6.
RESULTS
Table 3 shows the results obtained with our approach using several values of the threshold t. Considering the global effort through the whole lifespan of the project, we can see that -as expected- the number of person-months decreases while the threshold increases. The naive approach, where a single commit in a semester would have been coded as 6 person-months, results in 17,400 person-months, which as already discussed could be considered as an upper bound of the effort. According to the analysis, the best values for the t threshold are between 9 and 12. For such scenarios, the estimation of the amount of effort that has invested in the project lies around 9,000 person-months (750 person-years), which is half of the estimation value produced by the naive approach. The table also provides information for every semester. As it can be observed, the effort devoted to the project is increasing with time, with a maximum for all the thresholds in the second semester of 2013. If we take the value of 12 as the threshold, 2,634 person-months have been working during the last six months. This implies that we estimate that the actual effort on OpenStack has been around
440 person-months during the last six months. When asking OpenStack members about these figures, they confirmed that they sound reasonable as the estimation of the OpenStack foundation is that currently over 250 professional developers work on the project hired by companies. t 1 2 3 4 5 6 7 8 9 10 11 12 13 14 15 16 17 18 19 20
Effort 17400 15255 13804 12747 11891 11213 10629 10128 9683 9298 8957 8655 8370 8112 7876 7662 7466 7284 7109 6945
10s2 426 420 402 389 378 370 362 355 345 337 330 324 318 313 308 303 298 294 291 288
11s1 816 813 798 785 768 757 743 732 721 711 700 690 680 672 663 656 648 641 634 628
11s2 1242 1170 1110 1056 1008 964 927 896 866 841 819 800 782 767 753 740 729 719 708 698
12s1 1890 1647 1486 1383 1295 1224 1164 1112 1065 1025 987 955 924 896 872 850 830 812 794 777
12s2 2742 2385 2140 1964 1830 1726 1635 1560 1493 1434 1381 1334 1289 1247 1208 1173 1140 1107 1077 1048
13s1 4368 3783 3384 3074 2821 2618 2451 2310 2189 2086 1997 1919 1847 1781 1721 1666 1615 1568 1522 1481
13s2 5916 5037 4484 4098 3791 3554 3346 3164 3003 2864 2743 2634 2531 2437 2351 2275 2206 2142 2083 2025
Table 3: Estimated total effort (in PM), given per threshold value (column t). Estimated effort values for all semesters. On a side note, it should be noted that the ratio between the effort estimated with the naive approach and the one with a threshold of 12 is steadily increasing. In the second semester of 2010 the ratio was 1.31, while for the second semester of 2013 it has grown to 2.25. This is because the number of non-full-time contributors has grown as well. Thus we can see how much the “minor contributors” in the project affect the estimations given by our model. While the error (noise) introduced by these small contributions is included using the naive approach, higher values of t filtered it out. The result is not only a more realistic estimation, but as well an estimation where the more error-prone estimations have a smaller weight in the total effort.
7. 7.1
VALIDATION Share of commits
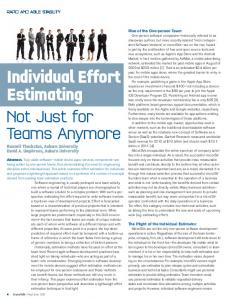
The approach is valid if the number of commits performed by those developers which we have identified as full-time developers consists of a large fraction of the total number of commits. Figure 6 provides information of this value for the first 50 values of t. Logically, for t=1 the total number of the 68,587 commits corresponds to developers identified as full-time (and thus the share is 1.0). This value decreases as t grows, but very slowly; for t=12, the share is still over 0.9, and it stays over 0.8 up to values of t close to 30. In summary, we see how the amount of work performed by those who we classify as full-time developers is over 10 times larger for values of t that provide the most accurate effort estimations (t=9 to t=12). This means that being our
Figure 6: Share of total number of commits by developers identified as full-time for several values of the threshold t.
classification accurate, the margin of error that is introduced by the rest of the effort is bounded. At this moment, we are unable to calculate with precision values for margins of error. However, with the current proportion of 10:1, margins of error of the margin of error of the rest can be up to 5 times the one of full-time developers to have the same effect on our estimation. So, for a margin of error of 20% in estimation for full-time developers, we still could afford a 100% error margin for the rest of developers so that the global, aggregated estimation of the project error will be around 25%. This is an important outcome of our model, and does not depend on the calculation of the margin of error, which should be addressed as future research.
7.2
Representativity of the survey sample
The survey provides data of a sampled number of developers. As we have invited all OpenStack authors to fill out the survey, the method used has not been random sampling: survey respondents are self-selected, and thus may not be representative for the whole population under study. Figure 7 shows two box-plots with the analysis of the active surveyed population and all active developers of the project in the last six months, which is the timespan we asked for in the survey. As the normality assumption of the t-test is not given in our samples, the non-parametric alternative Wilcoxon signed-rank test (also known as Wilcoxon-Mann-Whitney test) has been used. The null hypothesis for this test is that no difference between the two populations exist. When the p-value for the two-tail hypothesis is larger than the significance, we conclude that the the null hypothesis cannot be rejected. This happens for all populations considered with at least one commit in the time period. However, we also tested the hypothesis including inactive developers in the population. In that case, the survey is not representative and the null hypothesis can be rejected. The reason for this is that the inclusion of all inactive developers from all the project history introduces much interference. This is because the population of former developers is very different from the current one, so including it in the global population produces a severe transformation. As our model is based on activity, this fact is not a threat to its validity, but a supportive fact, as we perform the classification only with active developers. Nonetheless, as it can be seen from Table 4, as the values of activity increase, the survey
Commits 0 or more 1 or more 5 or more 8 or more 11 or more
Population all survey all survey all survey all survey all survey
Min. 0.00 0.00 1.00 1.00 5.00 5.00 8.00 8.00 11.00 11.00
1st Qu. 0.00 0.00 1.00 1.00 7.00 8.50 12.00 13.00 14.75 14.00
Median 1.00 4.00 3.00 5.00 13.00 16.50 19.00 22.00 24.00 26.00
Mean 9.62 14.12 13.76 16.35 29.37 29.38 37.77 35.57 44.34 38.83
3rd Qu. 6.00 14.00 11.00 19.00 30.00 34.75 41.00 42.75 52.00 50.00
Max. 491.00 201.00 491.00 201.00 491.00 201.00 491.00 201.00 491.00 201.00
p-value 0.005063 0.2008 0.2822 0.4171 0.9797
Table 4: Summary of population measures. Several populations have been selected, depending on a minimum number of commits. p-value as given by the Wilcoxon signed-rank test.
population becomes more representative of the project.
Capiluppi et al. [5] characterize the Linux kernel by the time in a day when the commits are observed in the repository, and when the author works most frequently. They divide a working day in traditional Office Hours (OH, from 9am to 5pm), After Office hours (AO, 5pm to 1am), and Late Hours (LH, from 1am to 8am). The authors present evidence that throughout the week the effort within the Linux kernel community is constant, different from the ones traditionally used in industrial settings where work is assumed 9am-5pm, Monday to Friday. The approach presented in this paper is based on the idea of characterizing developers, although we do this in a different way. Most of the effort estimation techniques are based on statistical methods. So, Koch et al. tried to obtain effort estimation based on the Pareto distribution found in FOSS projects [18]. Fernandez-Ramil et al. note that traditional software effort estimation methods such as COCOMO do not fit well FOSS projects and study effort using linear regression models [10]. Linear regression is as well the method used by Yu to predict indirectly maintenance effort in FOSS projects [25]. Anbalagan et al. have worked on predicting how much time developers spend in corrective maintenance of FOSS projects [2]. There are several studies that analyze how effort in FOSS is related to other aspects of the development process. In this sense, Capra et al. discuss and investigate empirically how governance, process and design quality affect development effort in FOSS projects [7]. In [8] evidence is shown that in FOSS projects the maintenance effort is lower than in industrial projects due to the fact that they are less prone to software decay. For a detailed, systematic review of software development effort estimation studies we refer to [16].
8.
9.
Figure 7: Boxplot with the activity (in number of commits during the last 6 months of 2013) for active surveyed developers and for all the active OpenStack developers in the last 6 months. Outliers with more than 50 commits are not shown.
RELATED RESEARCH
Effort estimation in FOSS projects has been the matter of research in several studies. The closest ones to the approach present in this paper are those that try to characterize developers in order to infer the effort devoted, as done in [1, 17, 5]. Amor et al. [1] propose to characterize the complete developer activity (versioning system, mails, bug-tracking system, etc.) in order to obtain a measure of the total effort invested in the project. This idea is extended by Kalliamvakou et al. in [17]. In comparison to our approach, this is a comprehensive focus that needs to gather data from many sources, and with the problem of estimating micro-contributions.
THREATS TO VALIDITY
All empirical studies, such as this one, are subject to threats to validity. In this section, we discuss how to mitigate or control these threats if possible. Conceptual Assumptions and assertions have been done. We have tried to make them explicit, as for instance the assumptions that a person-month equates to 40h/week. Some of them may require further support, but this does not invalidate the plausibility of the argument. Construct A replication package4 , following the guidelines in [14], is offered to others to reproduce our findings. 4
http://gsyc.urjc.es/~grex/repro/2014-msr-effort
The replication package contains all scripts and public information, but not all the results of the survey, as personal information was collected. Aggregated and anonymized information from the survey is available. Internal Having only considered one of the many sources of activity (and data) may result in our estimation model being not accurate. Further work is expected to be of broad interest and supportive of the claims presented. External OpenStack was chosen as the illustrative case study. We consider that this project is representative of many FOSS projects, especially those where many industry players cooperate. There may be certain practices that could only be found for OpenStack: for instance, their review process produces large (and few) commits, so values for threshold should be selected differently for other FLOSS projects. This remains to be investigated. However, as Bird and Zimmermann [4] do, we refer to the importance of the detailed study of a single project and that it is a misconception that this type of studies do not provide to the academic community any value, nor contribute to scientific development.
that are not considered in it, such as translation activities, art & graphic design, or documentation, which may follow different procedures. The effort devoted to community management and other community-related activities are also beyond the scope of our model. We envisage to expand this study by 1) studying other FOSS projects to ascertain if our method is applicable in general, and if it is to what extent; 2) performing a scientific experiment to obtain margins of error for the estimation of error for full-time developers; 3) investigating, by taking into consideration other FOSS projects, which of the two ways of measuring activity (commits or active days) is more suited for the model; 4) comparing our results with the ones provided by traditional software estimation models used in industry, such as COCOMO; 5) after quantifying the effort required in a FOSS project, is it more profitable for a prospective adopting company to redo (“make”) their own system, or to invest (“buy”) in the existing FLOSS system as is [3]? 6) comparing our approach with previous effort estimation techniques for FLOSS projects, as the one proposed in [6] based on the measure of entropy to calculate maintenance costs.
10.
11.
CONCLUSION, DISCUSSION AND FUTURE WORK
Differently from other effort estimation research attempts, this paper tackles two challenges. The first is how to design a simple, but sound approach to measure the effort provided in a sparse, distributed and uneven development scenario, like the FOSS one. This is achieved by evaluating the activity of developers and identifying what authors could be considered as “full-time” developers, and separating them from the other contributors. The activity of full-time developers is assigned one person-month per month in the period of study; other developers are assumed to be working less than a full month on a project, hence a fraction is assigned to them. The second challenge is how to design the model so that it offers a reasonable prediction. This affects primarily two aspects of the model: (1) the activity threshold to consider a developer as full-time or not, and (2) the credibility of the model. For the calculation of a threshold, we have obtained data from over a hundred developers, and we used traditional classification techniques to select the optimal threshold value. In addition, we have seen that the design of the model allows to compensate erroneous classifications of developers. Regarding the credibility of the model, we observe that the surveyed developers are representative of the project, resulting in threshold values with high confidence. In addition, since the majority of the effort is performed by those above the threshold, we could limit the overall margin of error by specifically focusing on those developers’ activities. This also limits the challenges in effectively measuring the activity of occasional, sporadic contributors, since their contributions are relatively low. As we have seen with our case study, the threshold calculation allows to identify with precision many full-time developers that account for approximately 90% of the total activity. This means that we have a large share of the effort in a reasonable confidence interval, and can narrow the effect of the rest of contributors. The model is concerned exclusively with effort performed by developers. There are many other tasks in a FOSS project
ACKNOWLEDGMENTS
The work of Gregorio Robles, Carlos Cervig´ on and Jes´ us M. Gonz´ alez-Barahona has been funded in part by the Spanish Government under project SobreSale (TIN2011-28110). The work of Daniel Izquierdo has been funded in part by the Torres Quevedo program (PTQ-12-05577). Our gratitude to all the OpenStack developers for their help and feedback.
12.
REFERENCES
[1] J. J. Amor, G. Robles, and J. M. Gonzalez-Barahona. Effort estimation by characterizing developer activity. In Proceedings of the 2006 international workshop on Economics driven software engineering research, pages 3–6. ACM, 2006. [2] P. Anbalagan and M. Vouk. On predicting the time taken to correct bug reports in Open Source projects. In Software Maintenance, 2009. ICSM 2009. IEEE International Conference on, pages 523–526. IEEE, 2009. [3] J. Asundi. The need for effort estimation models for open source software projects. ACM SIGSOFT Software Engineering Notes, 30(4):1–3, 2005. [4] C. Bird and T. Zimmermann. Assessing the value of branches with what-if analysis. In Proceedings of the ACM SIGSOFT 20th International Symposium on the Foundations of Software Engineering, page 45. ACM, 2012. [5] A. Capiluppi and D. Izquierdo-Cort´ azar. Effort estimation of FLOSS projects: a study of the Linux kernel. Empirical Software Engineering, 18(1):60–88, 2013. [6] E. Capra, C. Francalanci, and F. Merlo. The economics of open source software: an empirical analysis of maintenance costs. In Software Maintenance, 2007. ICSM 2007. IEEE International Conference on, pages 395–404. IEEE, 2007. [7] E. Capra, C. Francalanci, and F. Merlo. An empirical study on the relationship between software design quality, development effort and governance in Open
[8]
[9]
[10]
[11] [12]
[13]
[14]
[15]
[16]
[17]
[18]
[19]
[20]
[21]
[22]
Source Projects. Software Engineering, IEEE Transactions on, 34(6):765–782, 2008. E. Capra, C. Francalanci, and F. Merlo. The economics of community open source software projects: an empirical analysis of maintenance effort. Advances in Software Engineering, 2010, 2010. L. Dahlander and M. G. Magnusson. Relationships between open source software companies and communities: Observations from Nordic firms. Research Policy, 34(4):481–493, 2005. J. Fernandez-Ramil, D. Izquierdo-Cortazar, and T. Mens. What does it take to develop a million lines of Open Source code? In Open Source Ecosystems: Diverse Communities Interacting, pages 170–184. Springer, 2009. B. Fitzgerald. The transformation of Open Source Software. Mis Quarterly, pages 587–598, 2006. R. A. Ghosh, R. Glott, B. Krieger, and G. Robles. Free/libre and open source software: Survey and study, 2002. J. Gonzalez-Barahona, G. Robles, D. Izquierdo, and S. Maffulli. Using software analytics to understand how companies interact in free software communities. IEEE software, 30(5):38–45, 2013. J. M. Gonz´ alez-Barahona and G. Robles. On the reproducibility of empirical software engineering studies based on data retrieved from development repositories. Empirical Software Engineering, 17(1-2):75–89, 2012. I. Herraiz, G. Robles, J. J. Amor, T. Romera, and J. M. Gonz´ alez Barahona. The processes of joining in global distributed software projects. In Proceedings of the 2006 international workshop on Global software development for the practitioner, pages 27–33. ACM, 2006. M. Jorgensen and M. Shepperd. A systematic review of software development cost estimation studies. Software Engineering, IEEE Transactions on, 33(1):33–53, 2007. E. Kalliamvakou, G. Gousios, D. Spinellis, and N. Pouloudi. Measuring developer contribution from software repository data. MCIS, 2009:4th, 2009. S. Koch and G. Schneider. Effort, co-operation and co-ordination in an open source software project: Gnome. Information Systems Journal, 12(1):27–42, 2002. E. Kouters, B. Vasilescu, A. Serebrenik, and M. G. van den Brand. Who’s who in GNOME: Using LSA to merge software repository identities. In Software Maintenance (ICSM), 2012 28th IEEE International Conference on, pages 592–595. IEEE, 2012. A. Mockus, R. T. Fielding, and J. D. Herbsleb. Two case studies of open source software development: Apache and mozilla. ACM Transactions on Software Engineering and Methodology (TOSEM), 11(3):309–346, 2002. A. Mockus and L. G. Votta. Identifying reasons for software changes using historic databases. In Software Maintenance, 2000. Proceedings. International Conference on, pages 120–130. IEEE, 2000. D. Riehle. The economic case for Open Source foundations. Computer, 43(1):86–90, 2010.
[23] S. K. Shah. Motivation, governance, and the viability of hybrid forms in open source software development. Management Science, 52(7):1000–1014, 2006. [24] G. Von Krogh, S. Spaeth, and K. R. Lakhani. Community, joining, and specialization in open source software innovation: a case study. Research Policy, 32(7):1217–1241, 2003. [25] L. Yu. Indirectly predicting the maintenance effort of Open-Source Software. Journal of Software Maintenance and Evolution: Research and Practice, 18(5):311–332, 2006.