Abstract â In this study, we propose a new method to assess driver distraction, which is based on a cybernetic driver model. The approach consisted of two ...
DSC 2015 Europe
Germany
Ameyoe et al.
Estimation of Driver Distraction Using the Prediction Error of a Cybernetic Driver Model Ablamvi Ameyoe
1, 2
1
1
1
2
, Franck Mars , Philippe Chevrel , Eric Le-Carpentier , Hervé Illy
(1) IRCCyN, CNRS, Ecole Centrale de Nantes & Ecole des Mines de Nantes (France), e-mail: {Ablamvi.Ameyoe, Franck.Mars, Philippe.Chevrel, Eric.Le-Carpentier}@irccyn.ec-nantes.fr (2) Renault S.A.S., Guyancourt (France), e-mail: {ablamvi.ameyoe, herve.illy}@renault.com Abstract – In this study, we propose a new method to assess driver distraction, which is based on a cybernetic driver model. The approach consisted of two steps: learning and diagnosis. During the first 30 seconds of baseline driving (learning phase), the cybernetic driver model parameters were identified using an output error approach without noise. Then, during the diagnosis phase, the steering wheel torque was predicted continuously using the driver model. The prediction error was computed by comparing the predicted and observed steering wheel torques. The driver state was diagnosed using the prediction error. To assess the validity of the approach, four different secondary tasks (cognitive, visual, visuomotor and motor distraction) were tested. The results show that the prediction error of the steering wheel torque is associated with the consequence of driver distraction on driving performance. Keywords: Cybernetic driver model, Diagnosis, Distraction, Steering control
Introduction Driver inattention and distraction are major contributors to road incidents and crashes [NHT10]. With the rapid development of in-vehicle technology and other electronic devices, driver attention is more often focused on secondary activities than on the driving task itself, which increases the risk of accidents occurring. Thus, it is crucial to assess such situations and assist the driver in advance. This is why car manufacturers and academic researchers are searching for ways to assess driver distraction and reduce distraction-related crashes. The workload added by a secondary task most often influences how the driver steers the vehicle. Steering behaviour may become discontinuous, and jerky, or even less variable, depending on the type of distraction. Non-visual cognitive distractions, such as the resolution of problems, talking or even a wandering mind, most often yield a concentration of gaze in front of the vehicle and a counterintuitive decrease in lateral position variability. [Coo13] investigated the relationship between cognitive workload, gaze control and steering stability. They concluded that the influence of gaze has only a marginal influence on steering control. Instead, the improvement of lateral stability results from less cognitive interference in the execution of encapsulated sensorimotor skills when cognitive resources are monopolized by the secondary task. Unlike cognitive distraction, visual distraction results in a large variability in lateral position and even jerkier steering control. This is because more time is spent with the eyes directed away from the road
[Lia10]. When a driver takes his eye off the road, lateral errors may accumulate and the driver has to perform sudden corrective manoeuvres to avoid lane departure. This translates as a large variability in lane positioning and jerky control of the steering wheel [Nak99] [Eng05]. Distraction may also be associated with the manipulation of an in-vehicle device. In this case, a motor component is added to the cognitive distraction (if a driver’s eyes are still directed toward the road) or visual distraction (if the driver needs to look at the device during its manipulation). Some algorithms to assess driver distraction are based on physiological measurements (e.g. eye movements, pulse rate, and brain waves [Sod02] [Ten11] [Bor14]). The principal limitation of this approach is that specific measurement devices are needed in the vehicle itself. An alternative is to use data related to the vehicle-road environment (e.g. steering wheel angle, lateral position, etc.). Both physiological and behavioural indicators are commonly used to estimate driver distraction, although they do not predict driver state. A few attempts have been made to predict the effects of distraction by using a driver model [Sal02]. Considering that distractive activities influence the visual sampling of the environment, the control of the steering wheel, or even both at the same time, a driver model that represents the visual and motor control of steering may help to predict driver distraction in real time. Recently, such a cybernetic driver model has been proposed [Mar11] [Sal11] and used to design a shared control system [Sal13]. As a first step to assess whether this model could be used to predict distraction, the present study
Max Planck Institute for Biological Cybernetics, Tübingen, 16 – 18 Sep 2015
- 13 -
Estimation of Driver Distraction Using the Prediction Error of a Cybernetic Driver Model
analyzed the prediction error of this model in conditions of cognitive, visual, visuomotor, and motor workload. The method consisted in comparing the torque applied by the driver to the steering wheel to the torque that was predicted by the driver model, which was identified during undistracted driving. The aim was then to determine whether the prediction error would be commensurate to a modification of driver behaviour caused by distraction.
Method
DSC 2015 Europe
Germany
whereas the driver was in charge of lateral control and the secondary tasks. The experiment did not require lane change manoeuvres. Each participant first performed a 10-minute familiarization drive, which allowed them to get used to the driving simulator. The main experiment then started. It consisted of a succession of baseline driving (no distraction) and periods of distracted driving, plus one condition of driving with one hand. Each period lasted for 1.15 min. Four types of distraction were tested: cognitive, visual, visuomotor and motor.
Cognitive distraction
Participants Thirty-five participants (10 females and 25 males), aged between 21 and 60 years (mean age=32; SD=15), took part in the experiment. All of them held a valid driving license and had driving experience of 1 to 40 years (mean=11; SD=10). They reported that they drove for at least half an hour every day.
Simulator Track 1800 1600
The driver was instructed to count down by seven, starting from a high number. This task was equivalent to the mental workload experienced during a demanding conversation on a mobile phone, for instance.
Visual distraction The driver was instructed to read a text that appeared on the simulator’s right-hand LCD screen. This was equivalent to the type of visual distraction that can be caused by a peripheral information system.
Visuomotor distraction
1400
Y(m)
1200 1000 800 600 400 200 0 -1000
-800
-600
-400
-200
0
200
400
600
800
1000
X(m)
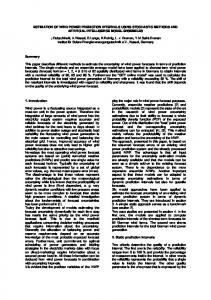
Fig 1:Fixed-base driving simulator and the track
Using a set of buttons on the side of the simulator, the driver had to dial sequences of numbers that he heard. He was instructed to look at the buttons when dialling. This secondary task is equivalent to tuning on a radio or interacting with a head-down display.
Motor distraction Data were collected on a fixed-base driving simulator. It consisted of a single-seat cockpit with full instrumentation (Fig 1). SCANeR Studio software was used with an advanced dynamic vehicle model. The visual environment was displayed on three 32-inch LCD monitors, one in front of the driver and two laterals turned at 45 degrees from the front one, viewed from a distance of 1 meter and covering 115 degrees of visual angle in width and 25 degrees in height. The graphic database reproduced a rural environment. After the experiment, the simulator data were down sampled at 20Hz and key variables related to the vehicle and the track were extracted for the analyses. The test was performed on a closed track consisting of a series of bends, as depicted in figure 1.
Protocol and Procedure Upon arrival, participants were briefed on the requirements of the experiment, namely, that they were to drive at a constant speed of 70 km/h whilst completing secondary tasks. An electronic controller was used to regulate the vehicle’s speed,
- 14 -
The same dialling task was performed, but this time the driver was instructed to keep his eyes on the road.
One-handed driving The driver was also instructed to steer using only the left hand. This condition was introduced to assess the effects of one-handed driving. It also characterized motor and visuomotor distractions, but without any secondary tasks. At the end of the test, subjective reports from each participant were recorded.
The cybernetic driver model Based on current knowledge of human sensorimotor functions (see [Mar11] for the theoretical background), the model’s internal structure can be divided into four parts (Fig 2): 1. the visual anticipation of the road curvature fed by the angular deviation (θfar) of a far point (the tangent point), 2. the visual compensation of lateral position error fed by the angular deviation (θnear) of a near point, 3. the time delay necessary for the driver to process visual information, and 4. a neuromuscular system that transforms the output of the previous
Max Planck Institute for Biological Cybernetics, Tübingen, 16 – 18 Sep 2015
DSC 2015 Europe
Germany
Ameyoe et al.
subsystems into steering wheel torque, taking into account the proprioceptive feedback (self-aligning torque) and the steering wheel angle. The model has two outputs: the steering wheel torque and driver intention. Driver intention is not measurable in physical terms. However, it can be compared with the steering wheel angle when identifying the parameters in order to increase the model’s identifiability. The model parameters are listed in table 1.
with: 𝑇𝑤 (𝑠): a 70-second long sliding window 𝛤𝑑 (𝑁. 𝑚): observed steering wheel torque 𝛤�𝑑 (𝑁. 𝑚): predicted steering wheel torque 𝑇𝑇𝑇(𝑁. 𝑚): torque prediction indicator
Standard Deviation of Lateral Position SDLP represents the participants’ lateral position variability. It is an indicator of steering stability at the trajectory level. It was computed as follows: 𝑆𝑆𝑆𝑆 = (
1
𝑁−1
Fig 2: Cybernetic driver model
The model’s parameters were identified by means of the PEM method [Lju99] for each participant during the first 30 seconds of baseline driving at the beginning of the experiment (learning phase).
with: 𝑁: number of samples in 𝑇𝑤 𝑦𝐿 (𝑚): lateral position of the vehicle 𝑦�𝐿 (𝑚): mean of the lateral position of the vehicle 𝑆𝑆𝑆𝑆(𝑚): standard deviation of the lateral position
Steering Wheel Reversal Rate
SWRR is an indicator of steering stability at the action level. It was computed as follows: 𝑆𝑆𝑆𝑆 =
Table 1: Cybernetic driver model parameters
Parameters Description
Kp Kc TI τp Kr Kt Tn v
visual anticipation gain visual compensation gain visual compensation time constant processing delay gain of the internal model of steering compliance gain of the stretch reflex neuromuscular time constant vehicle speed
Data analysis Three indicators were computed. Two of them are common indicators of steering performance: the standard deviation of lateral position (SDLP) and the steering wheel reversal rate (SWRR). The Torque Prediction Indicator (TPI) was based on the driver model prediction error.
Torque Prediction Indicator The TPI is based on the difference between the observed driver steering torque and the torque that was predicted by the driver model during the considered period. It was computed as follow: 𝑇𝑇𝑇 = (
1 𝑇𝑤 ∫ (𝛤𝑑 (𝑡) − 𝛤�𝑑 (𝑡))2 𝑑𝑑 𝑇𝑤 0
1
1
∑𝑁 �𝐿 )2 )2 , (2) 𝑘=1(𝑦𝐿 (𝑘) − 𝑦
𝑛𝑛 𝑇𝑤
,
(3)
with 𝑛𝑛=number of steering reversal within 𝑇𝑤 . A steering reversal occurs each time steering velocity is exceeded 0.7 rad /s. The TPI, SDLP and SWRR were computed during the different driving phases. All baseline periods, which were interleaved with the distraction conditions, were averaged. One-way repeated measures analyses of variance (ANOVA) with the driving condition as a six degree variable were performed. Dunnett’s tests were used to compare each distraction condition with the baseline condition. Additional Tukey HSD tests were calculated to compare the distraction conditions. The significance level was set at p