The Second International Conference “Problems of Cybernetics and Informatics” September 10-12, 2008, Baku, Azerbaijan. Section #1 “Information and Communication Technologies” www.pci2008.science.az/1/39.pdf ESTIMATION OF IMAGE COMPLEXITY FOR STEGANOGRAPHY AND WATERMARKING Vasif Nabiyev1, Mustafa Ulutaş2, Güzin Ulutaş3 1
Department of Computer Engineering, KTU, Trabzon, Turkey Department of Computer Engineering, OMU, Samsun, Turkey
2, 3
1
[email protected],
[email protected],
[email protected] Abstract
Information security and digital rights management are important topics of computer science as most of the transactions are performed over non secure channels nowadays. Steganography and watermarking are methods suggested for information security and digital rights management. Image complexity is used as a parameter by these techniques for improving methods’ success. A new image complexity measurement technique for gray level images is proposed in this paper. It is based on power spectral density of the input image. The output of the algorithm is normalized with respect to an image of white noise. Results of the algorithm are compared to popular image compression algorithms.
1. Introduction Internet is one of the most widely used communication channel due to fast growth of applications running over the Internet. Data transmission over the internet has security related issues even though most of the transactions are performed online [1]. Data security and copyright control are examples of security related issues. Because of the ease of digital duplication and tampering, data security becomes an important issue. Several approaches have been proposed to make communication more secure. Most widely used two techniques used in data security are steganography and cryptography. Cryptography transforms the original message into an unrecognizable form. Only an authorized user, who knows the transform algorithm applied by the sender, can retransform it to its original form. On the other hand, steganography hides a secret message in a cover medium to avoid malicious eyes. The cover could be a digital image, digital video, source code or even an html code. Attackers do not know that the cover medium has hidden secret data. Therefore, they will not aim to extract the original data [1, 2]. Digital images are usually used as cover medium and steganographic techniques use image-processing techniques for embedding secret message into a cover medium. Some features of the cover image play an important role for the success of the proposed steganographic techniques. Complexity of the image is one of the major factors. Complexity determines or limits the data embedding capacity of the cover image. Digital rights management is another problem on the Internet as most of the users share the content by peer to peer sharing applications. As the digital online broadcasting is developing, enormous digital multimedia contents are available easily [3]. High availability of the digital content creates the rights management problem. Digital watermarking solve this problem easily and so received much concentration for its potential prospect. Digital watermarking is the process of the embedding some forms of signature in multimedia content. Watermark capacity of an image depends on many factors. Therefore, it is not easy to calculate the watermark capacity of an image [2]. The number of imperceptible bits hidden is defined as the watermark capacity of that image. Recent publications make use of image content as a measure to find out the watermark capacity. Complexity is often used as a measure to determine the content of an image [4, 5]. Image complexity is used as a parameter by the steganographic, steganalytic, watermarking techniques for improving methods’ success [5]. Therefore, the technique to calculate the complexity becomes one of the most important parts of the method. A new method 144
The Second International Conference “Problems of Cybernetics and Informatics” September 10-12, 2008, Baku, Azerbaijan. Section #1 “Information and Communication Technologies” www.pci2008.science.az/1/39.pdf for measurement of the image’s complexity is introduced in this paper. Results are normalized into [0, 1] range and indicates the complexity compared to a white noise image complexity. A value close to one indicates a complex image whereas smaller values correspond to a smooth image with less gray level changes. This value could be used steganographic, watermarking or another application that needs to measure the complexity of an image. In other words, a general image complexity determination process that can be used in different applications is proposed. 2. Proposed Method Image complexity determination process has two steps to have a normalized complexity value. Computation of the power spectral density (PSD) of a white noise image as the most complex image is the first step and performed only once since the PSD of noise do not change. Second step uses the result of the first step to make a decision about an image’s relative complexity. The image under test may be used as a cover medium for steganographic technique or may be analyzed by the steganalytic technique, etc. The details of the first and second step are introduced below. An image of white noise is chosen as the reference image to determine the relative complexity level of any image. Pixels with uniform distributed values of in the range [0,2k-1] are used to create the reference image for k=8. The complexity of the reference image is assumed to be the upper limit for the algorithm. Then the power spectral density of the reference image is calculated and will be used for measuring any picture’s complexity relative to the reference. An 8x8 2-D Discrete Cosine Transform (DCT) is used to compute the power spectrum of each subblock in the image. 2D-DCT transforms a block in the spatial domain into frequency components according to the definition of DCT given below
Fu ,v =
4Cu Cv N2
N −1 N −1
∑∑ f j =0 k = 0
j ,k
⎛ (2 j + 1)uπ ⎞ ⎛ (2k + 1)vπ ⎞ cos⎜ ⎟, ⎟ cos⎜ 2N 2N ⎠ ⎝ ⎠ ⎝
(1)
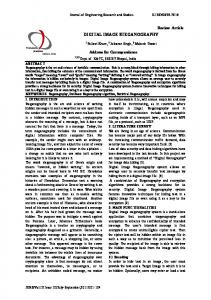
where f(j,k) is the jth row and kth column element of the subblock. Fu,v is the uth row and vth column element of the DCT coefficient matrix. In addition, Cu=Cv= 1 2 , when u=v=0; Cu=Cv=1 otherwise. The DCT coefficients are reordered by the zig-zag scan. This scan method reorders all the DCT coefficients from low frequency to high frequency. For most images, it is equivalent to sorting according to importance, since the perturbation in the low frequency components is generally more perceivable to human eyes than high frequency components. Zig-Zag scanning process is shown in Figure 1(a). After Zig-Zag scanning, (1x64) vector is produced. This vector contains coefficients of DCT block from low frequency to high frequency. Low-pass, Band-pass, High-pass filters are applied to this vector for constructing a feature vector about whole spectrum range of the subblock. Then normalization of each feature component is performed by using the same columns’ maximum value. Maximum values of low, middle and high frequency bands will be used later for normalization of any image’s frequency bands. Sum of the normalized feature vectors gives the whole power of the noise image. This procedure will be named as the “first step” of the algorithm and as shown in Figure 1(b). Matlab code of the first step is given below with some notations used throughout the algorithm. I Si dct2 ZigZag P
NxN gray level image Subblock being processed Two-dimensional DCT ZigZag scanning process Power of the image.
L_P B_P H_P A max_L,max_M,max_H
145
Low Pass filter Band Pass filter High Pass filter Contains feature vectors Max values of the frequency regions.
The Second International Conference “Problems of Cybernetics and Informatics” September 10-12, 2008, Baku, Azerbaijan. Section #1 “Information and Communication Technologies” www.pci2008.science.az/1/39.pdf k=1 for i= 1: 8: N for j= 1: 8: N Si = dct2(I (i:i+7,j:j+7) ) V = ZigZag (Si) A(k,:) = [L_P(V) B_P(V) H_P(V)] k=k+1 end end % Normalization procedure max_L = max(A(:,1)) ; max_M = max(A(:,1)); max_H = max(A(:,3)) A(:,1) = A(:,1)/max_L; A(:,2) = A(:,2)/max_M ; A(:,3) = A(:,3)/max_H P = sum (A)
P represents the whole power of the noise image. This value and max_L, max_M, max_H values are used in the second step of the algorithm. It is the same as first step except that normalization uses max_L, max_M, max_H values of the first step. Power of the image represented by IP and then the ratio between the noise power and image power yields the image’s relative complexity. Thus, image’s complexity β can be defined as; β=
IP P
(2)
β value falls into [0,1] range. Images that produce the results near 1 are more complex. DCT
Low Pass
Zig-Zag Scan
Band Pass
High Pass
(NxN)/64
(a)
max_L max
(b) Figure 1. (a) Zig-Zag scanning process for an 8x8 DCT of a block (b) System overview of the first step
max_M max_H
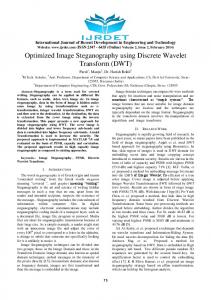
3. Results Proposed method is tested on twelve 512x512 eight-bit gray level images. Matlab environment is used for developing code. We categorize the gray level images according to the image complexity, which is measured by the proposed algorithm. Arrangement obtained by the algorithm is consistent to the human visual system results. Fig. 2 lists twelve images used for experiments with different complexity values represented by the β. Pictures are indexed according to their complexity level calculated by the proposed algorithm. Images exhibiting a high degree of variance will compress less well than images that exhibit a high degree of uniformity. Therefore, compression ratio of an image exhibits some information about image complexity. Table 1 shows the ascending order of complexity of images according to their compressibility with both Jpeg and Jp2 standards.
146
The Second International Conference “Problems of Cybernetics and Informatics” September 10-12, 2008, Baku, Azerbaijan. Section #1 “Information and Communication Technologies” www.pci2008.science.az/1/39.pdf
(1) β = 0.1
(2) β = 0.23
(7) β = 0.53
(8) β = 0.56
(3) β = 0.27
(9) β = 0.61
(4) β = 0.3
(5) β = 0.43
(10) β = 0.69 (11) β = 0.85
(6) β = 0.5
(12) β = 0.89
Figure 2. Complexity values of sample images Table 1. Complexity order according to proposed and the two image compression algorithms. Proposed Algorithm [Image #] 1
2 3 4 5 6 7 8 9 10 11 12
Jpeg [Image #]
2
1 3 4 5 6 7 8 9 10 12 11
Jp2 [Image #]
2
1 4 5 6 3 7 8 9 10 12 11
4. Conclusion Results of the proposed algorithm may be used for other applications directly. Since the results are normalized, one does not need any interpretation of the results. Upper limit and lower limit provides us interpretation capability about the image’s complexity. Future work may be the definition of fuzzy decision rule base for making a better decision about image’s complexity. Complexity order overlaps for most of the pictures for proposed method and two well-known image compression algorithms as shown in Table 1. Literature 1. R.J. Anderson, F.A.P. Petitcolas. On the limits of steganography, IEEE J. Select. Area Commun., Vol. 16 (1998) pp. 474–481. 2. S. Katzenbeisser, F.A.P. Petitcolas. Information Hiding Techniques for Steganography and Digital Watermarking, Artech House Inc., Boston (2000). 3. F. Yaghmaee, M.Jamzad, Computing watermark capacity in images according to their quad tree, International Symposium on Signal Processing and Information Technology (2005). 4. M. Jamzad, F.Yaghmaie, Using Image Complexity According To Achieving Higher Stability In Digital Watermarking, International Conference ICIAR (2004). 5. Q. Liu, A.H.Sung, B. Ribeiro, M.Wei, Z.Chen, J.Xu. Image complexity and feature mining for steganalysis of least significant bit matching steganography. International Journal of Information Sciences, Vol. 178 (2008) pp. 21-36.
147