Scientific Section
Boschetti M. et al. Italian Journal of Agrometeorology 40 - 49 (3) 2006
ESTIMATION OF PARAMETERS DESCRIBING MORPHO-PHYSIOLOGICAL FEATURES OF MEDITERRANEAN RICE VARIETIES FOR MODELLING PURPOSES STIMA DI PARAMETRI MORFO-FISIOLOGICI DI INTERESSE MODELLISTICO PER VARIETÀ DI RISO MEDITERRANEE Mirco Boschetti 1,2 *, Stefano Bocchi2 , Daniela Stroppiana1, Pietro Alessandro Brivio1 1
IREA-CNR, Institute for Electromagnetic Sensing of the Environment, National Research Council, Via Bassini 15, 20133 Milano, Italy. 2 Department of Crop Science, University of Milano, Via Celoria 2, 20133 Milano, Italy * Corresponding Author : Tel. +39-02-23699297, E-mail:
[email protected], Fax: +39-02-23699300. Received 23/9/2006 – Accepted 6/12/2006
Abstract This paper illustrates the estimation of parameters describing some morphological and physiological characteristics of Japonica-type and Indica-type rice varieties to be used for crop models parameterization. Seasonal variability of Specific Leaf Area (SLA; m2 kg-1) was determined from biomass and Leaf Area Index (LAI; m2 m-2) measurements. Coefficient of light extinction (k; -) was estimated by transmittance measurements recorded by LAI2000. Radiation Use Efficiency (RUE; g MJ-1) was derived by regressive analysis between different above ground biomass measurements and corresponding cumulative Absorbed Photosynthetically Active Radiation (APAR; MJ m-2). Results show that development stage determines more variability in SLA than cultivar typology. k parameter varies during the different plant developing stages in agreement with other published data; however, no significative difference is evident among the varieties, representative of different rice-group, when a mean seasonal value of 0.53 is derived. The analysis highlighted a sensible difference in RUE values between traditional tall Japonica variety (1.83 g MJ-1) and new semi-dwarf Indica variety (3.14 g MJ-1). A method to account for thermal limitations to RUE derived by field experiment is proposed. Applying this procedure, an unstressed RUE value (required by simulation models) for Japonica type medium late and Indica type early varieties was found to be respectively 2.69 and 3.25 g MJ-1.
Keywords: Oryza sativa L., coefficient of light extinction, radiation use efficiency, specific leaf area, above ground biomass, leaf area index, simulation model.
Riassunto Il presente lavoro descrive le metodologie adottate per la stima di alcuni parametri morfo-fisiologici della coltura riso utili alla parametrizzazione di modelli di crescita e produzione. La sperimentazione ha permesso di calcolare per due gruppi di varità, tipologia Japonica e tipologia Indica, la variabilità stagionale dell’ area specifica fogliare (SLA; m2 kg-1), come rapporto tra misure di indice di area fogliare (LAI; m2 m-2) e misure di biomassa e di stimare, grazie a misure di trasmittanza acquisite con lo strumento LAI2000, valori del coeffiente di estinzione della luce (k; -). Il parametro Radiation Use Efficiency (RUE; g MJ-1) è stato ottenuto con analisi di regressione tra periodici campionamenti di biomassa e relativi valori cumulati di Absorbed Photosynthetically Active Radiation (APAR; MJ m-2). I risultati mostrano che lo stadio di sviluppo determina una grande variabilità del parametro SLA per entrambi i gruppi di varietà analizzati. Il parametro k presenta una variabilità in funzione della varietà e dello stadio di sviluppo in accordo con altre pubblicazioni. Non si sono tuttavia evidenziate differenze significative tra le varietà nella stima di un valore medio annuo (0.53, -). La stima della RUE ha invece rilevato differenze sostanziali tra varietà tradizionali a tipologia Japonica (1.83 g MJ-1) e nuove varietà a profilo Indica (3.14 g MJ-1). Un metodo originale viene proposto nella stima della RUE basata su dati sperimentali di campo per compensare eventuali limitazioni termiche. Applicando tale procedura, sono stati ottenuti valori potenziali del parametro RUE, richiesti per la simulazione modellistica, per le varietà appartenenti alla tipologia Japonica con ciclo medio (2.69 g MJ-1 ) e a tipologia Indica a ciclo corto ( 3.25 g MJ-1).
Parole chiave: Oryza sativa L., coefficiente di estinzione della luce, efficienza d’uso della radiazione, Area Specifica Fogliare, biomassa, Indice di Area Fogliare, modelli di simulazione. Introduction Computer models can be efficiently used to simulate growth and yield of many crops since the 70s. Performances of these models depend on reliable parameterizations which require specific experiments to measure and estimate the proper crop parameters.
40
The WARM model (Confalonieri et al., 2005) was developed in order to find the best balance between reliability and usability by reducing the number of parameters to a minimum directly measurable or derivable from measured data. The net photosynthesis is simulated on
Scientific Section
the basis of the Monteith’s model (Monteith, 1977), also known as Radiation Use Efficiency (RUE), that defines the Above Ground Biomass accumulation (AGB, g m-2) for a given time period as APAR multiplied by RUE coefficient. Light interception by the canopy is estimated, assuming a monolayer canopy, from LAI and k using the Lambert-Beer’s law (Monsi and Saeki, 1953). Daily leaf area development is calculated as a function of the biomass partitioned to leaves each day and the development stage specific SLA. In order to apply RUE-based models, such as WARM, for rice regional monitoring in Mediterranean-European environment, crop specific parameters are needed. No dedicated field studies have been carried out to measure the previous mentioned parameters for Mediterranean varieties. In particular, for RUE, Campbell et al. (2001) noted that although rice is the most important food crop in the world, little field-scale, season-long research on RUE has been conducted. For these reasons the objective of this work was the estimation k, RUE, SLA, and Harvest Index (HI; -) to be used in crop modelling for regional estimates of rice production. The variability of these parameters as a function of phenology and variety was analysed by collecting data in two field experiments carried out in 2003 and 2004. A method to estimate maximum potential RUE for modelling application not affected by temperature limitation was tested using also other available experimental field data set. Not all the parameters necessary to run complex explicative models were estimated, but only those usually considered the most important in describing LAI development and light harvesting in RUE-based approach. For all the estimated parameters, the group-of-varieties approach proposed by Confalonieri and Bocchi (2005) was followed, estimating specific sets of crop parameters for Indica type early varieties (IE), Japonica type early varieties (JE) and Japonica type medium-late varieties (JM).
Physiological and modelling meaning of the selected parameters A short description of the physiological and modellistic meaning and importance of SLA, k, HI and RUE parameters are here presented Specific Leaf Area Specific leaf area is the leaf area (m2) to leaf mass (kg) ratio. SLA values range between 15 and 40 m2 kg-1 depending on crop typology but present also an intraspecific variability. Physiologically, high SLA values reduce the amount of assimilate required to produce a given leaf area, this results in an earlier ground cover and consequently a greater light harvest that produces a higher assimilation rate early in the season. It is one of the most important parameters in crop simulation models because it determines the amount of green area index (GAI; -) produced in a day.
Boschetti M. et al. Italian Journal of Agrometeorology 40 - 49 (3) 2006
Coefficient of light extinction The coefficient of light extinction k describes the capacity of the canopy of light interception. k coefficient is crop specific but can differ also on the basis of cultivated varieties. The light extinction capacity depends on the plant morpho-physiological conditions and consequently it varies during the season dependently on plant development. As underlined by Kiniry et al. (2001) lower values of k allow a better light penetration into the canopy thus illuminating more leaf area that guarantee a more efficient light harvest. This characteristic is typical of plant with more upright leaves. In crop modelling this parameter describes the light penetration through the canopy and is used to quantify, through the Lambert – Beer’s law (Monsi and Saeki, 1953), the fraction of Absorbed Photosynthetically Active Radiation (fAPAR) (equation 1). High k values determine strong light absorption while lower value determines a deeper light penetration in the canopy. fAPAR = 1 − exp − k *LAI
( 1)
Wageningen models (e.g. WOFOST; Van Keulen and Wolf, 1986) requires different k values for different development stages. Other models such as CropSyst (Stöckle et al., 2003) or WARM (Confalonieri et al., 2005) use a mean k value for the entire crop cycle. For this reason k parameter variations were analysed along the season and a crop mean value was also estimated. Harvest Index The harvest Index describes the ratio between the commercial part (in case of cereals is grain) and the total above ground biomass at the end of the crop cycle. The concept of HI was used during the cultivars selection to obtain better ratios between source-sink organs. The semi-dwarf cultivars have lower biomass production but a higher grains weight being also more resistant to lodging and more stable in terms of grains production over the years. Before the Green Revolution, HI of many crops was 0.3 or less, and now it has been increased to about 0.5 in many cases. Modern high-yielding rice varieties can reach HI greater than 0.6. For some crop models once total biomass production is simulated, rice yield can be estimated by applying a specific HI. Italian varieties range from traditional low yielding cultivar (HI ≈ 0.38) to new high yielding (HI > 0.5). Radiation Use Efficiency The amount of CO2 assimilated by the crop canopy and converted to dry biomass can be considered nearly stable per unit of intercepted/absorbed solar radiation under non stress condition (Monteith, 1977; Sinclair and Muchow, 1999). At canopy level, the saturation limiting processes that occur in leaf photosynthesis are far less pronounced so linear model can be used (Kiniry et al., 1989). RUE can be experimentally measured over a period of time as crop dry weight increases divided by APAR referred to the same period (Sinclair and Muchow, 1999). The amount of APAR used for RUE estimation depends
41
Scientific Section
Boschetti M. et al. Italian Journal of Agrometeorology 40 - 49 (3) 2006
Tab. 1 – Rice parameters (SLA, k, RUE, max LAI and HI) values found in international literature. Tab. 1 – Valori pubblicati dei parametri della coltura riso (SLA, k, RUE, max LAI and HI) . Parameter SLA (m2 kg-1)
K (-)
RUE (g AGB MJ-1)
LAI (max)
HI (-)
Value 39 27-60 35 26.6 23 0.4 -0.6 0.35 0.49 0.61 0.65 0.35 0.30 - 0.38 0.47 0.38-0.40 0.45 0.42 0.68 4.1 3.28 2.25 2.2 2.34 2.37 2.41 2.32 2.46 2.41 2.77 2.09 2.59 2.21 2.24 5.09 3.52 >5 > 7.0 5.7 - 8.2 6.7 - 10.4 6.0 - 7.0 > 7.0 5.8 3.0 5.3 6.8 11.2-12.7 0.35 - 0.50 0.44-0.48 0.36-0.62
Temp.var. after 31 days after 30 days after 31 days after 46 days after 64 days DVS F
Pr > F
APAR
< 0.0001
< 0.0001
Year
0.600
0.16*
CV_class
0.893
0.916
a value of 3.14 g MJ-1 with respect to the lower values of 1.83 g MJ-1 (Japonica traditional varieties) and 1.88 g MJ-1 (recent Japonica varieties). Differences between Japonica and Indica type can be justified by difference in morpho-physiological characteristics. Estimation of light extinction coefficient (k) for the two rice typologies underline that new Indica type present lower k values that produce better illumination of lower canopy leaves thus maximising total canopy RUE (Kiniry et al., 2001). However, our estimates for Japonica are lower compared to values found in literature. If all the data are separated according to the year of the
b 1200
Besate Volano 2003
1600
1000
y = 2.64x - 154.57 R2 = 0.97
1400
800
Rosate europa 1990 y = 1.99x - 13.04 R2 = 0.93
600
Rosate cripto 1990 y = 1.69x - 81.16 R2 = 0.90
400 200
Rosate loto 1990
0 0
200
400
600 -2
APAR (MJ m )
800
y = 1.88x - 90.87 R2 = 0.94
-2
Biomassa (g/m )
-2
Biomassa (g/m )
a
No Temp. Limited
Vignate 2002 y = 3.44x - 91.04 R2 = 1.00
1200 1000
Opera 2004 y = 2.96x - 34.40 R2 = 0.93
800 600 400 200 0 0
100
200
300
400
500
Opera 2002 y = 3.45x + 32.98 R2 = 0.99
-2
APAR (MJ m )
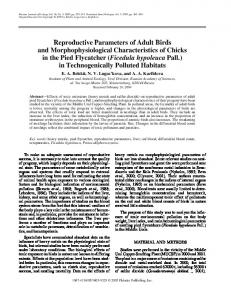
Fig. 6- Biomass vs APAR for all the separated datasets. Japonica group (a) and Indica group (b) data. Fig. 6- Scatter-plot Biomassa vs APAR per tutti i data set rappresentati separatamente per le varietà a tipologia Japonica (a) e Indica (b).
47
Scientific Section
Boschetti M. et al. Italian Journal of Agrometeorology 40 - 49 (3) 2006
Tab. 6- Summary of crop parameters estimated from field experiments for Indica Early (IE) and Japonica Medium late (JM) rice varieties. Tab. 6 - Riassunto dei parametri della coltura riso stimati da dati sperimentali per varietà a tipologia Indica Early (IE) e Japonica Medium late (JM). Unit
Phen. Stage Descript.
m2 kg-1
0.20
21
27.20 28.51
0.25
27
28.68
-
0.38
29
20.92
-
0.42
30
22.16 17.17
0.44
32
20.62
booting
0.79
48
17.70 19.49
heading
0.97
56
18.89
0.25-0.38
21-23
0.20
21
stem elong.
mean first stages tillering
k
-
RUE
g MJ-1
LAI
-
JM
BBCH
tillering
SLA
IE
DVS
-
27.50 28.50 0.43
0.58
stem elong.
0.44
32
0.45
0.53
booting
0.79
48
0.49
0.59
heading
0.90
53
-
0.60
anthesis
1.0
58
0.64
-
-
-
0.52
0.53
-
-
3.13
1.83
-
-
3.25
2.69
mean seasonal seasonal Potential Max* mean rice
-
-
max
0.9-1.0
56
2.90 ~6
~7
maturity 2.0 99 0.53 0.39 mean seaso70° 60° MTA** degree nal ** Mean Tilt Angle (MTA) foliage orientation respect to the zenith direction * Potential Max RUE calculated taking into account temperature limitatio HI
-
experiment, it is possible to see higher difference among RUE estimation in the Japonica rice group (figure.6a) compared to Indica group (figure 6b). Differences in RUE estimation among the available datasets can be related to temperature. Table 4 shows the average daily mean temperature for each month of the growing seasons of the experimental data analysed here. These data show that 1990 was the coldest year; in particular, mean temperature for the May-July period is 2°C lower than the other years. 2003 was the hottest year of the century and present the highest temperatures; however 1990 is also ~ 2 °C colder than 2002 and 2004 for the period Jul-Sept. RUE Max estimation Specific values proposed for modelling different rice group, obtained separating the different data set and considering thermal limitation, are: 3.25 g MJ-1 for IE (R2=0.90), 2.77 g MJ-1 (R2=0.95) for JE and 2.69 g MJ-1 (R2=0.91) for JM.
48
Analysis of covariance (Table 5) showed that when temperature limitation is not taken into account the categorical variable Year is significant (*, P